Fisher Transform MSI

MSI-FT Bi-Driven

What It Does and Why It Matters

The problem it solves 

The Fisher Transform tells you where price sits within its recent range, and when momentum is turning. On its own it answers one question: is Fisher above or below its Trigger? Traders who rely on that alone enter late, exit late, and cannot tell whether a signal is fresh or stale.

MSI-FT Bi-Driven answers the questions that come after that one.

Trader's question What answers it
Is a cross actually coming, or is Fisher just moving fast? PROXIMITY
Is the move still building? SLOPE
Is Fisher on the right side of zero? REGIME
Is price at an extreme where a reversal is likely? ZONE
Do the higher timeframes agree? HTF filter
Is this signal still valid or has it aged out? Signal Age
Which direction does the evidence actually favour right now? Confidence meter
Why did the EA not take that trade? Status line

Five signal layers, not one

Each layer measures a different property of the same Fisher calculation. They are independent — they can agree, disagree, or split.

  • SIGNAL — Fisher crossed its Trigger. The classic crossover.

  • PROXIMITY — Fisher is closing on its Trigger. Detects the approach, not the arrival. This is the earliest warning the EA produces.

  • SLOPE — Fisher is trending up or down over the last three bars. Confirms the move is still in motion.

  • REGIME — Fisher is above or below zero. Slowest, most stable context.

  • ZONE — Overbought, oversold, or extreme. Context for whether a reversal is likely.

Each can be toggled on or off. Each contributes a fixed weight to the confidence score when enabled.

Confluence, not coincidence

A single layer firing is one opinion. Two or more agreeing is a decision.

The confidence meter aggregates the enabled layers into two independent scores — one for BUY alignment, one for SELL alignment. The weights are fixed and disclosed:

Layer Weight
SIGNAL 30
PROXIMITY 25
SLOPE 20
REGIME 15
ZONE ±10 / ±5

The two scores do not sum to 100. Both can be high when the layers disagree — which is exactly the moment to stand aside. Both low means no edge. The meter shows this instantly.

Entry logic: OR or AND

  • OR — any enabled layer triggers. More trades, earlier entries.

  • AND — all enabled layers must agree. Fewer trades, tighter filter.

A single input toggles between them. No code editing, no parameter rebalancing.

The HTF filter — five modes, one input

The EA reads one column across three higher timeframes and votes 2-of-3.

Mode What it filters on Character
SIGNAL Crossover consensus Fastest
PROXIMITY Cross-imminent consensus Earliest
SLOPE Trend consensus Balanced
REGIME Sign consensus Slowest
ZONE Extreme gate only — no directional filter Context only

BULLISH consensus allows BUY, blocks SELL. BEARISH does the opposite. NEUTRAL allows both. In ZONE mode the filter stops being directional and becomes a gate: extreme overbought blocks BUY, extreme oversold blocks SELL.

Event mode vs State mode — one switch

Mode Behaviour
STATE-DRIVEN Re-enters on the next bar if signals stay aligned. Pyramids into a running trend.
EVENT-DRIVEN One entry per signal transition. Waits for the state to flip before entering again.

Both modes respect every filter — HTF, ZONE gate, spread, session, position limits, staleness, proximity. The switch changes how often entries occur, not whether they are filtered.

Trade lifecycle management

The EA runs the position from open to close, not just at entry.

  • Take profit and stop loss — set at entry, enforced against broker minimum distance.

  • Breakeven — moves the stop to entry plus a buffer once profit reaches a threshold. Can be set as a percentage of TP or a fixed number of points.

  • Trailing stop — activates at a defined profit level and trails by a fixed distance with a step filter to prevent churn. Can be held back until breakeven is reached.

  • Partial close — closes a portion of the position at defined profit levels. Can be a fixed number of points or a percentage of TP.

  • Reversal — when an exit signal fires and the opposite direction is now valid, the EA closes and reverses in one operation.

Every management step respects the broker's stops level and freeze level.

Risk management

  • Position limits — separate caps for BUY and SELL. Set either to zero to run long-only or short-only. Set both positive for two-way operation.

  • Lot sizing — fixed lots, percent of balance risked against the stop, or a fixed percent of equity. The chosen method scales the lot automatically.

  • Margin safety — before every order, the EA checks that required margin stays within a fraction of free margin. If it does not, the lot is reduced to fit, or the trade is skipped. No margin-call-by-EA.

  • Spread filter — blocks entries when the spread exceeds a threshold. The threshold is yours to set.

  • Session filter — restrict trading to chosen hours, or leave it open 24/7.

  • Entry spacing — optional minimum distance between same-direction entries, to prevent clustering.

The panel — what the trader sees

One panel, read top-down.

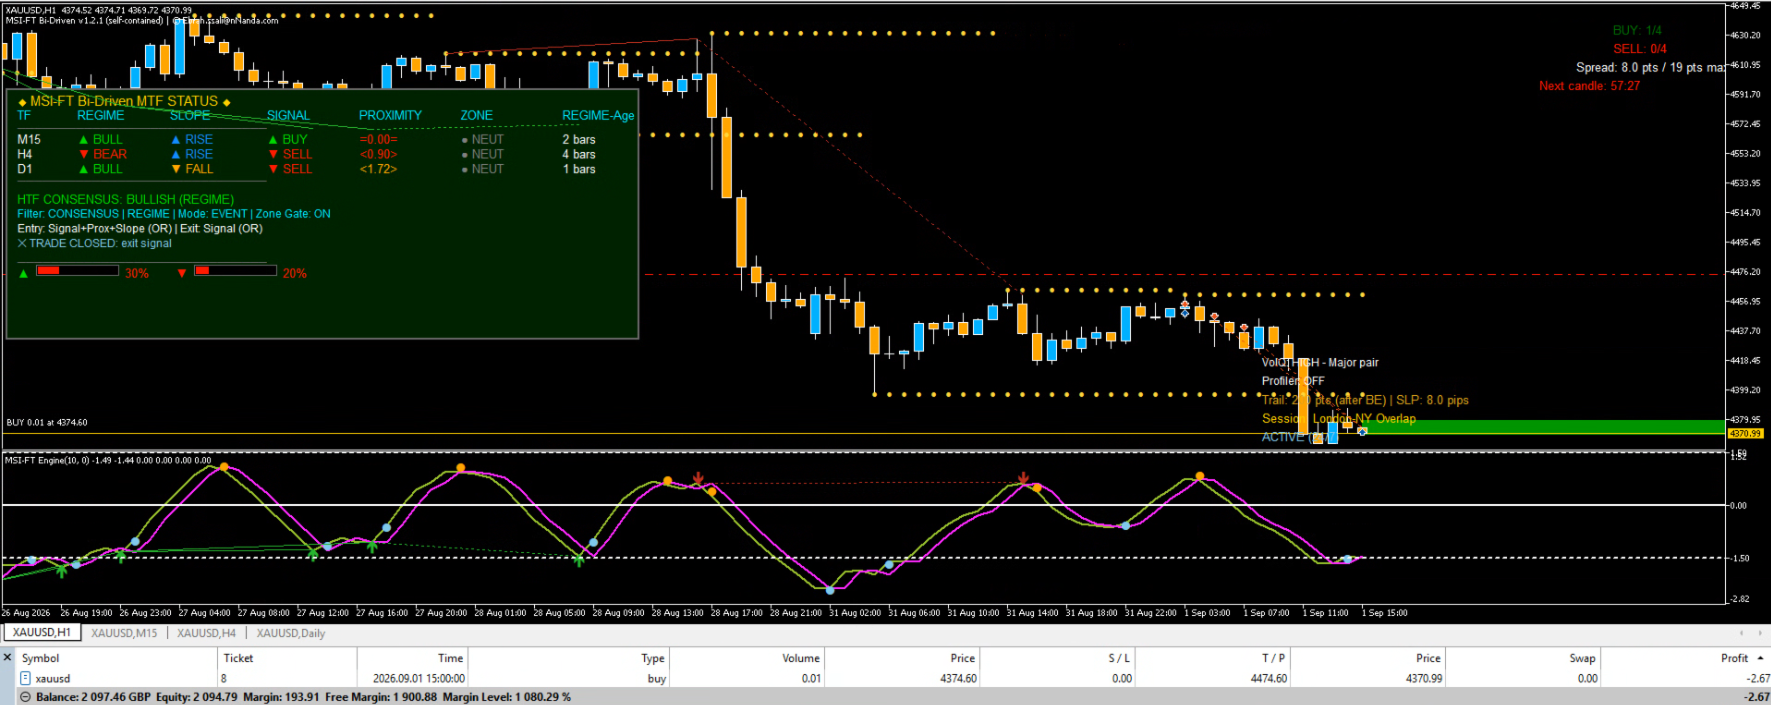
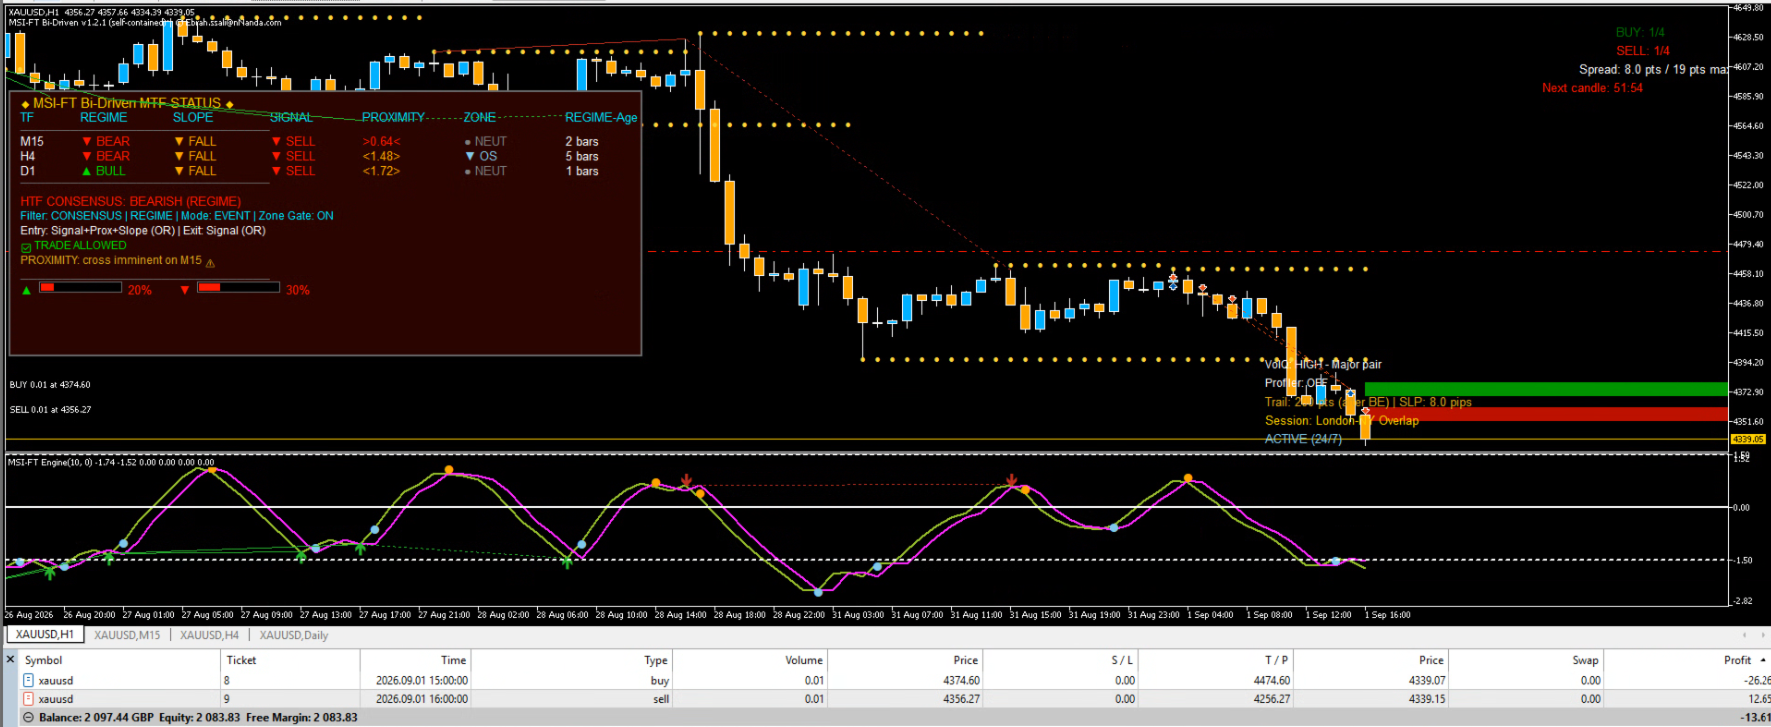
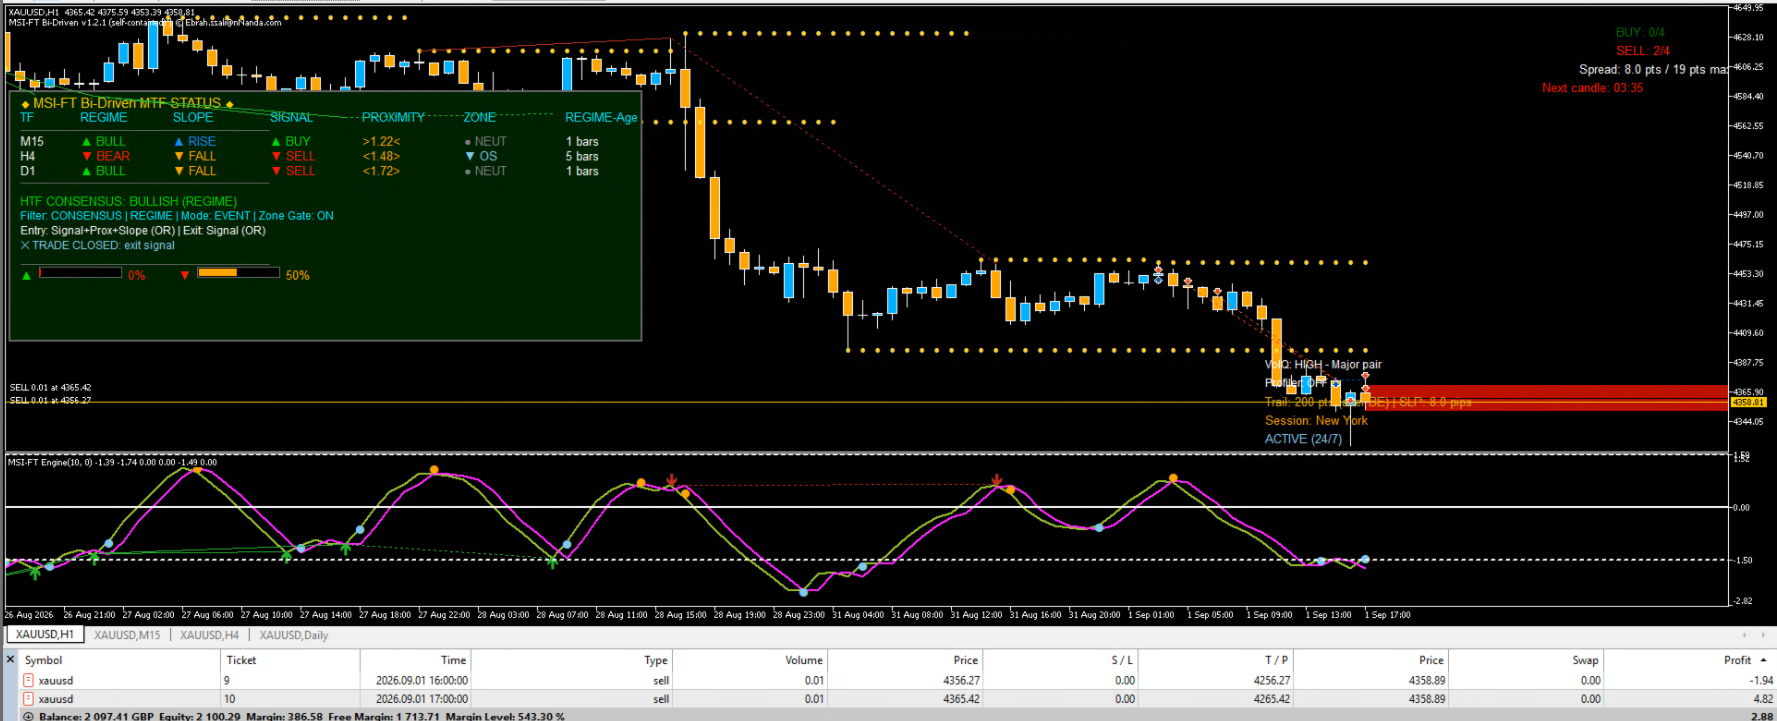
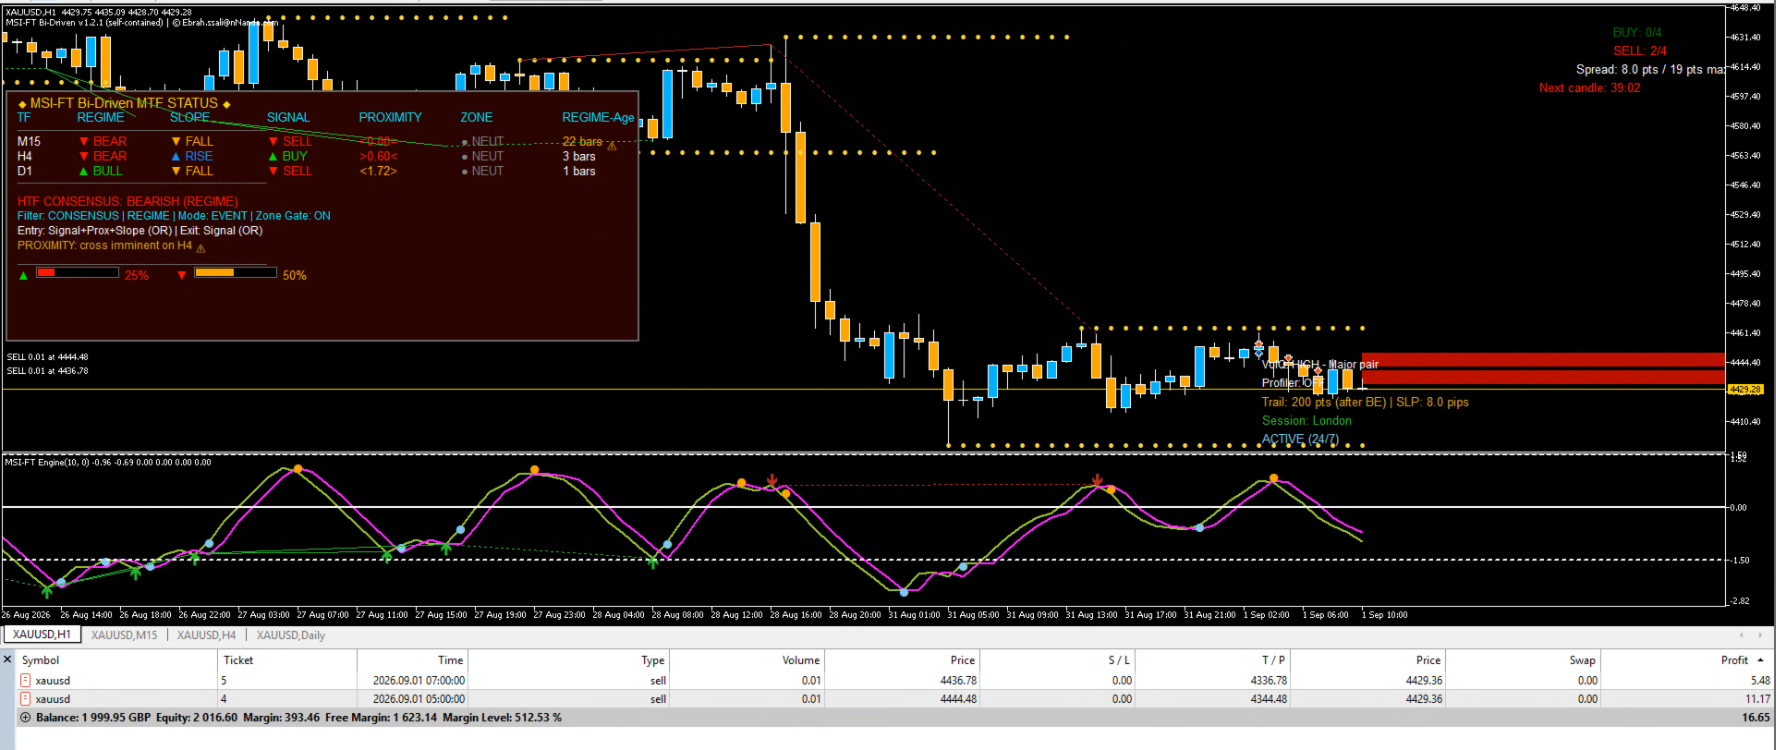
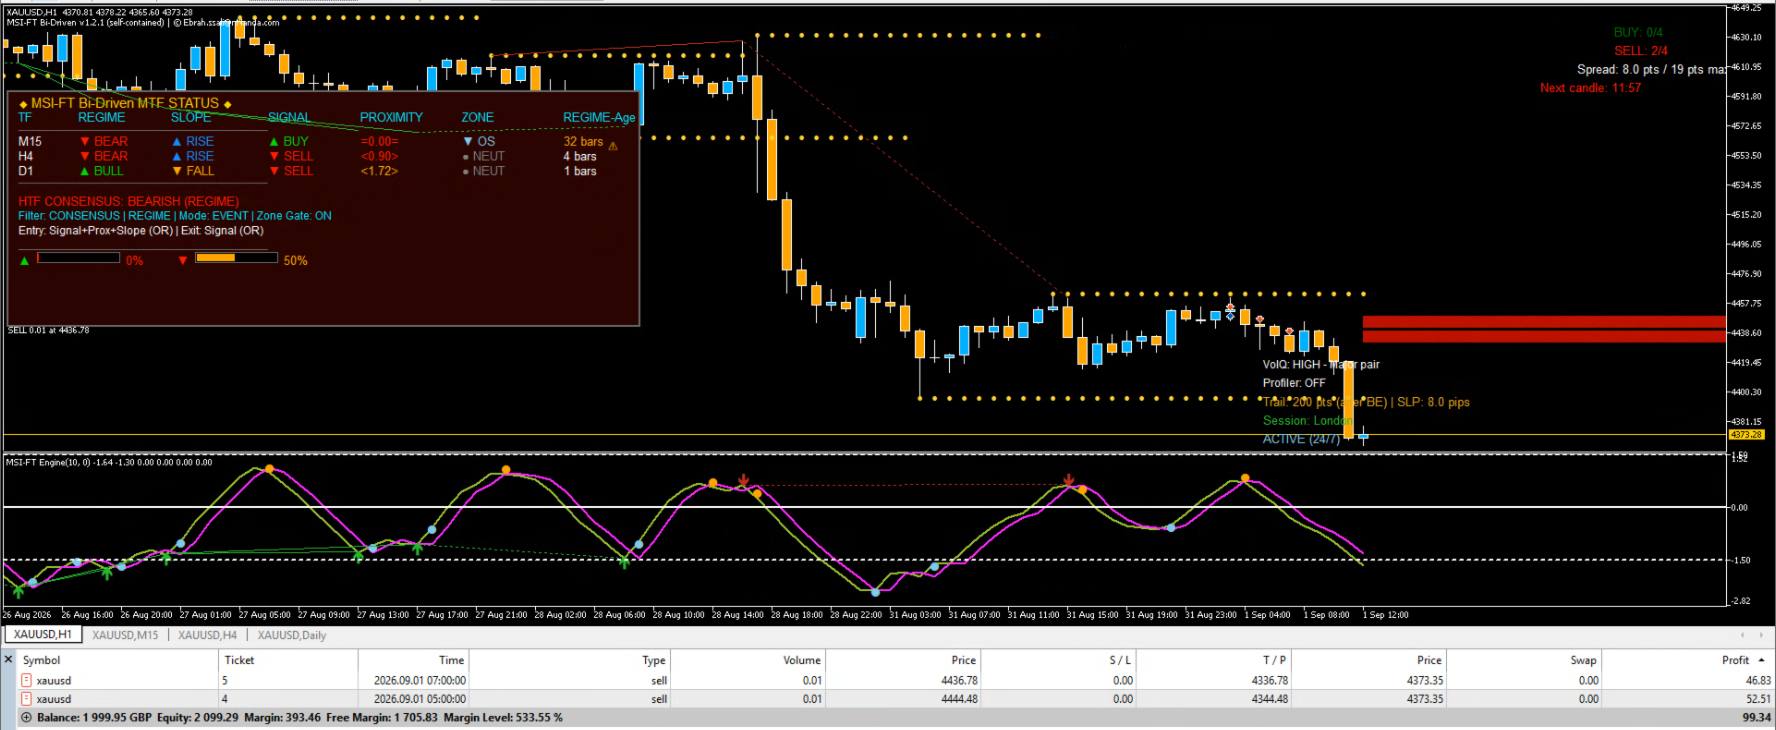
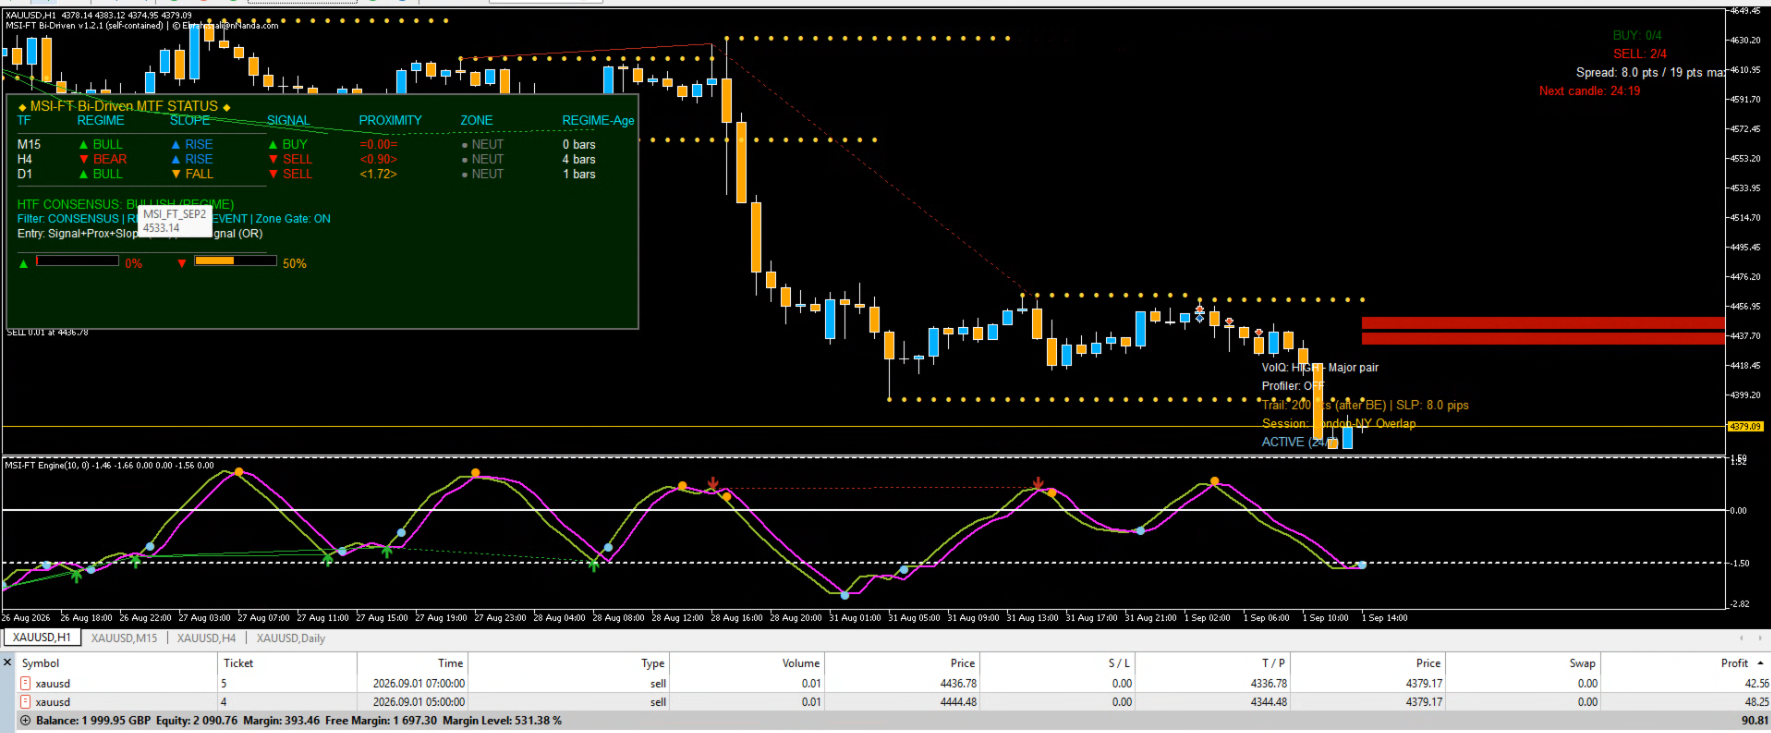
  1. Multi-timeframe table — the five layers for each of the three HTFs, colour-coded, with ages.

  2. HTF consensus — current vote.

  3. Configuration summary — what is enabled, in what logic.

  4. Status line — one of three states, shown only when relevant:

    • ⛔ TRADE BLOCKED: <reason> (red)

    • ✕ TRADE CLOSED: <reason> (sky-blue)

    • ✅ TRADE ALLOWED (green)

  5. PROXIMITY footer — names the timeframes where a cross is imminent. Shown only when applicable.

  6. Confidence meter — two independent bars for BUY and SELL alignment.

Nothing is shown unless it means something. The panel is quiet when nothing is happening and informative when something is.

The PROXIMITY layer — the edge

The classic Fisher crossover plots on the closed candle. By the time it appears, the move has begun.

PROXIMITY measures whether Fisher is closing on its Trigger, not merely moving fast. It detects the approach and reads the direction from the sign of the gap:

  • Fisher above Trigger and closing → down-cross imminent → SELL precursor

  • Fisher below Trigger and closing → up-cross imminent → BUY precursor

The distance is normalised by Fisher's own recent volatility, so the same thresholds work on gold, FX, indices, and crypto without re-tuning. Two safeguards filter false starts:

  • A touch band — when the gap is inside it, the state goes neutral because direction is ambiguous.

  • A minimum convergence count — require N consecutive converging bars before reporting.

The result is a signal that arrives before the plotted crossover without firing on every Fisher wiggle.

Configuration

Eight inputs cover the entire signal engine:

Input What it does
EventDrivenMode State or event entry behaviour
EntryLogic / ExitLogic OR or AND
UseEntry / UseExit Which layers participate
HTFColumn Which column the HTF filter reads
UseZoneGate Extreme-zone block
ProximityTouchNorm / ProximityVeryCloseNorm Touch band and footer threshold
ProximityATRLen / ProximityMinConvergeBars Normalisation length and confirmation

Everything else is risk, display, or notification, and all of it has a working default. The EA trades out of the box with no configuration change. Tuning is optional, not required.

What it does not claim

It does not predict price. It does not guarantee profit. It does not publish a win rate. It aggregates Fisher state across five independent properties, weights them, filters them, and acts when the aggregate meets your configured logic. Whether that produces an edge on your instrument and timeframe is a question only your own testing can answer.

Who it is for

The trader who already uses the Fisher Transform and wants it to answer more than one question at a time. The trader who wants a multi-timeframe view without maintaining three charts. The trader who values a status line that says why the EA did nothing, as much as one that says what it did. The trader who wants the signal engine disclosed, weighted, and visible — not hidden behind a black box.
제작자의 제품 더 보기
The Ultimate Ichimoku MTF Dashboard: Your All-In-One Trading Edge Transform Your Trading with One Powerful Indicator Imagine having a professional trading assistant that monitors multiple timeframes simultaneously, identifies high-probability entries, warns you of potential reversals, and provides clear risk management guidance-all in one clean, intuitive display. That's exactly what the Ichimoku MTF Dashboard delivers.     Why This Isn't Just Another In
Cumulative Volume Delta (CVD) MA-X Plus: 궁극의 오더 플로우 프레임워크 CVD MA-X Plus 와 함께 시장의 숨겨진 메커니즘을 파헤쳐 보세요. 일반적인 거래량 지표는 단순히 '얼마나' 거래되었는지만 알려주지만, CVD MA-X Plus는 누가 싸움에서 이기고 있는지, 언제 이기고 있는지, 그리고 '스마트 머니'가 어디에 닻을 내리고 있는지를 보여줍니다. 틱 단위 가격 액션(주식/선물/골드와 같은 규제 시장에서는 'Real Volume'으로 설정 가능)과 다층 거래량 분포를 집계하여 시장의 확신, 고갈 및 유동성에 대한 선명한 지도를 제공합니다. 본 지표는 다음 링크에서 제공되는 CVD MA-X의 진화 버전입니다: https://www.mql5.com/en/market/product/162375?source=Site+Profile+Seller 트레이더의 엣지: 왜 CVD MA-X Plus로 업그레이드해야 하는가? 대부분의 트레이더가 실패하는 이유는
MTF Connecting Fractals Multi-Timeframe Market Structure. One Glance. Real Decisions. MTF Connecting Fractals is not just another arrow-printing indicator. It’s a complete multi-timeframe market structure intelligence system designed to answer the most important trading questions in real time - clearly, visually, and without clutter. Built around fractals as objective structure anchors, this tool gives traders a decisive edge by combining price action, structural context, proximity risk, and
Critical Market Session Information with a Single Glance Stop juggling multiple tools and squinting at time zone converters. The SessionInfoDisplay Indicator is your new, indispensable trading co-pilot that puts real-time market intelligence directly on your chart.   What It Does: Your Essential Trading Dashboard   This intelligent indicator provides three critical pieces of information at a glance: 1. Real-Time Session Detection    - Automatically identifies which major financial session is act
FREE
Clr-Dynamic RSI v SMA Indicator : A Comprehensive Analysis of Features and Advantages The Clr-Dynamic RSI v SMA indicator represents a significant evolutionary leap in technical analysis tools, transforming the classic Relative Strength Index (RSI) from a potentially ambiguous oscillator into a sophisticated, multi-dimensional trading system. At its core, this indicator retains the mathematical foundation of the RSI, measuring the speed and change of price movements, but radically enhances its
MTF Candlestick Patterns Detector: 당신의 궁극적인 프라이스 액션(Price Action) 지휘 본부 빠르게 급변하는 트레이딩의 세계에서, 단 하나의 반전 패턴을 놓치는 것은 수익성 있는 한 주와 기회를 날려버린 주 사이의 차이를 만듭니다. MTF Candlestick Patterns Detector 는 모든 타임프레임에서 24가지 이상의 전설적인 캔들스틱 패턴을 동시에 스캔, 감지 및 집계하도록 설계된 전문가급 MQL5 지표입니다. 차트를 뒤지며 추측하는 일을 멈추십시오. 알고리즘이 높은 확률의 셋업을 당신에게 직접 가져다줍니다. 트레이더의 우위: 왜 이 지표인가? 대부분의 캔들 지표는 지연된 데이터로 차트를 어지럽힙니다. 본 감지기는 콕핏(조종석) 역할을 하는 멀티 타임프레임(MTF) 패널 을 제공하여 가장 중요한 트레이딩 질문에 한눈에 답합니다: 추세 구조는 어떠한가? 패널은 "추세 패턴"(MN1 ~ H4)과 "진입 패턴"(H1 ~ M5)을 구분하여
MTF VWAP Indicator - Quick Overview   This indicator shows you where institutional money is flowing across multiple timeframes using Volume Weighted Average Price (VWAP) to identify high-probability trading zones. New version has VWAP bands plotting capability if user enabled and display panel (whose background changes colour on confluence) can be toggled on/off.      What It Actually Does:     1. Tracks Smart Money Levels: - Shows Daily, Weekly, and Monthly VWAP lines where big players (banks,
Indicator Overview This is a sophisticated Multi-Timeframe (MTF) indicator that not only applies the classic Fisher Transform formula but integrates it into a comprehensive trading system featuring a real-time dashboard. The indicator excels at pinpointing reversals through advanced divergence detection and providing a clear, multi-timeframe view of market structure.     How It Works: Core Fisher Logic   1.   Normalization and Signal Generation         The indicator transforms price (using med
MTF WAD Simplified Indicator - Professional Trading Solution     Overview The MTF WAD Simplified is a sophisticated multi-timeframe volume-based indicator designed to track smart money flow across financial markets. By monitoring the Williams Accumulation/Distribution (WAD) across 8 different timeframes, this tool provides traders with unprecedented insight into institutional accumulation and distribution patterns.     Core Benefits for Traders     1. Smart Money Tracking - Detect Institutional
RSI v SMA MTF Indicator : Professional Trading Edge in One Tool   Summary The RSI v SMA MTF Indicator is a sophisticated, multi-timeframe momentum analysis tool that transforms the traditional RSI into a powerful, actionable trading system. By combining RSI slope analysis with SMA crossover signals, divergence detection, and real-time multi-timeframe confluence, this indicator provides traders with a more comprehensive view of market momentum across all relevant timeframes.     Core Utility an
Cumulative Volume Delta MA-X MTF (Gradient Momentum 포함) 이 지표는 MetaTrader 5를 위한 다중 타임프레임(MTF) 누적 거래량 델타(CVD) 분석을 수행합니다. 틱 데이터 또는 리얼 볼륨 데이터를 분석하여 매수 압력과 매도 압력 사이의 순 차이를 계산함으로써, 오더 플로우의 심리 상태를 시각적으로 표현합니다. 지표 로직 및 주요 기능 본 지표는 다음과 같은 수학적 접근 방식을 통해 거래량을 분석합니다. 데이터 소스: 거래소 자산의 리얼 볼륨(Real Volume)과 외환(Forex)/CFD를 위한 OHLC 윅 프록시(OHLC Wick Proxy) 계산 방식을 모두 지원합니다. 그라데이션 시스템: 4색 이동평균선이 다음과 같이 추세 단계를 식별합니다. DeepSkyBlue(하늘색): 양수 값, 상승 중. Orange(오렌지색): 양수 값, 하락 중. Magenta(자주색): 음수 값, 하락 중. Purple(보라색): 음수 값, 상
Cumulative Volume Delta (CVD) MA-X: 지능형 오더 플로우 센티먼트 도구 Cumulative Volume Delta (CVD) MA-X 를 통해 시장의 숨겨진 메커니즘을 파악해 보세요. 일반적인 거래량 지표는 '얼마나' 거래되었는지만 알려주지만, CVD MA-X는 누가 구매자와 판매자 사이의 전투에서 승리하고 있는지, 그리고 그 시점이 언제 인지 알려줍니다. 틱(Tick) 단위의 가격 액션과 거래량 분포를 집계하여 시장의 확신과 고갈 지점을 명확한 지도로 제공합니다. 트레이더의 우위: 왜 CVD MA-X인가? 대부분의 트레이더가 실패하는 이유는 가격 후행성에 반응하기 때문입니다. CVD MA-X는 거래량에 가중치를 둔 캔들의 내부 압력(꼬리 대비 몸통 비율)을 분석하여 **선행적 우위(Leading Edge)**를 제공합니다. 실시간으로 세 가지 핵심 질문에 답합니다: 이 움직임은 실제 자금에 의해 뒷받침되는가? (CVD/제로 라인 정렬) 트렌드가 힘을 잃
Multi-Timeframe Money Flow Index (MTF MFI) with Smart Divergence and Dashboard Unlock the flow of institutional money across every timeframe. Are you tired of guessing the trend only to be trapped by a sudden reversal? The Multi-Timeframe Money Flow Index (MTF MFI) is a professional-grade trading tool designed to provide a bird's-eye view of market liquidity and momentum. By aggregating volume-weighted data from W1 down to M1, this indicator eliminates noise and highlights high-probability tra
MTF Parabolic SAR Maximize your trading efficiency with the Multi-Timeframe Parabolic SAR Trend and Momentum Dashboard. Designed for serious traders who value clarity over clutter, this tool aggregates price action across six timeframes into a single, sleek visual interface.  By combining that reliable classic Parabolic SAR logic with advanced momentum scoring and risk assessment, this indicator transforms raw data into actionable trade signals.  The Strategic Edge: Why This Indicator? Most tra
Multi-Timeframe Heiken Ashi (Smoothed with Dashboard) Professional Market Structure Visualization with Weighted Confluence Scoring Transform your trading with crystal-clear multi-timeframe analysis. This indicator combines smoothed Heiken Ashi candles with an intelligent weighted scoring system to give you unprecedented clarity in any market condition. YOUR TRADING QUESTIONS – ANSWERED INSTANTLY: 1. What's the REAL trend direction? Dashboard Reveals:   Higher timeframe (MN1, W1, D1, H4) trend a
Hybrid BB-LRMA [Trend and Volatility Engine]   Master the markets with the Hybrid BB-LRMA, a professional-grade technical analysis tool that fuses the volatility-tracking power of Bollinger Bands (BB) with the hyper-responsive Linear Regression Moving Average (LRMA) to eliminate lag and pinpoint high-probability entries with arrow Signals   Why Hybrid BB-LRMA? Most moving averages are too slow, and Bollinger Bands alone can be noisy. The Hybrid BB-LRMA solves this by using a gradient-based LRMA
Hybrid FATL Fractal: Professional Digital-Signal Logic   Simplify the Complexity of Market Structure.   Unlock the power of digital signal processing combined with price action geometry. The Hybrid FATL Fractal is a professional-grade technical analysis tool designed to eliminate market noise and pinpoint high-probability institutional turning points. By merging the Fast Adaptive Trend Line (FATL) algorithm with Dynamic Fractal Breakout logic, this indicator provides a dual-layered filter that a
VOLUME PROFILE SAF-XII MT5용 전문가급 마켓 프로파일 분석 도구 (그리드 스타일 트레이더를 위한 드림 인디케이터) 볼륨 프로파일(Volume Profile)이란? 볼륨 프로파일은 단순히 '시간'에 따른 거래량을 보여주는 일반 지표와 달리, 특정 '가격 수준'에서의 거래 활동을 표시하는 전문 기관용 도구입니다. 설정한 기간 내에 거래가 '어디서' 발생했는지를 시각화하여 다음을 식별할 수 있도록 돕습니다. 가치 영역 (VAH/VAL) – 전체 거래의 대부분이 발생한 가격대. 제어 지점 (POC) – 거래량이 가장 많이 집중된 단일 가격 수준. 유동성 불균형 – 각 가격대에서의 매수(Bull) vs 매도(Bear) 지배력. 지지/저항 – 실제 거래 활동에 기반한 자연적인 가격 지지 및 저항선. 3가지 작동 모드 – "설정 후 방치(Set and Forget)" 가능 VP_MANUAL (스윙 트레이딩 및 주요 레벨 분석) 사용자가 수직선을 드래그하여 분석 범위를 직접
Fisher Transform MTF Pro v4.03 Professional Multi-Timeframe Trading Decision System Fisher Transform MTF Pro turns complex multi-timeframe data into clear, actionable trade decisions in seconds. It answers instantly:  What’s the trend?  Where’s the entry?  How strong is the setup?  What are the risks?  Should I buy, sell, or wait?  The Edge   Zero-Line Filter (Trend Protection) Prevents counter-trend trades by default:  No buys above zero  No sells below zero This forces alignment with th
Turtles Pro
Ebrah Ssali
Turtles Professional v2.0 The Legendary Turtle Strategy, Reimagined for the Modern Trader Turtles Pro transforms the iconic 1980s Turtle Trading System into a high-performance, multi-timeframe decision engine. It eliminates guesswork by providing institutional-grade analysis on trend structure, entry quality, and volatility all on a single chart. The Strategic Edge Turtles Professional uses a Smart Weighted Bias Engine to prioritize higher time frames, ensuring your trades align with the d
Hybrid Hull-LSMA : The Trend Meets Momentum Powerhouse Are you struggling with moving averages that are either too slow to react or too noisy to trust? The Hybrid Hull-LSMA is a solution, engineered to solve the "lag vs. noise" dilemma. By fusing the ultra-smooth Hull Moving Average (HMA) with the predictive Least Squares Moving Average (LSMA), this indicator delivers a high-definition view of market structure and entry timing. Why the Hybrid Hull-LSMA? Standard indicators follow the market; t
T3 MTF PureMaths : 멀티 타임프레임 Tillson T3 지표 대화형 대시보드가 탑재된 제로-래그(Zero-Lag) 컨플루언스 트레이딩 시스템 멀티 타임프레임 트레이딩의 우위 T3 MTF Pure Maths  는 월봉부터 5분봉까지 총 8가지 타임프레임 의 시장 구조를 동시에 집계하는 전문가급 트레이딩 대시보드입니다. 차트 전환이나 복잡한 계산 없이도 즉각적이고 실행 가능한 통찰력을 제공합니다. 순수 수학 최적화(인디케이터 핸들 미사용, CopyBuffer 호출 배제)로 구축된 이 지표는 표준 구현 방식보다 5~10배 빠른 성능 을 제공하며, 실전 매매와 고강도 전략 테스트(백테스팅) 모두에 최적화되어 있습니다. 이 지표는 어떤 질문에 답을 주나요? 트레이더의 질문 T3 MTF Pure의 답변 전체적인 추세 구조는 어떠한가? 색상으로 구분된 패널이 MN1-W1-D1-H4 정렬 상태를 한눈에 보여줍니다. 최적의 진입 시점은 어디인가? 진입 타임프레임(H1-M30-M15-
Divergent Fisher Transform MT5  Precision Momentum. Intelligent Filtering. EA-Ready Automation. The Divergent Fisher Transform for MT5 is a professional-grade momentum trading indicator designed to help traders answer the most important question in the market: “What should I do right now?” It transforms raw price into high-probability, structured trading decisions using a powerful combination of:  Fisher Transform momentum modeling  Zero-line structural filtering  Multi-level overbought/o
Divergent Stochastic Filter II Catch Reversals Early, Filter Noise, Trade with Confidence The Edge: Why This Stochastic is Different  Every trader knows the Stochastic oscillator. But knowing when to trust its signals, that's the real challenge. The Divergent Stochastic Filter II transforms this classic indicator into a precision reversal detection system by adding critical elements: divergence intelligence, signal filtering and exhaustion detection.  While standard Stochastic oscillators fire s
X-Hybrid Modular Z – 실행 지능 플랫폼 (Execution Intelligence Platform) 모든 인디케이터를 완전 자동 매매 시스템으로 전환하십시오 X-Hybrid Modular Z는 잘 설계된 모든 사용자 지정 인디케이터를 완전한 자동 트레이딩 시스템으로 변환하는 모듈형 실행 엔진입니다. 전문적인 수준의 체결 및 리스크 관리를 원하는 트레이더를 위해 설계되었으며, 코딩 없이도 신호 생성과 기관급 거래 관리 사이의 간극을 메워줍니다. 이 EA(Expert Advisor)의 차별점 기존의 EA와 달리, 이는 단순한 신호 판독기가 아닙니다. X-Hybrid Modular Z는 실행 프로세스를 고도로 인지하는 트레이딩 프레임워크로 다음과 같은 기능을 제공합니다: 적응형 슬리피지 제어 (ATR 및 스프레드 인지) 브로커 행동 프로파일링 (자기 학습형 실행 조정) 재시도 기반 실행 엔진 (Retry-based engine) 진입 간격 필터 및 시각적 갭 존 표시 (
Hybrid FATL-LRMA : Digital Precision Meets Statistical Certainty The Ultimate Trend-Momentum Convergence System with clear action protocols. Why Hybrid FATL-LRMA? The Edge some Traders Miss Are you tired of lagging indicators that signal entries after the move has already happened? Frustrated by noisy oscillators that keep you in chop while trends pass you by? The Hybrid FATL-LRMA is a dual-engine trading system that bridges the gap between high-frequency digital signal processing and stat
ADX ClrDynamic Slope-Aware, Low-Lag Trend & Momentum Engine Tired of lagging indicators that signal a trend only after the move is over? Traditional ADX calculations are often too slow for modern market volatility. ADX ClrDynamic bridges this gap by combining customizable low-lag smoothing algorithms (EMA, SMA, Wilder, or Hull Acceleration) with slope-aware momentum logic, giving you a lean, high-precision decision engine for timing trend entries and exits. Key Trading Questions Answered What is
ADX ClrDynamicPro Plus III Multi-Timeframe Trend, Momentum & Divergence Command Center Tired of lagging indicators that signal a trend only after the move is over? ADX ClrDynamicPro Plus III is a complete decision engine for trend, momentum, and reversal traders. By combining customizable smoothing algorithms (EMA, SMA, Wilder, or optional Hull Acceleration) with multi-timeframe (HTF) confirmation, institutional divergence detection, and an embedded subwindow dashboard, this tool delivers clear,
SERA - Sigma-Enhanced Regression Analysis – The Non-Repaint, Early-Entry MTF Trading System The Problem with Most Regression Tools (And How We Solved It) Traditional regression indicators lie to you. They repaint, they lag, and distort actionable data. Their flaws cost you in false back-tests, late entries/exits and therefore missed profits. Avoid catching a falling knife or chasing a train with SERA, she eliminates ALL three problems. One-Click Trading Style Selection – Choose Conservative, R
간소화된 3색 밴드 로직(Tri-Color Band Logic)은 스퀴즈(Squeeze) 감지 기능을 유지하면서 가격 움직임(Price Action)의 가독성을 최우선으로 합니다. 1. 철학의 전환: 당신의 방식대로 매매하세요 SignalMode 설정을 통해 인지케이터가 밴드 터치를 해석하는 방식을 선택할 수 있습니다. 이를 당신의 매매 성향이라고 생각하십시오. 가격이 ...에 닿을 때 돌파 모드 BREAKOUT (추세 트레이더) 반등 모드 BOUNCE (역추세 트레이더) 자동 모드 AUTO (하이브리드) 상단 밴드 매수 – "모멘텀 가속, 흐름에 올라타세요!" 매도 – "과매수 상태, 반전을 노리세요!" 가격에 따라 결정 – 돌파 마감 = 매수 / 안쪽 마감 = 매도 하단 밴드 매도 – "하락 모멘텀, 하락에 합류하세요!" 매수 – "과매도 반등이 임박했습니다!" 가격에 따라 결정 – 이탈 마감 = 매도 / 안쪽 마감 = 매수 SignalMode 파라미터는
필터:
리뷰 없음
리뷰 답변