VWAP Deviation Indicator

Indicateur d’écart VWAP (VWAP Deviation Indicator)

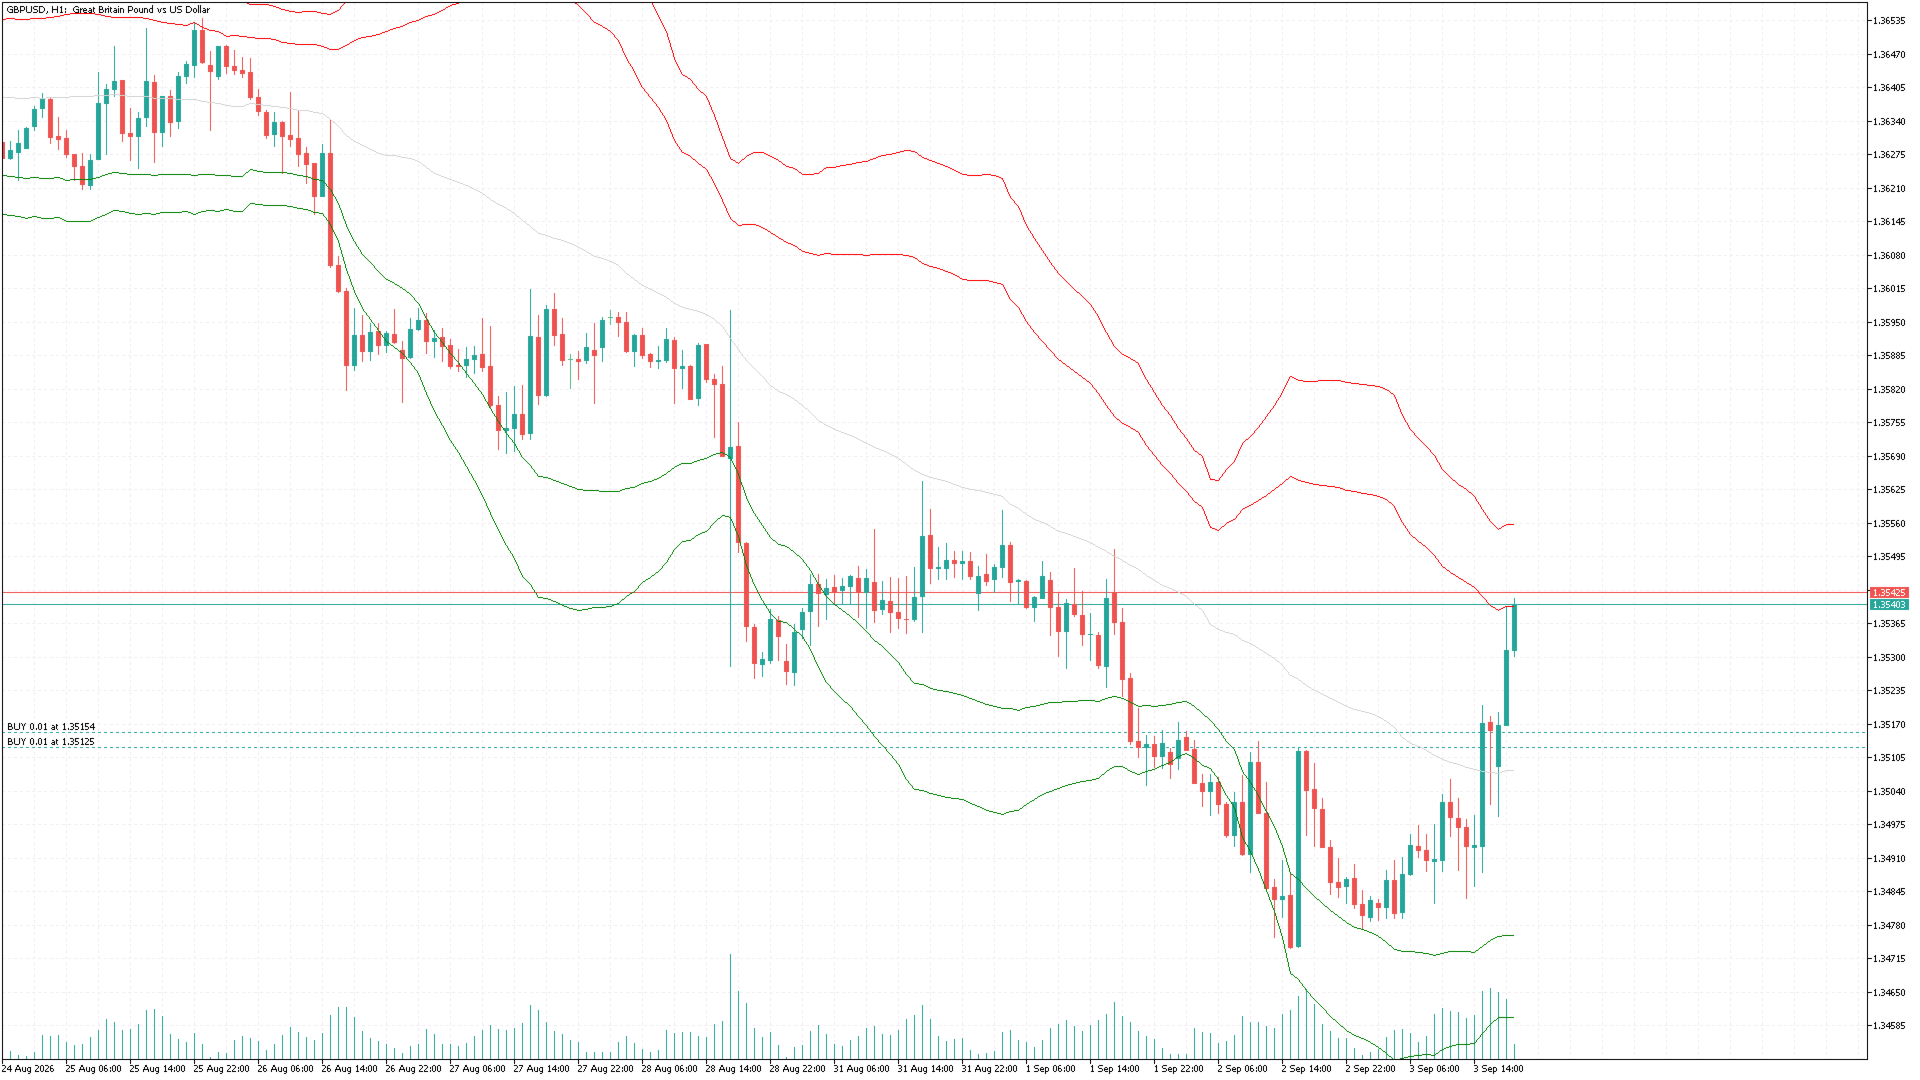
L’Indicateur d’écart VWAP est un outil d’analyse des prix basé sur le volume, conçu pour identifier la relation entre le prix actuel, une base VWAP calculée dynamiquement et ses niveaux d’écart.

Contrairement à une simple moyenne mobile, cet indicateur utilise une pondération basée sur le volume des ticks, permettant ainsi d’accorder davantage d’importance aux niveaux de prix associés à une activité de trading plus élevée dans le calcul du VWAP.

L’indicateur affiche une ligne centrale VWAP Basis, accompagnée de bandes d’écart de 2x et 3x, créant ainsi un cadre dynamique permettant d’analyser la position du prix, les extensions potentielles et les zones de retour vers la moyenne.

Principales fonctionnalités

VWAP pondéré par le volume

L’indicateur calcule un VWAP personnalisé en utilisant le volume des ticks sur la période de calcul sélectionnée.

Bandes d’écart dynamiques

Quatre niveaux d’écart sont affichés autour du VWAP :

  • Upper Dev 2 — VWAP + 2× écart

  • Upper Dev 3 — VWAP + 3× écart

  • Lower Dev 2 — VWAP − 2× écart

  • Lower Dev 3 — VWAP − 3× écart

Ces niveaux s’adaptent dynamiquement aux conditions actuelles du marché.

Deux méthodes de calcul de l’écart

Vous pouvez choisir entre deux méthodes :

Écart moyen (Average Deviation)

  • Utilise l’écart absolu moyen pondéré par le volume par rapport au VWAP.

  • Fournit une mesure robuste de la dispersion typique des prix.

Écart-type (Standard Deviation)

  • Utilise l’écart-type pondéré par le volume.

  • Particulièrement utile pour identifier les écarts de prix statistiquement importants par rapport au VWAP.

Calcul en espace logarithmique

Le mode optionnel Log-Space effectue les calculs du VWAP et des écarts dans l’espace logarithmique des prix, puis reconvertit les résultats en valeurs de prix normales.

Cette fonctionnalité peut être utile pour analyser des marchés présentant différentes échelles de prix ou lorsque les mouvements proportionnels des prix sont plus pertinents que les variations absolues.

Source VWAP configurable

La source de prix utilisée pour le calcul peut être sélectionnée parmi les types de prix standard disponibles dans MQL5, notamment :

  • Close — Prix de clôture

  • Open — Prix d’ouverture

  • High — Prix maximum

  • Low — Prix minimum

  • Median — Prix médian

  • Typical — Prix typique

  • Weighted — Prix pondéré

Période de calcul configurable

La période de calcul du VWAP est entièrement configurable.

Le réglage par défaut est de 60 bougies, mais vous pouvez choisir une période adaptée à votre style de trading et à votre unité de temps.

Comment l’utiliser

La VWAP Basis peut être utilisée comme un niveau de référence dynamique permettant de déterminer si le prix évolue au-dessus ou en dessous de sa moyenne pondérée par le volume.

Les bandes d’écart peuvent aider à identifier les zones dans lesquelles le prix s’est éloigné de manière significative du VWAP.

Par exemple :

Prix au-dessus du VWAP
→ Le marché évolue au-dessus de son prix de référence pondéré par le volume.

Prix en dessous du VWAP
→ Le marché évolue en dessous de son prix de référence pondéré par le volume.

Prix proche de ±2 écarts
→ Le prix s’est considérablement éloigné du VWAP.

Prix proche de ±3 écarts
→ Le prix présente un écart encore plus important par rapport à la référence VWAP.

Ces niveaux peuvent être utilisés comme informations complémentaires lors de l’analyse des tendances, des retracements, des cassures et des configurations potentielles de retour vers la moyenne.

Marchés adaptés

L’indicateur peut être utilisé sur :

  • Forex

  • Or et métaux précieux

  • Indices

  • Actions

  • Futures

  • CFDs

  • Cryptomonnaies

Il peut être appliqué à différentes unités de temps et également utilisé comme composant de stratégies de trading automatisées et d’Expert Advisors (EA).

Remarque importante

L’Indicateur d’écart VWAP est un outil d’analyse et ne fournit pas de signaux de trading garantis.

Les niveaux d’écart doivent être interprétés conjointement avec l’action des prix, la structure du marché, les conditions de tendance et les autres informations pertinentes du marché.

Paramètres

Log-space
Active ou désactive les calculs du VWAP et des écarts dans l’espace logarithmique.

Deviation Type
Permet de choisir entre Average Deviation et Standard Deviation.

Length
Nombre de bougies utilisées pour le calcul du VWAP et des écarts.

VWAP Source Price
Sélectionne la source de prix utilisée pour le calcul.

Une analyse VWAP simple, claire et puissante

Utilisez le VWAP comme référence dynamique du marché et les bandes d’écart pour comprendre dans quelle mesure le prix s’est éloigné de sa moyenne pondérée par le volume.

VWAP Basis • Écart 2× • Écart 3× • Écart moyen/Écart-type • Log-Space • Entièrement configurable


Produits recommandés
This product is designed for the MT5 platform and offers two key features: VWAP (Volume Weighted Average Price) calculation and Volume Profile analysis. Advantages: VWAP Calculation: The product calculates the VWAP, which is a popular indicator used by traders to determine the average price of a security based on its trading volume. It helps identify potential buying or selling opportunities by comparing the current price to the average price weighted by volume. Volume Profile Analysis: The prod
VWAP Indicator MT5
Kyra Nickaline Watson-gordon
Description : VWAP (Volume-Weighted Average Price) is the ratio of the value traded to total volume traded over a particular time horizon. It is a measure of the average price at which pair is traded over the trading horizon. Read More. All Symbols and All Timeframes are supported. Indicator Inputs :     VWAP Mode : Mode of VWAP Calculation. Options can be selected : Single,Session,Daily,Weekly,Monthly     Volumes : Real Volumes,Tick Volumes     Price Type : Used price for calculating. O
Stackable VWAP
Flavio Javier Jarabeck
3.5 (4)
Volume Weighted Average Price (VWAP) is a trading benchmark commonly used by Big Players that gives the average price a Symbol has traded throughout the day. It is based on both Volume and price. Additionally we put in this indicator the MVWAP (Moving Volume Weighted Average Price). For those who do not know the usage and the importance od this indicator I recommend a great article about this subject at Investopedia ( https://www.investopedia.com/articles/trading/11/trading-with-vwap-mvwap.asp
FREE
OrderFlux – Indicateur Order Flow et Footprint pour MetaTrader 5 OrderFlux est un indicateur professionnel de flux d'ordres (Order Flow) et de footprint pour MetaTrader 5. Il ouvre chaque bougie individuelle et révèle ce qui se passe à l'intérieur : le volume échangé à chaque niveau de prix, séparé en acheteurs et vendeurs agressifs. À partir de ces données de ticks, un graphique Footprint complet est construit en temps réel, incluant le Delta, les Imbalances, le Volume Profile et le Market Prof
MTF VWAP Indicator - Quick Overview   This indicator shows you where institutional money is flowing across multiple timeframes using Volume Weighted Average Price (VWAP) to identify high-probability trading zones. New version has VWAP bands plotting capability if user enabled and display panel (whose background changes colour on confluence) can be toggled on/off.      What It Actually Does:     1. Tracks Smart Money Levels: - Shows Daily, Weekly, and Monthly VWAP lines where big players (banks,
QuantMatrix Probability AI PRO QuantMatrix Probability AI PRO is a technical indicator for MetaTrader 5 designed to evaluate current market conditions and present them as BUY, SELL and NEUTRAL percentage estimates. The indicator combines several market measurements, including trend, momentum, volatility, price position, candlestick wick behavior and breakout conditions. It also compares the current market state with similar historical situations found in the selected symbol and timeframe. The hi
Angus Orderflow Heatmap
Mr Monthon Chaipreechapat
Volume Footprint & Heatmap Indicator This indicator combines Volume Footprint and Heatmap visualization, inspired by the Order Flow and Heatmap concepts found in Bookmap. Unlike futures markets, the Forex market does not provide real exchange-traded volume data. Instead, it only offers Tick Volume . This indicator is designed to simulate Bookmap-style market visualization as closely as possible using the available Tick Volume data. Because the indicator relies on Tick Volume, the quality and acc
The   Visual Volatility Clustering   indicator clusters the market based on volatility. The indicator does not redraw and gives accurate data, does not use closing prices. Uses the opening prices or the highs or lows of the previous completed bar. Therefore, all information will be clear and unambiguous. The essence of the indicator is to divide the price market into certain areas according to a similar type of volatility. This can be done in any way. In this example, the indicator is configure
Anchored VWAP with Alert MT5
Trade The Volume Waves Single Member P.C.
5 (1)
What is the Volume Weighted Average Price (VWAP)? The volume weighted average price (VWAP) is a trading benchmark used by traders that gives the average price an instrument has traded at throughout the day, based on both volume and price.  It is important because it provides traders with insight into both the trend and value of the instrument. What is the Difference between VWAP and AVWAP? While VWAP is having as starting point the beggining of the day,week,month etc. in the AVWAP you can pla
Breakout Boxes with Volume Pressure This indicator automates the identification of key consolidation zones (Supply and Demand) based on Market Pivots and Volatility (ATR). Unlike standard support/resistance tools, this indicator provides a unique   Volume Pressure Analysis   inside every box, giving you insight into the battle between Buyers and Sellers before a breakout occurs. Key Features Automated Supply & Demand Zones:   Automatically detects significant Pivot Highs and Lows to draw dyna
Midas VWAP
Paulo Henrique Faquineli Garcia
4 (2)
Volume Weighted Average Price (VWAP) is a trading benchmark commonly used by Big Players that gives the average price a Symbol has traded throughout the day. It is based on both Volume and price. This indicator contains Daily VWAP and MIDAS' VWAP, which means you are able to anchor the beggining of MIDAS' calculations and, therefore you will be able to use this methodology to study price versus volume moves after anchor point. You will be able to anchor up to 3 HIGH MIDAS VWAP's and 3 LOW. Wish
FREE
The  OBV MTF  is an Enterprise-grade On-Balance Volume indicator that transforms standard OBV into a complete trading system. It combines gradient-aware momentum analysis, divergence detection, multi-timeframe alignment, and dynamic customisable midpoint-filtering in a single intuitive professional volume analysis tool. Core Features 1. 5-State Momentum Engine Aqua (Strong Bullish) : OBV slope rising with positive acceleration SteelBlue (Weak Bullish) : OBV rising but losing momentum Gray (Neutr
RAD CRITICAL LEVES RAD indicator tracks “Relevant Volume” in real time, identifying accumulation and distribution processes, projecting them in the chart as SUPPORT or RESISTANCE zones. Natural   support   and resistance levels are generated by Volume Accumulation and Distribution processes. As these processes evolve, levels at which the relevant volume in the market place is positioned, become difficult areas to cross upwards or downwards. By using this information, traders can identify very s
Market Structure Evaluator MTF Market Structure Evaluator MTF is an institutional-grade price action indicator designed for Smart Money Concepts (SMC) and Market Structure traders. It automatically tracks Market Structure Breaks ( BOS ) and Change of Character ( CHOCH ) in real-time across multiple timeframes, giving you a complete macro-to-micro view of market trend alignment without cluttering your charts or having to analyse other timeframes. Whether you trade manually or build automated tr
Adjustable Consecutive Fractals  looks for 2 or more fractals in one direction and sends out a on screen alert, sound alert and push notification, for strong reversal points . Adjustable Consecutive Fractals, shows the fractals on chart along with a color changing text for buy and sell signals when one or more fractals appear on one side of price. Adjustable Consecutive Fractals is based Bill Williams Fractals . The standard Bill Williams fractals are set at a non adjustable 5 bars, BUT withe th
VWAP and MVWAP
Flavio Javier Jarabeck
4 (9)
Volume Weighted Average Price (VWAP) is a trading benchmark commonly used by Big Players that gives the average price a Symbol has traded throughout the day. It is based on both Volume and price. Additionally we put in this indicator the MVWAP (Moving Volume Weighted Average Price). For those who do not know the usage and the importance od this indicator I recommend a great article about this subject at Investopedia ( https://www.investopedia.com/articles/trading/11/trading-with-vwap-mvwap.asp )
FREE
The most important price level in any "Volume profile" is the "Point of Control" . This is the price level with the highest trading volume. It is primarily the level where large players initiate their positions, making it the accumulation/distribution level for the "Smart money" . The idea of the indicator arose after the "MR Volume Profile 5" indicator was made. When creating the "MR Volume Profile 5" indicator, we spent a lot of time comparing the volumes with those from the volume profile in
La Master Edition est un outil d'analyse de qualité professionnelle conçu pour visualiser la structure du marché à travers le prisme du volume et du flux monétaire. Contrairement aux indicateurs de volume standard, cet outil affiche un Profil de Volume Quotidien directement sur votre graphique, vous permettant de voir exactement où la découverte des prix a eu lieu et où est positionné "l'argent intelligent". Cette Master Edition est conçue pour la clarté et la rapidité, dotée d'un système unique
Meravith MT5
Ivan Stefanov
5 (3)
Outil des market makers. Meravith va : Analyser toutes les unités de temps et afficher la tendance actuellement en vigueur. Mettre en évidence les zones de liquidité (équilibre des volumes) où le volume haussier et baissier est égal. Afficher tous les niveaux de liquidité provenant de différentes unités de temps directement sur votre graphique. Générer et présenter une analyse de marché sous forme de texte pour votre référence. Calculer les objectifs, les niveaux de support et les points de stop
Liquidity HeatMap Profile
Israr Hussain Shah
5 (1)
Here   our more valuable tools SMC Trend Trading   ,  Easy SMC Trading  ,  Institutional SMC Architect Volume Analysis Tools  ,  Volume flow Profile  ,  Market volume profile  , FVG with Volume  , Liquidity Heatmap Profile  ,  Volume Spread Analysis 2. Key Features Dynamic Filtering : The core feature. As soon as the current price crosses a historical liquidity level, that level disappears. This reduces chart clutter and prevents you from trading off "dead" support/resistance. Liquidity Heatma
Cet indicateur est basé sur la transformée de Hartley discrète. L'utilisation de cette transformation vous permet d'appliquer différentes approches lors du traitement des séries chronologiques financières. Une caractéristique distinctive de cet indicateur est que ses lectures ne se réfèrent pas à un point sur le graphique, mais à tous les points de la période de l'indicateur. Lors du traitement d'une série temporelle, l'indicateur permet de sélectionner différents éléments de la série temporell
Automatic Vwap Midas
Ricardo Almeida Branco
5 (1)
The 3 Automatic Vwap (Midas) Indicator can be used for Price and Volume studyers to map the movement of market drivers. It automatically plots 3 Vwaps, two of which are dynamic and will be updated throughout the day if new highs or new lows emerge. The third Vwap is daily and can help if the trend is up or down. Also, an auxiliary indicator that plots (also dynamic) points of interest with OHLC prices (Open, High and Low of the current day and Close of the previous day) was inserted. Success and
MIDAS Super VWAP
Flavio Javier Jarabeck
4.27 (11)
Imagine VWAP, MVWAP and MIDAS in one place... Well, you found it! Now you can track the movement of Big Players in various ways, as they in general pursue the benchmarks related to this measuring, gauging if they had good execution or poor execution on their orders. Traders and analysts use the VWAP to eliminate the noise that occurs throughout the day, so they can measure what prices buyers and sellers are really trading. VWAP gives traders insight into how a stock trades for that day and deter
FREE
After Purchase Inbox TO get your Trader Kit with this tool YouTube Demo B&C Blue Guardian is a professional-grade precision indicator built for Boom & Crash indices, Deriv synthetics, . It combines multi-oscillator confluence  to pinpoint high-probability spike and reversal zones with zero chart lag.   Strict Direction Engine: Automatically enforces BUY-onl
Market Profile Osw MT5
William Oswaldo Mayorga Urduy
Manuel d'utilisation : Market Profile Osw Le Market Profile Osw est un outil d'analyse d'enchères avancé qui permet de visualiser la distribution du volume et du prix sur une période donnée. Contrairement aux graphiques en bougies conventionnels, ce système révèle où l'activité commerciale a été la plus forte, permettant d'identifier des zones de support et de résistance psychologiques basées sur la participation réelle du marché. 1. Guide des paramètres (Menu des entrées) Configuration généra
Wave Box Market Frenquency
Jean Jacques Huve Ribeiro
4.75 (4)
Totally linked to the result of a movement and the duration he had. Its height records how many ticks the asset walked during a given movement, its width shows us the duration that movement had. Its configuration must be in line with the Weis Wave Indicator configuration to observe the movement force and can indicate a possible accumulation or distribution of the movement;
FREE
BoxProfile MT5
Evgeny Shevtsov
4.6 (10)
The indicator displays volume profiles based on the nesting principle. Profiles periods are pre-set so that each subsequent profile has a length twice as long as the length of the previous profile. In addition to profiles, the indicator displays volume clusters sorted by color, depending on the volume they contain. Indicator operation features The indicator works on typical timeframes from M5 to MN, but for calculations uses historical data from smaller timeframes: M1 - for timeframes from M5
FREE
Wick Exhaustion Tracker
Roberto Abreu De Lucena
On-Screen Backtest : Shows the real Win/Loss results and win rate directly on your chart ( 62.5% accurate under real tests). Ultra Lightweight : Specially optimized to run perfectly on computers with low RAM (like 4GB) or remote VPS servers without freezing your platform. Complete Dashboard : Includes a live candle countdown timer, trend detector, and a daily candle counter on the right side of your screen. Visual Aids : Tracks daily maximum and minimum lines automatically on your chart. Input
Epic Sails PRO is a clean, session-anchored VWAP indicator designed to provide a clear institutional price framework — not trade signals. It plots a stable VWAP with non-overlapping volatility bands and a real-time VWAP angle (in degrees) to help traders assess directional bias, slope strength, and market state. This tool is ideal for traders who prefer structure, context, and mechanical confirmation over subjective indicators. Key Features Session-anchored VWAP (resets at user-defined session s
N/B: All our product purchase comes with our free ‘’DAILY   SCALPER EA’’ -   bit.ly/4qlFLNh Whatsapp Developer for yours after successful purchase Eternal Spike Detector Pro - M5 Mastery System   HOW TO TRADE THIS SYSTEM   TRADING RULES For CRASH 500/900/1000: SELL SETUP: · Wait for RED DOWN ARROW to appear · Enter SELL at the close of the M5 candle where arrow appears · Stop Loss: 1.5x ATR above the entry high · Take Profit: 2-3x ATR below entry · Only trade maximum 7 signals per day
Les acheteurs de ce produit ont également acheté
Neuro Poseidon MT5
Daria Rezueva
4.85 (54)
Neuro Poseidon is a new indicator by Daria Rezueva. It combines precise trading signals with adaptive TP/SL levels - creating best possible trades as a result! Message me and get  Neuro Poseidon Assistant  as a gift to automize your trading process! What makes it stand out? 1. Proven profitability on all assets and timeframes 2. Only confirmed BUY and SELL signals present on the chart 3. Adaptive TP & SL levels generated by the software for each trade 4. Easy to understand - suitable for al
Azimuth Pro
Ottaviano De Cicco
5 (7)
Azimuth Pro V2: Synthetic Fractal Structure and Confirmed Entries for MT5 Overview Azimuth Pro is a multi-level swing structure indicator by Merkava Labs . Four nested swing layers, swing-anchored VWAP, ABC pattern detection, three-timeframe structural filtering, and closed-bar confirmed entries — one chart, one workflow from micro-swings to macro-cycles. This is not a blind signal product. It is a structure-first workflow for traders who care about location, context, and timing. ️ Summer Sale
L'indicateur UZFX {SSS} Scalping Smart Signals v5.0 MT5 est un indicateur de trading haute performance sans « repaint », conçu pour les scalpers, les day traders et les swing traders qui recherchent des signaux précis et en temps réel sur des marchés très volatils. Développé par (UZFX-LABS), cet indicateur combine l'analyse de l'action des cours, la confirmation des tendances et un filtrage intelligent pour générer des signaux d'achat et de vente à forte probabilité, des signaux d'alerte et des
TrendMaestro5
Stefano Frisetti
note: this indicator is for METATRADER4, if you want the version for METATRADER5 this is the link:  https://www.mql5.com/it/market/product/108106 TRENDMAESTRO ver 2.5 TRENDMAESTRO recognizes a new TREND from the start, he never makes mistakes. The certainty of identifying a new TREND is priceless. DESCRIPTION TRENDMAESTRO identifies a new TREND in the bud, this indicator examines the volatility, volumes and momentum to identify the moment in which there is an explosion of one or more of these da
Boom & Crash & PainX & GainX Ultimate Spike Detector Trade Spikes With Confidence — Not Guesswork Catching spikes should be one of the most profitable strategies in synthetic markets. But for most traders, it becomes one of the most frustrating. You enter too early… price goes against you. You wait for a spike… it never comes. You finally catch one… but don’t know whether to hold or close. You make profit… then give it all back because there’s no exit plan. This is exactly the problem the Ultim
Gem SIGNAL
Shengzu Zhong
5 (1)
GEM Signal Pro GEM Signal Pro est un indicateur de suivi de tendance pour MetaTrader 5, conçu pour les traders qui souhaitent des signaux plus clairs, des configurations de trade plus structurées et une gestion du risque plus pratique directement sur le graphique. Au lieu d’afficher simplement une flèche, GEM Signal Pro aide à présenter l’idée complète du trade de manière plus claire et plus lisible. Lorsque les conditions sont confirmées, l’indicateur peut afficher le prix d’entrée, le stop los
PrimeScalping
Temirlan Kdyrkhan
PrimeScalping is a powerful trading companion designed to generate high-probability entry signals with dynamic TP/SL/DP levels based on volatility. Built-in performance tracking shows win/loss stats, PP1/PP2 hits, and success rates — all updated live. Key Features: Buy/Sell signals with adaptive volatility bands Real-time TP/SL/DP levels based on ATR Built-in MA Filter with optional ATR/StdDev volatility Performance stats panel (Success, Profit/Loss, PP1/PP2) Alerts via popup, sound, push, or e
FX-AIEA Smart Supply and Demand Zone Identification Indicator (Supply and Demand Indicators MT5) Version: 2.51 | Compatible Platform: MetaTrader 5   Why do trades need supply and demand zones? Supply and demand zones are the core manifestation of institutional order flow, reflecting real buying and selling power more accurately than traditional support and resistance. However, manual drawing is not only time-consuming but also highly subjective and prone to missing key areas. FX-AIEA Supply-De
SmartScalping
Temirlan Kdyrkhan
SmartScalping is a powerful trading companion designed to generate high-probability entry signals with dynamic TP/SL/DP levels based on volatility. Built-in performance tracking shows win/loss stats, PP1/PP2 hits, and success rates — all updated live. Key Features: Buy/Sell signals with adaptive volatility bands Real-time TP/SL/DP levels based on ATR Built-in MA Filter with optional ATR/StdDev volatility Performance stats panel (Success, Profit/Loss, PP1/PP2) Alerts via popup, sound, push, or e
ScalpPoint
Temirlan Kdyrkhan
ScalpPoint is a powerful trading companion designed to generate high-probability entry signals with dynamic TP/SL/DP levels based on volatility. Built-in performance tracking shows win/loss stats, PP1/PP2 hits, and success rates — all updated live. Key Features: Buy/Sell signals with adaptive volatility bands Real-time TP/SL/DP levels based on ATR Built-in MA Filter with optional ATR/StdDev volatility Performance stats panel (Success, Profit/Loss, PP1/PP2) Alerts via popup, sound, push, or emai
TrendProMaster
Temirlan Kdyrkhan
MasterTrend Indicator for MT5 A powerful trend-following and signal-evaluation tool MasterTrend   is a custom MT5 indicator that combines Moving Averages and ATR-based risk/reward logic to generate clear buy/sell signals. It visualizes dynamic SL/TP levels, evaluates past trade outcomes, and displays win/loss statistics in a clean on-chart panel. Key features include: Buy/Sell signals based on MA crossovers ATR-based SL/TP1/TP2/TP3 levels with visual lines and labels Signal outcome tracking wit
L’indicateur met en évidence les zones où un intérêt est déclaré sur le marché , puis montre la zone d’accumulation des ordres . Il fonctionne comme un carnet d’ordres à grande échelle . C’est l’indicateur destiné aux grands capitaux . Ses performances sont exceptionnelles. Quel que soit l’intérêt présent sur le marché, vous le verrez clairement . (Il s’agit d’une version entièrement réécrite et automatisée – l’analyse manuelle n’est plus nécessaire.) La vitesse de transaction est un indicateur
KT Alpha Hunter Arrows MT5
KEENBASE SOFTWARE SOLUTIONS
La plupart des indicateurs à flèches vous donnent un signal, puis vous laissent gérer tout le reste seul. KT Alpha Hunter Arrows vous fournit un plan de trading complet. Chaque flèche de signal apparaît avec un plan complet déjà tracé : ligne d’entrée, stop loss, quatre niveaux de take profit et un verdict d’edge en temps réel qui vous indique si ce symbole et cette unité de temps valent la peine d’être tradés maintenant. Le Trade Manager EA inclus prend en charge l’exécution après votre entrée,
RelicusRoad Pro MT5
Relicus LLC
4.96 (24)
RelicusRoad Pro : Système d'Exploitation Quantitatif du Marché 70% DE RÉDUCTION ACCÈS À VIE (DURÉE LIMITÉE) - REJOIGNEZ 2 000+ TRADERS Pourquoi la plupart des traders échouent-ils même avec des indicateurs "parfaits" ? Parce qu'ils tradent des concepts isolés dans le vide. Un signal sans contexte est un pari. Pour gagner, il faut de la CONFLUENCE . RelicusRoad Pro est un Écosystème Quantitatif complet . Il cartographie la "Fair Value Road", distinguant le bruit des cassures structurelles. Arrête
Indicateur MT5 Voyez ce que le marché fait vraiment.   Visualisez les 3 phases de marché en direct devant vous (Contraction, Expansion, Tendance) et prenez de meilleures entrées dès le   début de la phase de Tendance.      Arrêtez de deviner. Commencez à lire le marché comme le font les institutions et le smart money.   Apex Market Structure Pro pour MT5 est un outil d'analyse smart-money de précision qui élimine le bruit et vous révèle la   véritable structure sous chaque bougie : liquidité
Historical Similarity Matcher Indicator (HI.SI.MA) Try it free today — demo version now available!   https://www.mql5.com/en/market/product/167114 Overview The Historical Similarity Matcher is a technical analysis indicator for MetaTrader 5. It scans historical price data to find segments that show statistical similarity to a user-selected reference period on the chart.
AriX
Temirlan Kdyrkhan
1 (4)
AriX Indicator for MT5 A powerful trend-following and signal-evaluation tool AriX is a custom MT5 indicator that combines Moving Averages and ATR-based risk/reward logic to generate clear buy/sell signals. It visualizes dynamic SL/TP levels, evaluates past trade outcomes, and displays win/loss statistics in a clean on-chart panel. Key features include: Buy/Sell signals based on MA crossovers ATR-based SL/TP1/TP2/TP3 levels with visual lines and labels Signal outcome tracking with real-time stat
Gold Uptrend Insider
Lawrence Chiiambb Mkandawi
5 (1)
Uptrend Insider A clean and powerful trend-following indicator that helps you catch the beginning of uptrends and exit before the market turns into a range or downtrend. How it works:   Green → Uptrend signal (potential buying opportunity) Orange → Ranging / sideways market possibility but maintain the trend positions just keep an eye for possible ranges and reversals. Red → Downtrend or exit signal (time to close long positions) The indicator is designed to be extremely simple and visual. You o
OrderFlow Absorption – Indicateur professionnel de delta et de signaux d’absorption pour MT5 Libérez la puissance de l’analyse réelle du flux d’ordres avec OrderFlow Absorption – l’indicateur ultime d’histogramme delta et de signaux d’absorption pour MetaTrader 5. Conçu pour les traders qui veulent comprendre ce qui se passe réellement derrière chaque mouvement de prix, cet outil révèle la pression d’achat/vente cachée et les événements d’absorption qui font bouger le marché. Fonctionnalités Vis
Bonjour à tous les traders ! De nombreux investisseurs individuels utilisent des scripts web lents. Une approche systématique est essentielle pour un trading rentable. L'indicateur Astro AI n'est pas un simple affichage sur un graphique. Il s'agit d'un réseau neuronal sophistiqué composé de deux agents fonctionnant directement dans le terminal. Détails techniques du système : 1. Agent 1 : Analyste (Réseau neuronal graphique – GNN) Le marché n'est pas constitué de barres de prix individuelle
VTrende Pro
Andrii Diachenko
5 (1)
VTrende Pro - MTF indicator for trend trading with a display panel for MT5 *** Videos can be translated into any language using subtitles (video language - Russian) Although the signals of the VTrende Pro indicator can be used as signals of a full-fledged trading system, it is recommended to use them in conjunction with the Bill Williams TS. VTrende Pro is an extended version of the VTrende indicator. Difference between Pro version and VTrende: - Time zones - Signal V - signal 1-2 waves -    S
Flag Pattern Angelo
Brighton Mufaro Mudzingwa
Brandon Angelo Flag Pattern — how it works This indicator automatically detects classic bull and bear flag chart patterns in real time. The detection happens in three stages for each bar. First it looks for a flagpole — a sharp, strong directional move over a configurable number of bars ( FlagpoleBars , default 5) that must exceed a minimum percentage size ( FlagpoleMinPct ). For a bullish flag the pole must close net higher than it opened; for a bearish flag, net lower. Second it identifies th

This indicator automatically detects internal & swing market structure, Fibonacci Retracement and Fibo Levels. Features Full internal & swing market structure labeling in real-time Fibonacci Retracement Fibonacci Levels After purchasing the indicator, the full source code is provided, and via indicator buffers it can be easily integrated into your Expert Advisors (EAs) for automated trading strategies.
Naked Forex Tweezer Pro Indicator Tweezer Pro Indicator is a pattern recognition indicator for Forex, Stocks, Indices, Futures, Commodities and Cryptos. The standard Tweezer is a two bar pattern. Our enhanced version is a multi-bar pattern. We filter the patterns for you so that you only get the     best and most effective patterns   and ignore the noise. The Tweezer pattern is a simple and effective pattern to trade. The strategy that comes with the Tweezer is based on price action. The Twe
Chimera Volume
Marko Milenkovic
Chimera Volume pour MetaTrader 5 Analyse avancée du volume et visualisation de l'activité du marché Chimera Volume est un indicateur personnalisé pour MetaTrader 5, conçu pour analyser l'activité des volumes normalisés et afficher les changements dans la participation au marché via un cadre visuel dynamique. L'indicateur traite les données de volume de ticks en utilisant des algorithmes de normalisation adaptative et génère une représentation structurée de l'intensité du volume, des phases d'acc
CGE Trading Suite
Carl Gustav Johan Ekstrom
5 (2)
Institutional-Grade Analytics for MT5 The full analytical edge of a professional trading desk, built into your MT5 chart. CGE Trading Suite is an indicator system of 21 integrated modules covering market structure, timing, momentum, volume, capital flow and regime change, combined into a single chart-based workspace. Why CGE Trading Suite? The suite empowers traders with structure, confidence, and consistent performance across all markets and time frames. Hover over any signal or tool on the c
Meravith Scanner
Ivan Stefanov
5 (3)
MERAVITH SCANNER est un indicateur professionnel pour les marchés financiers sur MetaTrader 5, qui regroupe plusieurs outils d’analyse en un seul système intégré. Il effectue tous les calculs automatiquement en utilisant une méthodologie propriétaire de prix moyen pondéré par le volume (VWAP), éliminant ainsi toute interprétation subjective. Cet indicateur fonctionne sur toutes les classes d’actifs (Forex, actions, indices, matières premières, cryptomonnaies) et sur toutes les périodes, de M1 au
Big Player Range
Thalles Nascimento De Carvalho
5 (3)
BigPlayerRange – Meilleur indicateur pour MT5 BigPlayerRange est considéré comme le meilleur indicateur pour le Mini Indice et le Mini Dollar sur MetaTrader 5. Cet outil met en évidence les zones stratégiques d’action des gros acteurs du marché, offrant une analyse technique institutionnelle d’une grande précision. Comment utiliser BigPlayerRange : Cet indicateur trace des zones d’achat (ligne verte) et de vente (ligne rouge). Lorsque le prix clôture en dehors de ces zones, une tendance
Route Lines Prices MT5 - est un indicateur conçu pour identifier les signaux de trading potentiels. Son interface simple intègre plusieurs algorithmes d'analyse du comportement des prix, ainsi que la détection des points d'arrivée des signaux et le calcul des trajectoires complètes. Les algorithmes incluent des calculs de volatilité et de lissage des prix basés sur les unités de temps utilisées. L'indicateur possède un paramètre principal permettant de modifier ses valeurs : « Calculating price
Plus de l'auteur
Cross Over Trend – Indicateur de Croisement EMA/SMA Cross Over Trend est un indicateur technique simple et efficace pour MetaTrader 5 qui visualise la relation entre une Moyenne Mobile Exponentielle (EMA) et une Moyenne Mobile Simple (SMA) . L'indicateur facilite l'identification de la direction actuelle de la tendance en divisant automatiquement les phases du marché en tendance haussière (UpTrend) et tendance baissière (DownTrend) , selon la relation entre l'EMA et la SMA. Fonctionnement L'indi
QQE Signal – Indicateur d’Estimation Quantitative Qualitative (QQE) QQE Signal est un indicateur technique basé sur un oscillateur pour MetaTrader 5, conçu pour aider à identifier les changements potentiels de tendance et les variations du momentum du marché à l’aide d’un RSI lissé et d’une ligne QQE calculée dynamiquement. L’indicateur affiche clairement la relation entre la ligne de signal bleue basée sur le RSI et la ligne QQE lissée noire en pointillés , tout en utilisant le niveau 50 comme
Filtrer:
Aucun avis
Répondre à l'avis