Harmonic Pattern Auto Scanner All Pair Timeframe

HARMONIC DASHBOARD — Multi-Symbol & Multi-Timeframe Harmonic Pattern Scanner

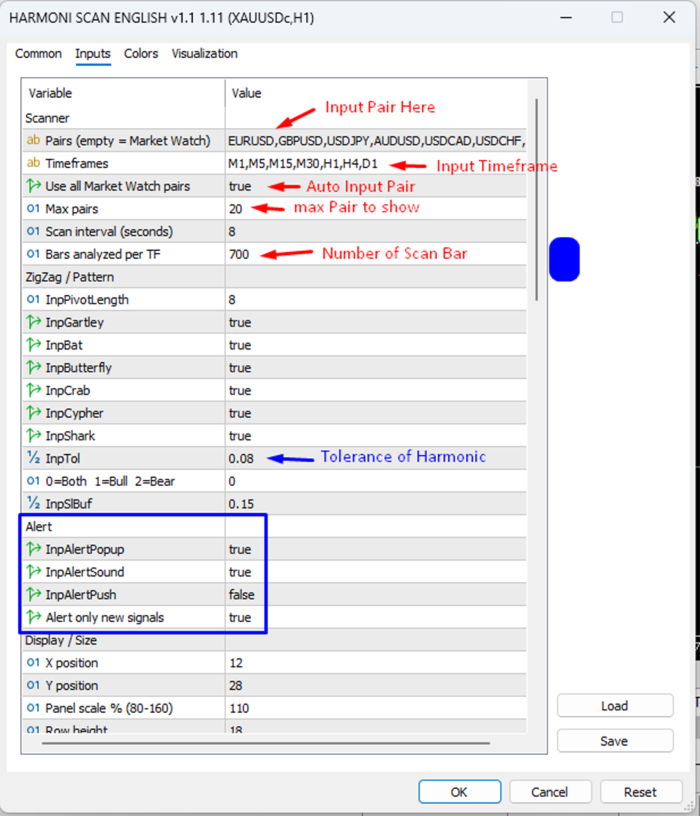
Automatically Scan Multiple Symbols and Timeframes for Harmonic Patterns

HARMONIC DASHBOARD is a MetaTrader 5 indicator designed to help traders monitor multiple currency pairs and timeframes from a single chart.

Instead of manually checking each chart for potential harmonic formations, the indicator continuously scans the selected symbols and timeframes and displays detected harmonic patterns in a structured dashboard.

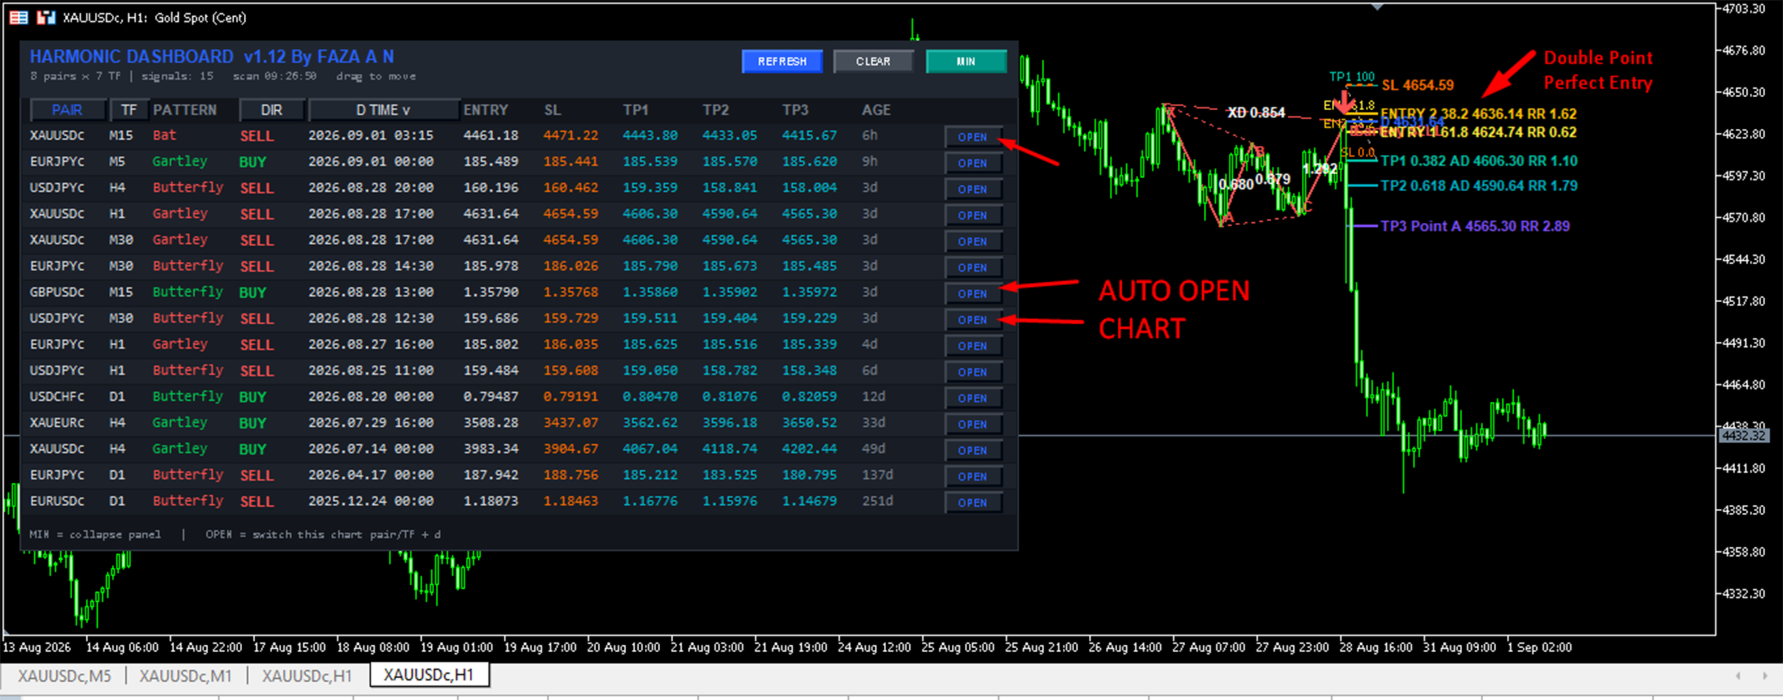
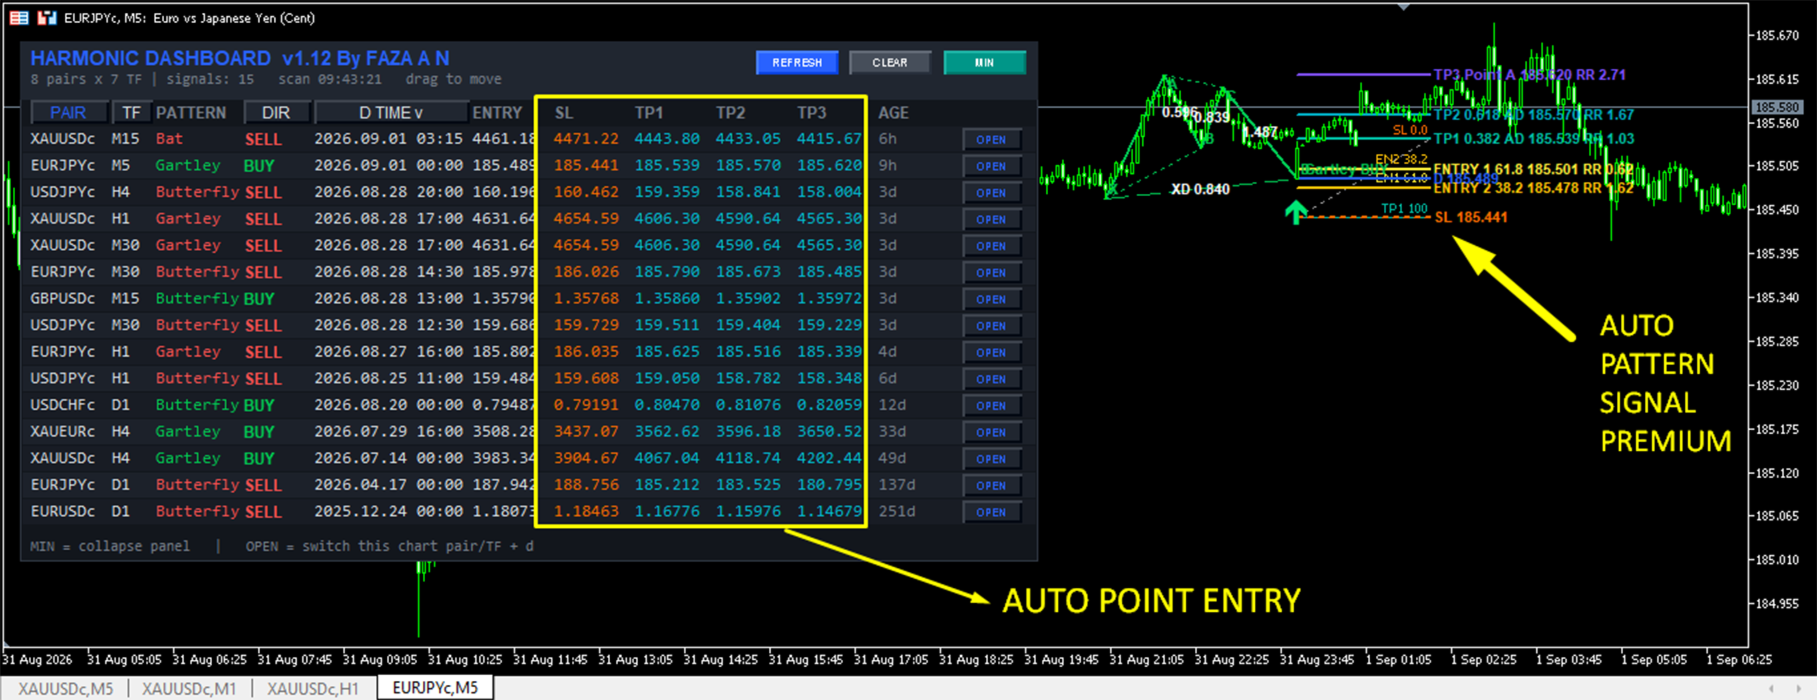
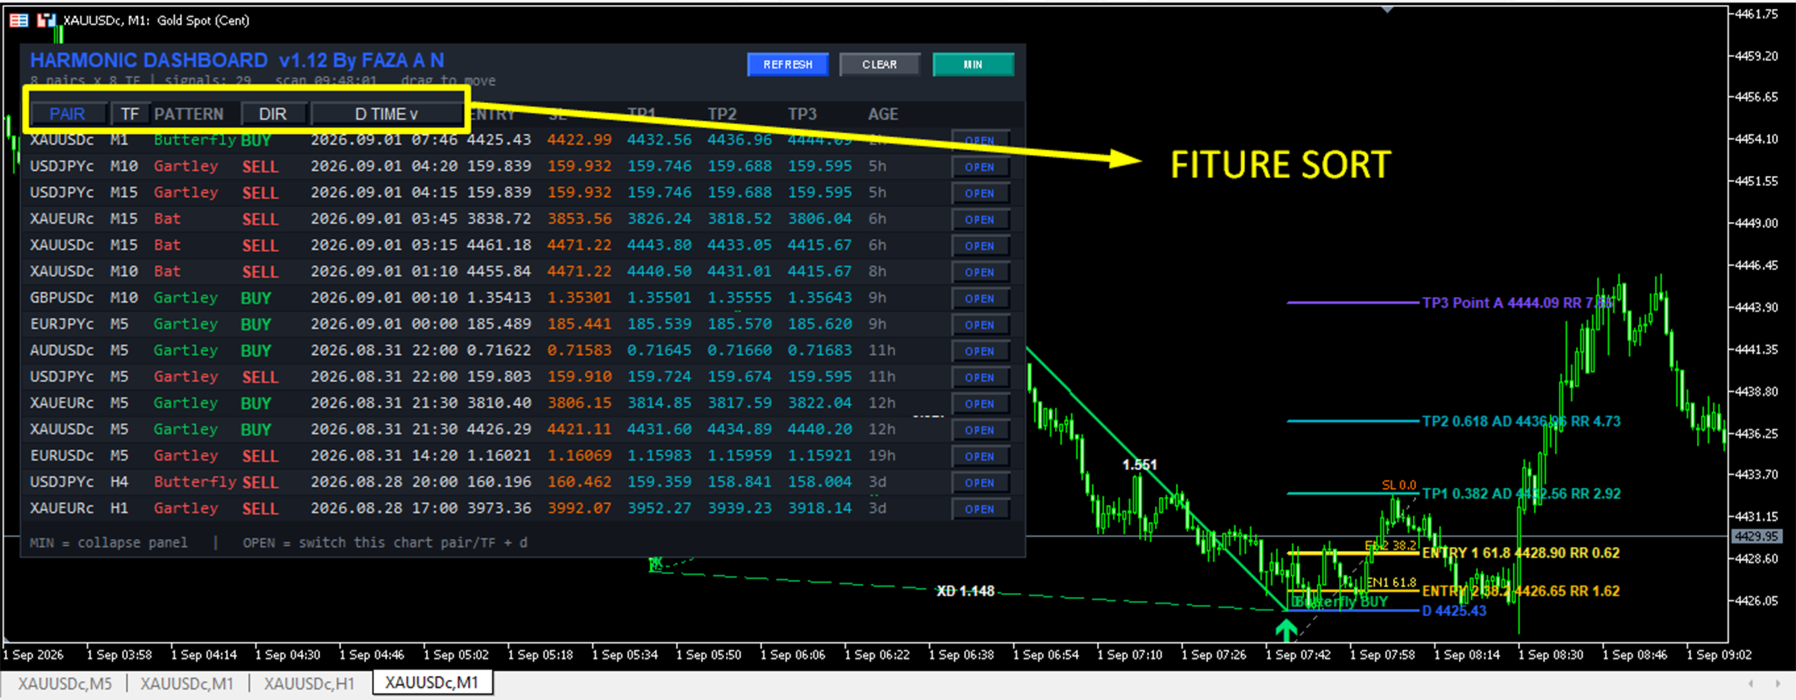
The dashboard provides the detected pattern, direction, detection time, Entry level, Stop Loss, and multiple Take Profit levels, allowing traders to quickly identify potential harmonic setups without switching between dozens of charts.

KEY FEATURES

🔎 Multi-Symbol Scanner

Scan multiple instruments from one dashboard.

You can either:

  • Use symbols available in the Market Watch

  • Define your own list of symbols

  • Set the maximum number of symbols to scan

Example:

EURUSD
GBPUSD
USDJPY
AUDUSD
USDCAD
USDCHF
NZDUSD
EURJPY
GBPJPY
XAUUSD

The symbol list is fully configurable.

⏱ Multi-Timeframe Scanner

Monitor multiple timeframes simultaneously.

Supported timeframes include:

  • M1

  • M2

  • M3

  • M4

  • M5

  • M6

  • M10

  • M12

  • M15

  • M20

  • M30

  • H1

  • H2

  • H3

  • H4

  • H6

  • H8

  • H12

  • D1

  • W1

  • MN1

You can choose the timeframes that you want to monitor.

This allows you to monitor short-term and higher-timeframe harmonic formations from a single dashboard.

SUPPORTED HARMONIC PATTERNS

The scanner can identify several well-known harmonic formations:

Gartley

The classic Gartley harmonic structure based on Fibonacci relationships between the X, A, B, C and D points.

Bat

A Bat pattern configuration using its corresponding Fibonacci retracement and extension relationships.

Butterfly

An extended harmonic structure with the D point extending beyond X.

Crab

A high-extension harmonic formation with a deep potential reversal zone.

Cypher

A harmonic formation identified using its specific Fibonacci relationships.

Shark

An advanced harmonic formation based on its characteristic Fibonacci structure.

Each pattern can be enabled or disabled independently.

BULLISH & BEARISH DETECTION

The scanner identifies both bullish and bearish harmonic formations.

The dashboard clearly displays the detected direction:

BUY

or

SELL

This makes it easier to distinguish potential bullish and bearish setups when monitoring many markets simultaneously.

COMPLETE TRADE LEVEL INFORMATION

When a harmonic pattern is detected, the dashboard can display:

  • Pattern

  • Direction

  • Detection time

  • Entry

  • Stop Loss

  • TP1

  • TP2

  • TP3

  • Pattern age

This gives traders a structured view of the detected setup rather than requiring them to manually calculate the important levels.

MULTIPLE TAKE-PROFIT LEVELS

The indicator provides three potential target levels:

TP1

Initial target based on the AD leg.

TP2

Second target based on a deeper Fibonacci projection.

TP3

Extended target toward Point A.

The dashboard also displays the calculated risk/reward information associated with the setup.

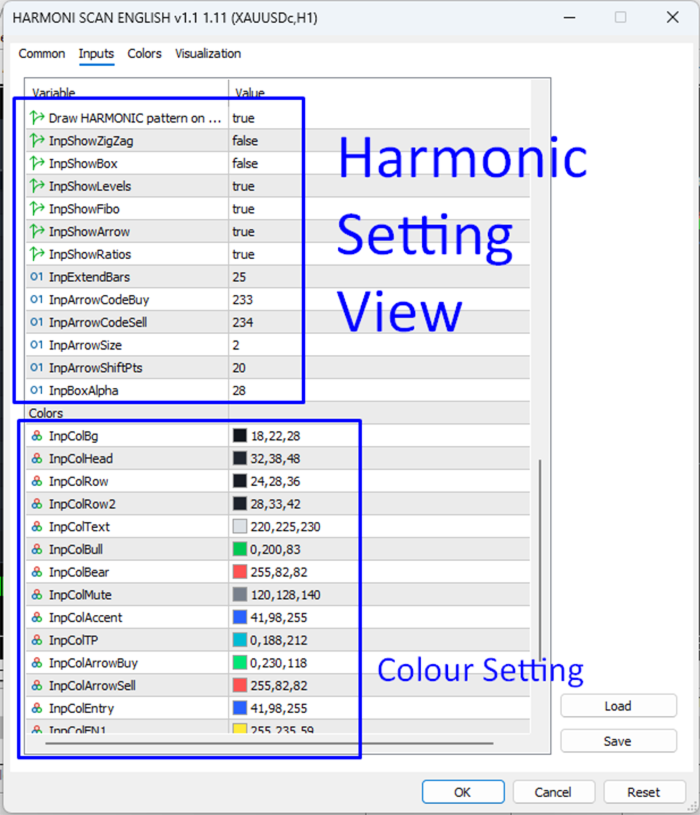
HARMONIC PATTERN VISUALIZATION

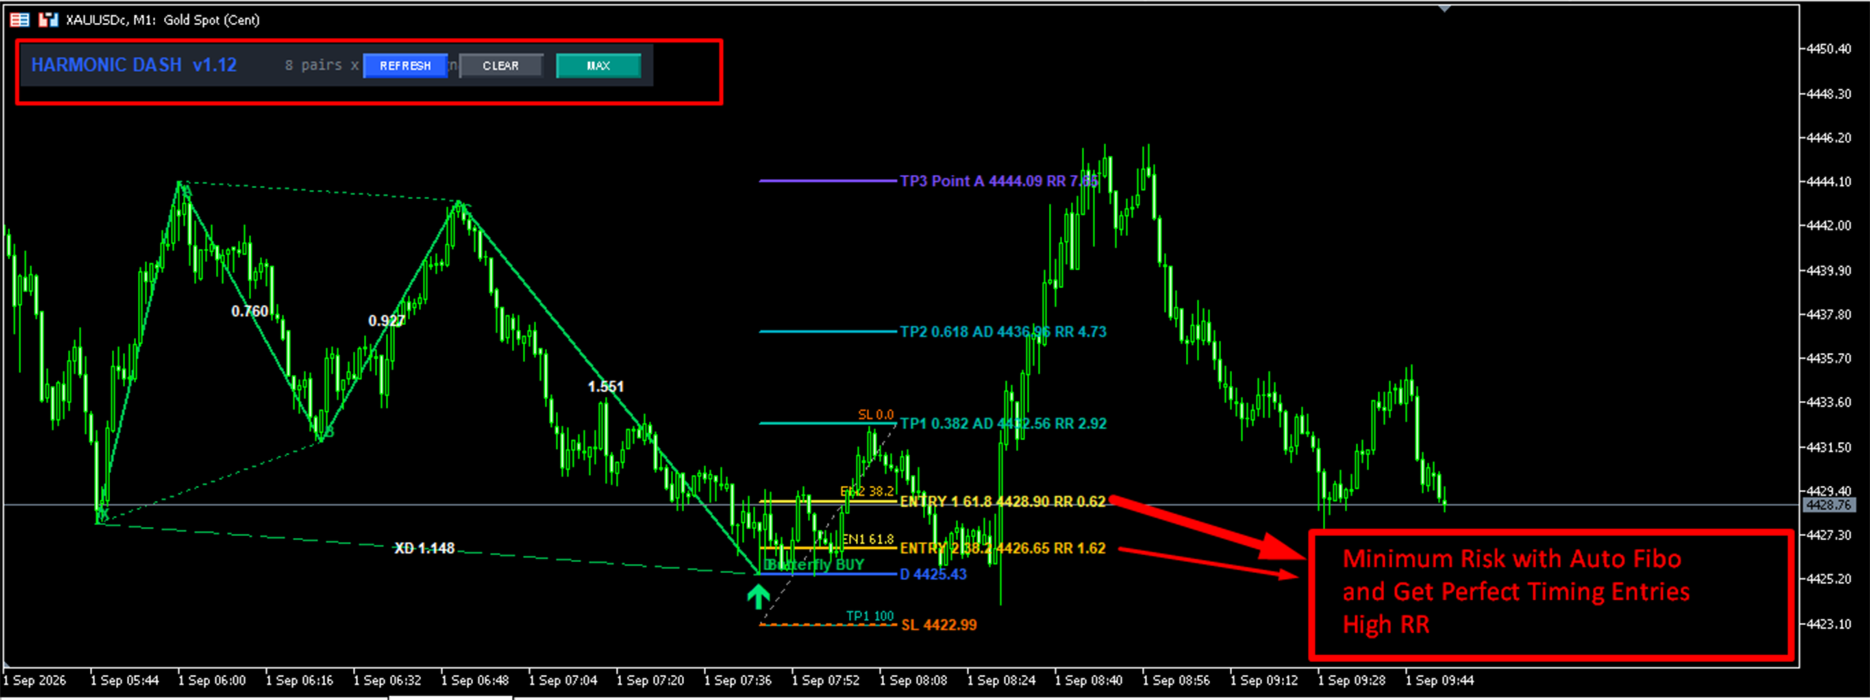
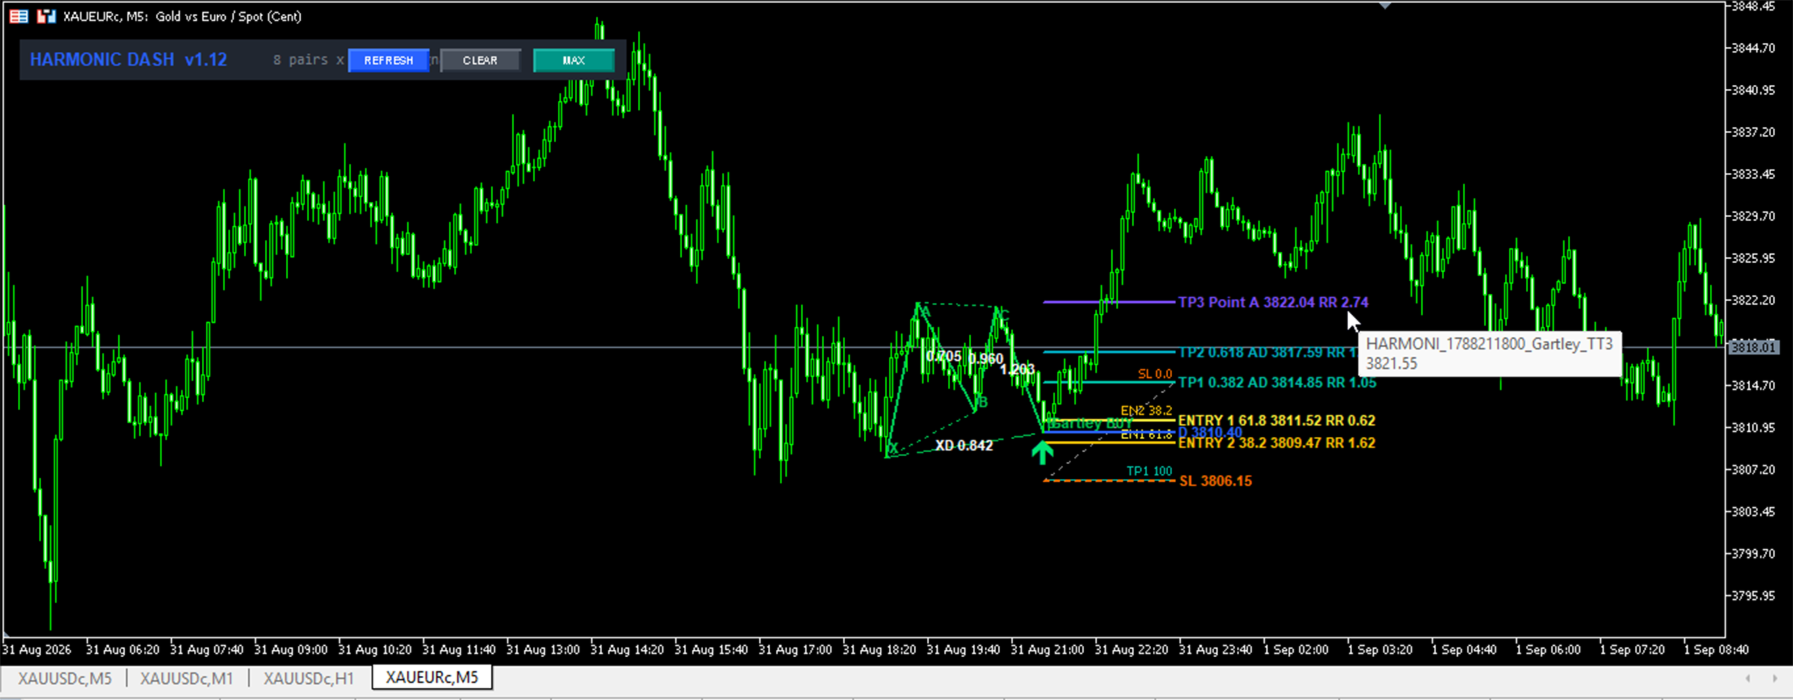
When a valid pattern is detected, the indicator can draw the complete harmonic structure directly on the chart.

The visualization includes:

  • X point

  • A point

  • B point

  • C point

  • D point

  • XA leg

  • AB leg

  • BC leg

  • CD leg

  • XB structure

  • AC structure

  • XD structure

  • Pattern name

  • BUY/SELL direction

This allows you to visually inspect the detected formation instead of relying only on the dashboard.

FIBONACCI LEVELS

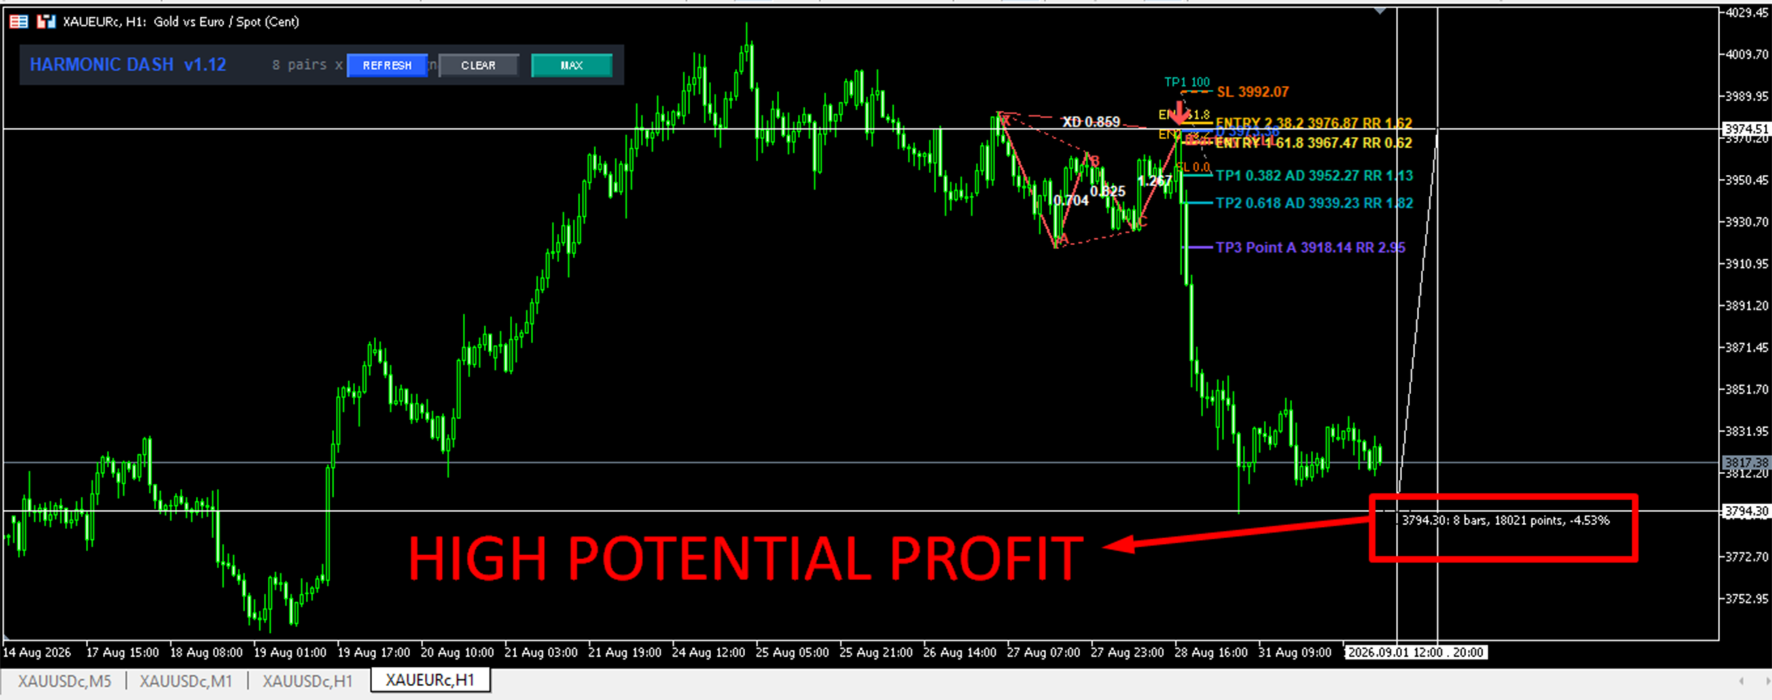
The indicator can automatically display Fibonacci-based levels associated with the detected setup.

The chart visualization can include:

  • Entry levels

  • Stop Loss

  • Fibonacci entry zones

  • TP1

  • TP2

  • TP3

  • Risk/Reward information

This helps traders evaluate the potential structure of a setup directly on the chart.

SMART DASHBOARD

The dashboard is designed to make multi-market monitoring easier.

Displayed information includes:

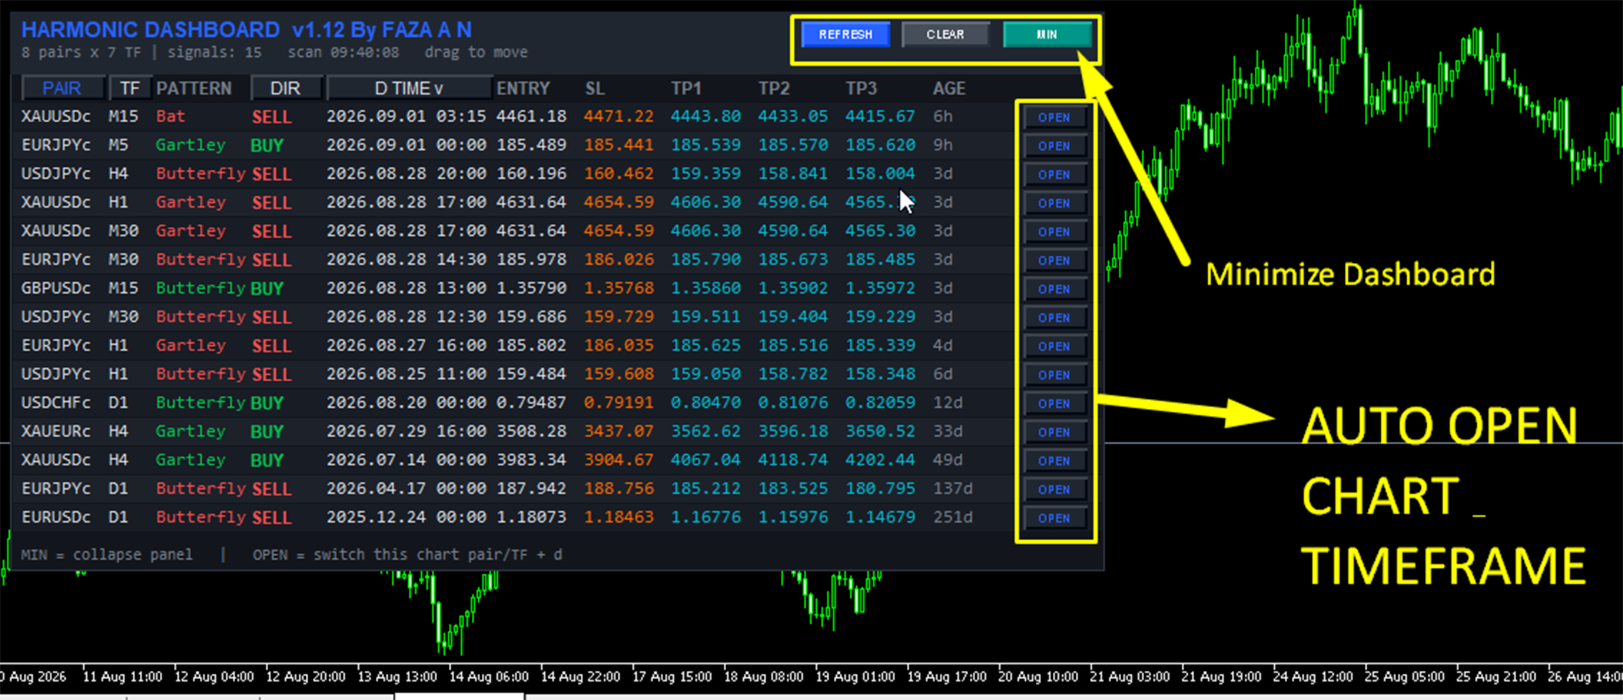
Column Information
PAIR Symbol
TF Timeframe
PATTERN Harmonic pattern
DIR BUY / SELL
D TIME Detection time
ENTRY Pattern entry level
SL Stop Loss
TP1 Target 1
TP2 Target 2
TP3 Target 3
AGE Pattern age
OPEN Open the selected setup

The dashboard can also be sorted according to different criteria.

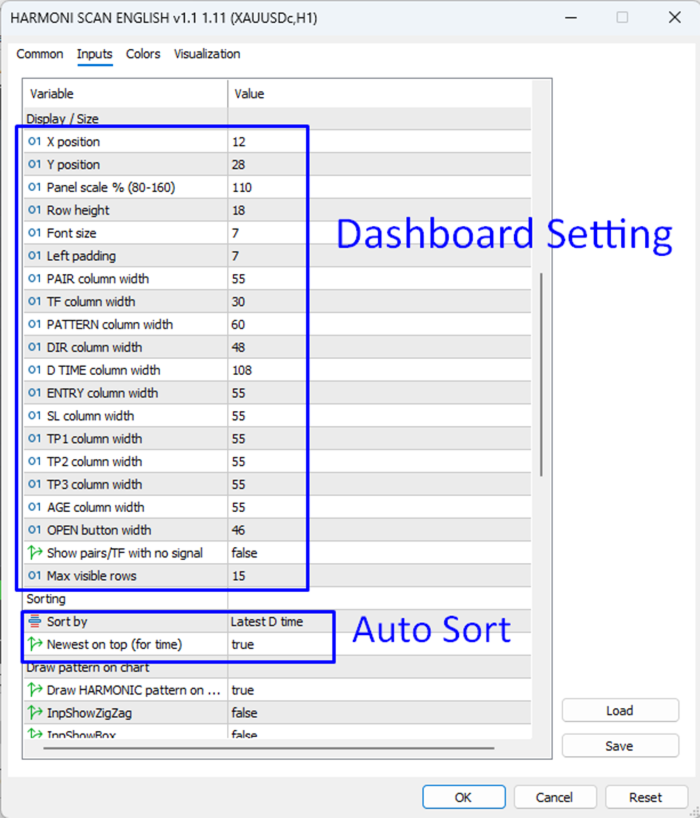
SORTING SYSTEM

You can organize detected signals by:

  • Latest detection time

  • Symbol / Pair

  • Timeframe

  • Direction

This is particularly useful when several harmonic patterns are detected simultaneously.

For example, you can sort the dashboard to show the newest detected setups first.

ONE-CLICK OPEN

The dashboard includes an OPEN button for detected setups.

When a signal is selected, the indicator can switch the current chart to the corresponding:

Symbol + Timeframe

and display the detected harmonic pattern on that chart.

This significantly reduces the time required to manually locate a setup.

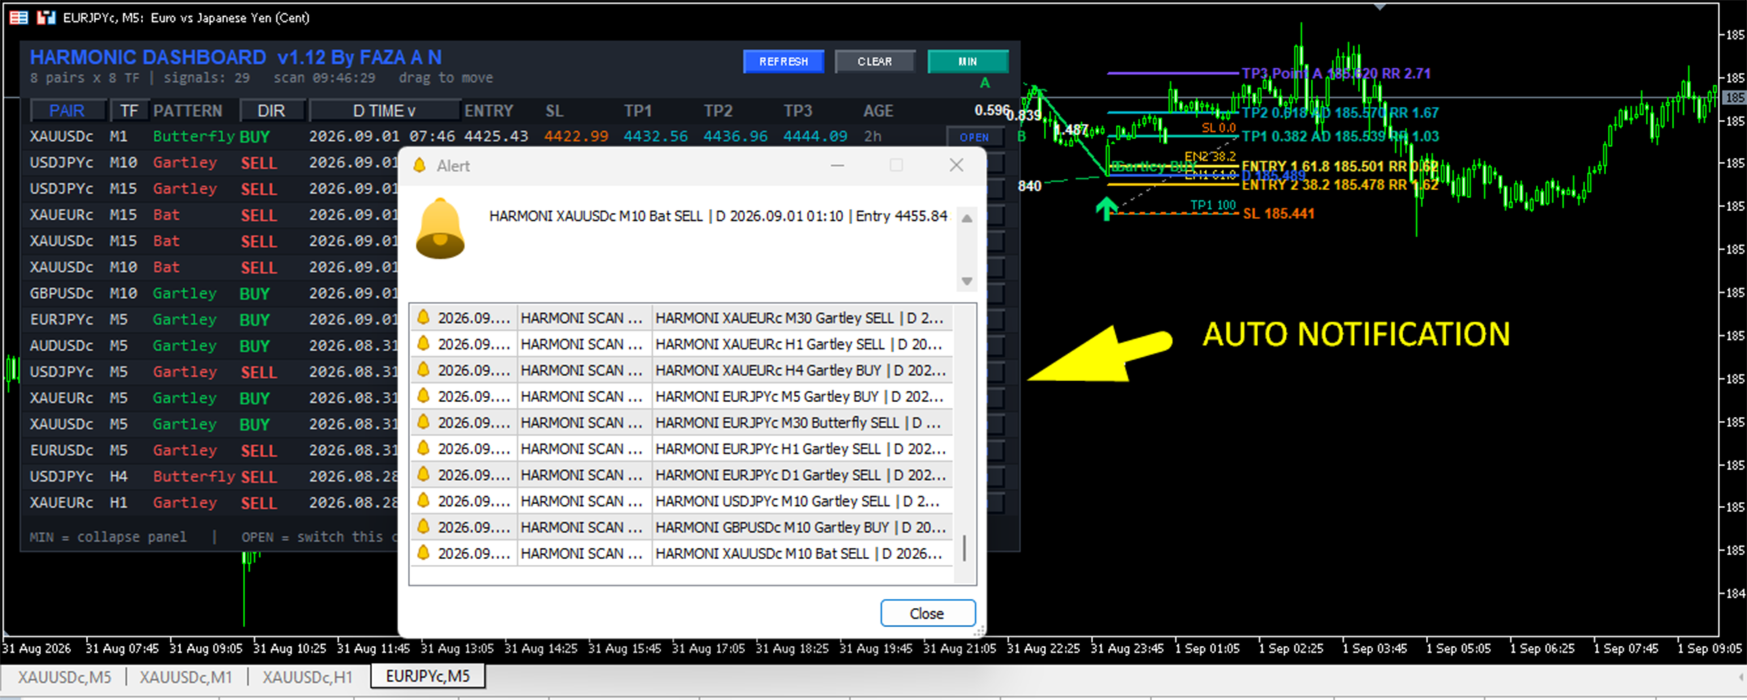
ALERT SYSTEM

The indicator supports multiple alert methods.

Popup Alert

Receive an on-screen MetaTrader alert when a new harmonic pattern is detected.

Sound Alert

Play an alert sound when a new setup appears.

Push Notification

Send the detected setup to your mobile device through MetaTrader push notifications.

The alert can include information such as:

  • Symbol

  • Timeframe

  • Pattern

  • Direction

  • Detection time

  • Entry

  • Stop Loss

  • TP1

  • TP2

  • TP3

You can also configure the indicator to alert only when a new signal is detected.

CUSTOMIZABLE PATTERN DETECTION

You can individually enable or disable harmonic patterns.

Available options include:

  • Gartley

  • Bat

  • Butterfly

  • Crab

  • Cypher

  • Shark

You can also configure:

  • Pivot length

  • Pattern tolerance

  • Signal direction

  • Stop Loss buffer

This allows traders to adapt the scanner to their preferred trading style.

CUSTOMIZABLE SCANNER

The scanner allows you to configure:

Symbols

Choose your own symbols or use Market Watch.

Maximum Symbols

Set the maximum number of symbols to scan.

Timeframes

Select the timeframes you want to monitor.

Scan Interval

Configure how frequently the scanner performs its analysis.

Historical Bars

Configure the amount of historical price data used for pattern detection.

CUSTOMIZABLE DASHBOARD

The dashboard can be customized through several display settings.

You can adjust:

  • Dashboard position

  • Scale

  • Row height

  • Font size

  • Column widths

  • Maximum visible rows

  • Empty-signal visibility

The dashboard can also be dragged to another position on the chart.

A minimize/maximize function is available when you want to reduce chart obstruction.

WHO IS THIS INDICATOR FOR?

HARMONIC DASHBOARD is designed for traders who:

  • Trade harmonic patterns

  • Monitor multiple Forex pairs

  • Trade Gold and other instruments

  • Analyze multiple timeframes

  • Want to reduce manual chart scanning

  • Prefer structured harmonic pattern information

  • Want Entry, SL and TP levels displayed automatically

  • Want alerts when new harmonic setups are detected

  • Want to monitor multiple markets from one chart

RECOMMENDED USE

The indicator can be used for:

  • Forex

  • Gold

  • Indices

  • Other symbols available through your MetaTrader 5 broker

Recommended practice is to combine the detected harmonic formation with your own market analysis, risk management and trading plan.

The indicator is a technical analysis and scanning tool. It does not guarantee profitable trades.

HOW IT WORKS

The detection process generally follows these steps:

1. Market Data

The indicator loads historical price data for the selected symbol and timeframe.

2. Swing Detection

Price swings are identified using the configured pivot length.

3. Harmonic Structure Analysis

The scanner analyzes sequences of swing points to identify potential X-A-B-C-D structures.

4. Fibonacci Ratio Validation

The relationships between the swing points are compared against the configured Fibonacci-based harmonic pattern conditions.

5. Pattern Identification

If the required conditions are satisfied, the formation is classified as one of the supported harmonic patterns.

6. Trade Levels

Potential Entry, Stop Loss and Take Profit levels are calculated from the detected formation.

7. Dashboard

The result is added to the multi-symbol/multi-timeframe dashboard.

8. Alert

If enabled, the indicator can notify you when a new setup is detected.

IMPORTANT

HARMONIC DASHBOARD is a technical analysis tool and scanner.

It does not execute trades automatically.

It does not guarantee profits.

Past market behavior does not guarantee future results.

Always use appropriate risk management and independently evaluate each trading setup before entering a position.

QUICK START

Step 1

Install HARMONIC DASHBOARD on MetaTrader 5.

Step 2

Choose the symbols you want to scan or enable Market Watch scanning.

Step 3

Select the timeframes you want to monitor.

Step 4

Enable the harmonic patterns you want to detect.

Step 5

Configure the alert settings if required.

Step 6

Wait for the scanner to identify valid harmonic formations.

Step 7

Review the detected setup in the dashboard.

Step 8

Click OPEN to switch to the corresponding symbol and timeframe and inspect the harmonic pattern directly on the chart.

MAIN ADVANTAGE

Instead of manually opening dozens of charts and searching for harmonic formations one by one:

HARMONIC DASHBOARD scans multiple markets and timeframes and organizes the detected setups into one centralized dashboard.

Spend less time searching through charts and more time analyzing the setups that matter to you.

PRODUCT TYPE

MetaTrader 5 Custom Indicator

Core Functions

✓ Multi-Symbol Scanner
✓ Multi-Timeframe Scanner
✓ Gartley Detection
✓ Bat Detection
✓ Butterfly Detection
✓ Crab Detection
✓ Cypher Detection
✓ Shark Detection
✓ Bullish & Bearish Setups
✓ Entry Level
✓ Stop Loss Level
✓ TP1 / TP2 / TP3
✓ Risk/Reward Display
✓ Harmonic Pattern Drawing
✓ Fibonacci Visualization
✓ Popup Alerts
✓ Sound Alerts
✓ Push Notifications
✓ Signal Sorting
✓ One-Click Chart Opening
✓ Custom Symbol List
✓ Market Watch Scanning
✓ Customizable Dashboard
✓ Configurable Pattern Tolerance
✓ Configurable Pivot Length


추천 제품
Calendar Dashboard
Chahine Mamodaly
Calendar Dashboard – a compact, real‑time economic calendar that sits directly on your MT5 charts and never gets in the way . Why traders love Calendar Dashboard See upcoming and past news at a glance, with clear time, currency, and impact so you know exactly when markets may move . Instantly spot high‑impact events thanks to color‑coding and a simple legend; past events are marked with a small asterisk for quick reference . Stay aligned across brokers with Broker Time and GMT Time displayed si
FREE
Price Action Builder Premium
Florea E. Sorin-Mihai Persoana Fizica Autorizata
The Price Action Builder Premium expert advisor is an extension of the freely available Price Action Builder Basic :     it provides 2 new candlestick patterns besides the pinbar (already available in the basic edition);     in most configurations, backtesting usually shows an average yearly return rate increased by approximately 50%;     the account growth curve is also smoother, due to larger number of trades, almost double (2x) compared to the free version. While aimed primarily at obtaining
VolatilityRangePanel
Pedro Miguel Caratao Lucena E Vale
Volatility Range Panel MT5 Volatility Range Panel is a powerful, lightweight, and highly visual dashboard designed to give traders an instant overview of market volatility across multiple timeframes. By tracking daily, weekly, and monthly price movements relative to historical averages, this indicator helps you avoid overextended markets and identify high-probability trading zones. Whether you are a day trader looking for the daily average range exhaustion or a swing trader tracking weekly and m
FREE
MP Heatmap for MT5
Pierre Ksachikian
5 (2)
A heatmap is a graphical representation of data in two dimensions, using colors to display different factors. Heatmaps are a helpful visual aid for viewers, enabling the quick dissemination of statistical or data-driven information. The MP Heatmap indicator provides a graphical representation of the relative strengths of major currencies compared to others, organizing data from pairs into color-coded results and producing a clear overview of the entire Forex market. The MP Heatmap indicator dis
FREE
MyZtrade Margin Zones (NKZ) The indicator shows on the chart the zones where major players - market makers and central banks - concentrate their activity, as well as key price levels derived from extremes. **Zones:** - market maker / central bank percentage zones - **5%, 10%, 15%, 20%, 25%** and fine 0.5%…5%; - NKZ zones from highs and lows - 1/4, 1/2, 3/4, 100%, 200%; - ATR zones of higher timeframes (H4, D1, W1, MN). **Features:** - automatic zone building from the latest price extremes; -
Dragon Scale
Paulus Femi Leunufna
DRAGON SCALE User Guide Indicator Visualization The DRAGON SCALE indicator displays several visual elements on the chart: Scale Zone – Displayed as purple areas (accumulation zones) and red areas (distribution zones) surrounding the pivot level. Lifebeat Signal – Appears as an arrow below the candle when the price enters a critical zone. The color of the arrow indicates the direction (green for bullish, red for bearish, yellow for neutral). Entry Countdown – Appears as an arrow above the cand
ClaroFxAlgo Candle Countdown Timer – MetaTrader 5 Indicator Overview CandleCountdownTimer is a powerful yet lightweight MT5 indicator that displays dynamic countdowns to the next candle close, helping traders gain precise timing awareness across all timeframes. Its sleek, customizable design ensures critical timing data is visible—without cluttering your charts. Key Features ️ Main Timer Display – Live countdown to the next candle close on current timeframe Multi-Timeframe Panel – View
FREE
Ultimate Double Top & Bottom (Pro Volume Matrix) Stop trading retail breakouts. Start trading Institutional Traps. The   Ultimate Double Top & Bottom   is not a standard, lagging pattern scanner. It is a highly advanced, non-repainting structural engine equipped with a proprietary   3-Leg Volume Matrix . Designed exclusively for Smart Money Concepts (SMC) and order flow traders, this indicator mathematically dissects the tick volume inside M and W patterns to reveal true institutional intent:  
Harmonic Pattern Plus MT5
Young Ho Seo
4.5 (4)
Introduction Harmonic Patterns are best used to predict potential turning point. Traditionally, Harmonic Pattern was identified manually connecting peaks and troughs points in the chart. Manual harmonic pattern detection is painfully tedious and not suitable for everyone. You are often exposed under subjective pattern identification with manual pattern detection. To avoid these limitations, Harmonic Pattern Plus was designed to automate your harmonic pattern detection process. The functionality
Market Ticker Pro MT5
John Louis Fernando Diamante
The only Market Ticker on the market! Add a professional novelty to your workspace, with built in mini-charts A scrolling Market Ticker that displays price changes from all symbols in the Market Watch list. Provides an easy snapshot of symbol prices, and keeps scrolling automatically while you trade and analyse the chart. The ticker color (+/- price changes) are based on either the current or completed candle, and the previous candle. Options include: - MTF, eg choose to show price changes of t
Introduction to Sideways Market Analyzer Notable period of Low volatility and non-trending movements in the financial market is considered as Sideways Market. Sooner or later, the low volatility will increase and the price will pick up a trend after Sideways Market. In terms of trading point of view, Sideways Market can serve as the very good entry timing for traders. Sideways Market is also quite often the representation of accumulation of large orders from big investors. Therefore, knowing the
An all‑in‑one trading assistant that blends AI candle synthesis with a 15‑pattern Heat Map, ATR‑scaled S/R & pivots, and a Vigilant risk monitor (LOC/TF/SR/PAT gates, Ready%, EM points, SR‑distance bar). The Opportunity Advisor adds ETAs, checklists and gate status; Multi‑TF Confluence confirms alignment from M1–D1. The Professional Trade Suggestion panel shows regime, session filter, R:R presets, Partials and Quality Pause. Clean, readable UI with one‑click S/R toggles, scanners and a built‑in,
Previous High Low Levels
Artur Alves De Carvalho
5 (1)
The Previous High Low Levels indicator displays the high and low of the previous candle from a selected higher timeframe. This helps traders identify key support and resistance zones while trading on lower timeframes. Features: Plots the previous high and low from a higher timeframe Works on all timeframes and instruments Helps identify strong support and resistance levels Lightweight and does not repaint How to Use: Select a higher timeframe (e.g., H1, H4, D1) in the settings. T
FREE
This is the Full Version, to get the free version please contact me. The free version works on “GBPCHF” charts. All symbols and time frames scanner. Harmonic Pattern Harmonic patterns are used in technical analysis that traders use to find trend reversals. They are considered one of the most accurate technical analysis tools, as they allow traders to predict the future price movement direction and the potential trend targets. Also, unlike many other technical tools, the number of false signals
Volume Oscillator PWR
Alexandre Silva Diniz
Volume oscillator 는 가격의 통계적 편차 분석과 거래량의 강도를 결합한 하이브리드 기술 지표입니다. 이 지표는 시장의 상태(추세 또는 횡보) 변화를 시각적 및 수학적으로 정확하게 식별하기 위해 개발되었습니다. 일반적인 오실레이터와 달리, 이 지표는 **거래량 RSI(Volume RSI)**를 사용하여 가격 변동성을 가중합니다. 이를 통해 거래량이 동반되지 않은 '가짜' 움직임을 걸러내고, 대규모 자금 유입으로 확인된 진정한 변동성 분출을 강조합니다. 주요 기능: HLC3 가격 분석: (고가+저가+종가)/3 평균 가격을 사용하여 종가만 사용하는 방식보다 균형 잡힌 시장 해석을 제공합니다. 동적 거래량 계수: InpVolImpact 파라미터를 통해 거래량이 히스토그램 진폭에 미치는 영향력을 사용자가 직접 조절할 수 있습니다. 4색 비주얼 히스토그램: 밝은 녹색: 거래량이 동반된 강력한 상승 변동성 (강한 상승 모멘텀). 어두운 녹색: 상승 추세에 있으나 거래량이나 변동성이
FREE
BinaWin NoTouch
Juan Fernando Urrego Alvarez
BinaWin NoTouch is an indicator that sends an alert signal when the trade is in the right position to wait for the breakdown of a side market. It is specially designed to trade under the “No Touch” strategy of the Binary.Com platform with synthetic indexes N.10, N.25, N.50, N.75 and N.100 Similarly, trading can be done with the conventional CALL and PUT strategy of any Binary Options platform. Requirements to use the indicator: 1. Have an account at Binary.Com 2. Configure the Binary.Com d
FREE
Wolfe Wave Scanner MT5
Reza Aghajanpour
5 (7)
**  All Symbols  x  All Timeframes  scan just by pressing scanner button ** *** Contact me  to send you instruction and add you in "Wolfe Wave Scanner group" for sharing or seeing experiences with other users. + FREE   Trading Utility MT5 Introduction: A Wolfe Wave is created with five-wave patterns in price. It shows supply and demand and a fight towards a balance price. T hese waves of price actions can help traders identify the boundaries of   the trend . Also  It helps forecast how the pric
CypherNexus
Casey Nkalubo
3 (1)
Cypher Pattern Detector A tool for automatic detection of Cypher harmonic patterns (XABCD) in financial charts. Overview The Cypher Pattern Detector identifies both bullish and bearish Cypher harmonic patterns in real time. It applies Fibonacci ratio validation and a quality scoring system to highlight patterns that closely match the defined structure. This helps traders observe and analyze potential market structures more consistently, without the need for manual drawing. Main Features Pattern
FREE
Lazy Bar Replay
Lum Zhen Quan
5 (1)
Lazy Replay The LazyReplay  is a specialized MQL5 indicator designed to facilitate manual backtesting by simulating a "live" market environment on historical data . It allows traders to practice price action strategies by hiding future bars and revealing them at a controlled pace. Key Features Dynamic Chart Masking : Uses a background-colored rectangle to hide all price action to the right of a chosen "anchor" bar, effectively removing hindsight bias during practice . Playback Controls : Include
FREE
Professional Non-Repainting TMA Channel Indicator for MetaTrader 5 TMA Channel PRO Non Repaint is a professional trend and volatility channel indicator designed for traders who work with dynamic support/resistance zones, trend continuation, reversals, and channel-based trading systems. MAIN FEATURES • Non-Repainting Logic • Dynamic TMA Channel • Vertical Histogram Cloud • Median Trend Lines • Buy & Sell Signal Zones • Adaptive Volatility Structure • Multi-Timeframe Compatibility • Suita
RiskPilot Calculator is a sophisticated, professional-grade position sizing solution engineered for serious traders who demand precision, speed, and uncompromising risk management in their trading operations. This advanced Expert Advisor for MetaTrader 5 transforms the complex mathematics of position sizing into an elegant, intuitive interface that eliminates guesswork and emotional decision-making from every trade you execute. By automatically calculating optimal lot sizes based on your account
Pattern Recognition EA
Claudiu-georgian Zavera
Pattern Recognition EA - From Learn to Earn. The market repeats itself. This EA finds every past repeat of the current candle sequence - and lets history vote the direction. ONE SHAPE. EVERY REPEAT IN HISTORY VOTES. The last N candles on your signal timeframe form a shape. The EA scans the history you choose - a fixed number of bars or everything your broker provides - for the SAME shape, and checks what happened next, every single time. Only when enough repeats exist AND a clear majority of t
Gann High Low Activator MT5
Do Kim Dang Khoi
5 (1)
If you love this indicator, please leave a positive rating and comment, it will be a source of motivation to help me create more products <3 How to use Gann High-Low Activator? The Gann HiLo Activator helps the trader identify the current trend of the market. When the indicator is below the closing price, it can indicate that an uptrend is taking place. Conversely, when the indicator is above the closing price, it can indicate a downtrend. The Gann HiLo Activator also generates buy and sell sig
FREE
Utilities
Douglas Lucio De Araujo
Indicator with 3 features - Clock : Clock independent of the chart, counting continues even when the market is closed. - Template : After setting up a configuration in any graphic, be it color patterns, indicators, zoom ... The configuration will be copied to all active graphics. - TimeFrame : Set the TimeFrame on a chart, and with just one click all the active charts will be changed to the same TimeFrame.
X Sensors Pro
Igor Nagorniuk
X Sensors Pro는 선택된 기간 동안 가격 수준별 거래량 분포를 시각화하는 전문 볼륨 프로파일 지표입니다. 이 지표는 자동으로 로컬 극값(HH와 LL)을 식별하고, 최대 거래량 수준인 POC(Point of Control)를 계산하며, 식별된 범위를 기반으로 지지선과 저항선을 구축합니다. 주요 기능: 컬러 히스토그램 형태의 볼륨 프로파일 시각화 POC(Point of Control) 자동 감지 HH(더 높은 고가) 및 LL(더 낮은 저가) 수준 구축 피벗 수준 및 다중 지지/저항 수준 계산 강세(녹색) 및 약세(빨간색) 거래량의 색상 표시 모든 시간대에 적응하는 조정 기능 이 지표의 용도는 무엇인가요? 이 지표는 트레이더의 다음과 같은 과제를 해결합니다: 1. 축적 및 분배 영역 식별 거래량은 항상 큰 세력이 시장에 진입하거나 이탈하는 곳에 집중됩니다. POC는 최대 거래량이 발생한 가격을 보여줍니다. 이것은 심리적으로 중요한 수준입니다. 2. 공정 가치 탐색 PO
(c) Uniprojects Weekly Pivot Custom Weekly Pivot Custom is a lightweight MetaTrader 5 indicator that plots weekly CPR, classic weekly pivot levels, and optional previous-week range levels directly on the chart. The indicator is designed for traders who use higher-timeframe weekly structure as part of daily or intraday planning. It calculates the current week levels from the previous weekly candle and can also draw a bounded number of historical weekly levels for review. What It Draws - TC:
EMA Cross Master Pro: Arrows & Phone Alerts 9/20   is a powerful and user-friendly trend-following indicator designed for MetaTrader 5. It specializes in detecting the high-probability "Golden Cross" and "Death Cross" setups using the   Exponential Moving Average (EMA) 9 and 20 periods. This tool is perfect for traders who want to capture early trend reversals without staring at the screen 24/7. Key Features: Precision Entry Arrows:   Clear Buy/Sell arrows appear instantly on your chart when th
Upgrade your technical analysis with a professional, lag-free Pivot and Market Session indicator. Perfect for Day Traders, Scalpers, and Prop Firm users who need precise Support & Resistance zones without cluttering their MetaTrader 5 charts. Key Features: Clean Visuals: Uses exact-length trendlines instead of infinite rays to keep your chart clutter-free. Special Calculation: Uses special calculation to determine the pivot, resistance, and support zones. The accuracy is reliable. Smart Dynamic
Key Features: 200+ Fully Implemented Patterns   across all categories Advanced Market Structure Analysis Smart Money Integration   (Wyckoff, Order Blocks, Liquidity) Professional Risk Management Multi-Timeframe Analysis AI-Powered Confidence Scoring Advanced Visualization Real-time Alerts Pattern Categories: Single Candle Patterns (Hammer, Doji, Marubozu, etc.) Multi-Candle Patterns (Engulfing, Stars, Harami, etc.) Chart Patterns (Head & Shoulders, Cup & Handle, Triangles, etc.) Harmonic Pattern
FREE
Volume flow Profile
Israr Hussain Shah
Master Edition은 거래량과 자금 흐름의 관점을 통해 시장 구조를 시각화하도록 설계된 전문가급 분석 도구입니다. 표준 거래량 지표와 달리, 이 도구는 차트에 일일 거래량 프로필을 직접 표시하여 가격 발견이 발생한 위치와 "스마트 머니"가 위치한 곳을 정확하게 볼 수 있게 합니다. 이 Master Edition은 명확성과 속도를 위해 설계되었으며, 로드 시 차트 레이아웃을 즉시 아름답게 만드는 독특한 자동 테마 동기화 시스템을 특징으로 합니다. 주요 기능: 진정한 자금 흐름 계산: 표준 틱 거래량을 넘어섭니다. "Use Money Flow"를 활성화하면 거래량이 가격에 따라 가중치가 부여되어 특정 가격 수준에서의 실제 자본 투입을 드러냅니다. 가치 영역(VA) 시각화: 가치 영역(기본값: 거래량의 70%)을 자동으로 계산합니다. VA Fill: 통제 구역을 즉시 식별하기 위해 가치 영역 배경을 음영 처리합니다. 주요 수준: 통제점(POC), 가치 영역 고점(VAH), 가치 영
이 제품의 구매자들이 또한 구매함
이 제품은 2026년 시장에 맞게 업데이트되었으며 최신 MT5 빌드에 최적화되었습니다. 가격 업데이트 안내: Smart Trend Trading System은 현재 $99 에 제공됩니다. 다음 30회 구매 후 가격은 $199 로 인상됩니다. 특별 혜택: Smart Trend Trading System 구매 후 저에게 개인 메시지를 보내시면 Smart Universal EA를 무료 로 받을 수 있으며, Smart Trend 신호를 자동 거래로 전환할 수 있습니다. Smart Trend Trading System은 리페인트 없음, 재그리기 없음, 지연 없음의 완전한 트레이딩 시스템으로, 더 깨끗한 신호, 더 나은 추세 방향, 그리고 더 체계적인 시장 거래 방식을 원하는 트레이더를 위해 제작되었습니다. Learn Smart Trend Trading System Everything you need to learn, install, and use the product is available
Trend Sniper X
Sarvarbek Abduvoxobov
5 (13)
Trend Sniper X 는 트레이더가 추세 방향과 잠재적 반전 지점을 명확하고 정확하게 포착할 수 있도록 도와주는 MetaTrader 5용 멀티 타임프레임 추세 추종 지표입니다. MT4용: https://www.mql5.com/en/market/product/193245 가격 정보: 현재 가격은 프로모션 가격이며, 향후 업데이트 및 새로운 기능 출시 시 변경될 수 있습니다. Code2Profit 채널 멀티 타임프레임 분석으로 시장을 마스터하세요! Trend Sniper X로 승률을 극대화하는 방법: 핵심 규칙 및 세션 팁 기술 사양 플랫폼 MetaTrader 5 지표 유형 멀티 타임프레임 추세 지표 운용 타임프레임 모든 차트 타임프레임 지원, 독립적으로 선택 가능한 상위 타임프레임(M1–MN1) 주요 상품 외환, 금(XAUUSD) 및 기타 CFD 권장 계좌 모든 계좌 유형 시각화 색상별 추세 캔들(매수/매도/약세/변경) + 매수/매도 화살표 추가 모듈 세션 시장 박스(시드니, 도
Neuro Poseidon MT5
Daria Rezueva
4.85 (54)
Neuro Poseidon is a new indicator by Daria Rezueva. It combines precise trading signals with adaptive TP/SL levels - creating best possible trades as a result! Message me and get  Neuro Poseidon Assistant  as a gift to automize your trading process! What makes it stand out? 1. Proven profitability on all assets and timeframes 2. Only confirmed BUY and SELL signals present on the chart 3. Adaptive TP & SL levels generated by the software for each trade 4. Easy to understand - suitable for al
Welcome to ENTRY IN THE ZONE AND SMC MULTI TIMEFRAME Entry In The Zone and SMC Multi Timeframe is a real-time market analysis tool based on Smart Money Concepts (SMC), designed to analyze market structure, price direction, and key trading zones. It supports both Single-Timeframe Analysis and Multi-Timeframe Analysis, providing a clearer view of the overall market structure across multiple timeframes, with real-time BUY / SELL signals that do not repaint. It is designed to help filter trading opp
SMC Intraday Formula
Kareem Abbas
5 (22)
먼저 솔직하게 말하겠습니다. 어떤 인디케이터도 단독으로 당신을 수익성 있게 만들어주지 않습니다. 누군가 그렇게 말한다면, 그는 당신에게 꿈을 파는 것입니다. 완벽한 매수/매도 화살표를 보여주는 모든 인디케이터는 완벽하게 보이도록 만들 수 있습니다 — 단지 올바른 과거 구간을 확대하고 승리한 거래만 캡처하면 됩니다. 우리는 그렇게 하지 않습니다.  SMC Intraday Formula는 도구입니다. 시장 구조를 읽고, 가장 높은 확률의 가격 구간을 표시하며, 현재 스마트 머니의 흐름이 어떻게 보이는지 아주 단순한 언어로 보여줍니다. 최종 결정은 여전히 당신이 합니다. 실행도 당신이 합니다. 하지만 이제는 희망이 아니라 정확성으로 거래하게 됩니다. 우리는 이 인디케이터를 지난 약 3년 동안 골드(XAUUSD) 및 주요 외환 통화쌍의 데이 트레이딩 스캘핑에 사용해 왔습니다. M1, M5, M15, M30에서 우리의 핵심 도구입니다. 이 도구는 미래를 예측하려 하지 않습니다 — 지금 형성
SuperScalp Pro
Van Minh Nguyen
4.63 (32)
SuperScalp Pro – 전문 멀티 레이어 컨플루언스 스캘핑 시스템 SuperScalp Pro 는 다중 컨플루언스를 기반으로 한 전문 스캘핑 시스템으로, 트레이더가 더 높은 확률의 매매 기회를 식별할 수 있도록 설계되었습니다. 명확한 진입 신호 확인, ATR 기반 손절(Stop Loss) 및 목표가(Take Profit), 그리고 XAUUSD, BTCUSD 및 주요 외환 통화쌍에 대한 유연한 신호 필터링 기능을 제공합니다. 중요! SuperScalp Pro Auto Trader EA를 사용하여 SuperScalp Pro 신호를 자동으로 거래할 수 있습니다: [Auto Trader] 제품 업데이트, 뉴스 및 공지사항을 확인하려면 SuperScalp Pro 공식 MQL5 채널을 팔로우하세요: [Official Channel] SuperScalp Pro 는 Supertrend, VWAP, EMA, RSI, ADX, 거래량 분석, 볼린저 밴드 및 MACD 다이버전스를 결합하여 낮은
Zoryk Gold
Reda El Koutbane
5 (7)
ZORYK — MetaTrader 5용 XAUUSD 전문 신호 및 트레이드 플래닝 시스템 이런 경험이 있을 것입니다. 골드를 분석하고 진입을 기다린 뒤 마침내 포지션을 열었지만 가격이 곧바로 반대 방향으로 움직입니다. 너무 일찍 청산하거나 Stop Loss를 옮기거나 몇 초 동안 망설입니다. 그 후 시장은 내가 없이도 처음 예상했던 목표까지 정확히 움직입니다. 문제는 항상 방향이 아니었습니다. 진짜 문제는 불확실성이었습니다. 정확한 진입 위치를 몰랐습니다. 어느 지점에서 원래의 트레이드 아이디어가 무효가 되는지 몰랐습니다. 가까운 수익을 확보해야 할지 더 큰 움직임을 기다려야 할지 판단하기 어려웠습니다. 현재 setup이 정말 강한지 아니면 단지 새로운 거래를 억지로 찾고 있는지도 확신하기 어려웠습니다. 골드는 매우 빠르게 움직입니다. 명확한 계획이 없다면 좋은 분석도 몇 초 만에 나쁜 결정으로 바뀔 수 있습니다. ZORYK는 이 문제를 해결하기 위해 개발되었습니다.
Unix Scalper
Issam Kassas
UNIX Scalper — Gold Scalping Indicator for MetaTrader 5 UNIX Scalper is a focused Gold scalping indicator designed primarily for XAUUSD on M1, M2, M3, M5, M10 and M15. It gives the trader a clear BUY, SELL or WAIT decision together with the complete trade plan: Entry, Stop Loss, TP1 and TP2 . PRICE UPDATE NOTICE: Currently available for $199. The price will   increase to $399   after the next   30 purchases . The concept is simple: wait for the signal, follow the levels, move the Stop Loss to
GoldenX Entry MT5
Kareem Abbas
5 (16)
GoldenX Entry는 MT5용 인디케이터로, 적응형 Smart Entry Trend 알고리즘, 신호 스코어링 시스템, 시장 레짐 감지 기능, 그리고 변동성 필터를 포함합니다. 각 신호에는 계산된 진입 레벨, 3개의 익절(TP1, TP2, TP3) 레벨, 그리고 손절(Stop-Loss) 레벨이 포함됩니다. 이 인디케이터는 다양한 시장 환경에 적응하도록 설계된 다중 분석 레이어 구조 위에 구축되어 있으며, 내장 최적화기와 통계 추적 시스템을 결합합니다. 또한 Risk-to-Reward(RR) 지표와 과거 거래 행동 기반의 정량 분석을 제공합니다. 시작은 간단합니다 — 선택한 타임프레임에서 최적화기를 실행한 뒤 차트에서 바로 인디케이터를 사용하면 됩니다. 핵심 기능 GoldenX Entry는 하나의 차트에서 신호 엔진, 트레이드 관리 기능, 그리고 과거 통계 추적을 통합합니다: - 내장 최적화기: 최적화기는 차트에서 원클릭으로 실행됩니다. 200개의 파라미터 조합을 두 단계 탐색
Superhero
Ihor Otkydach
5 (2)
SUPERHERO 지표는 “올인원” 방식으로 설계된 다중 통화 거래 시스템입니다. 이 지표는 시장을 독자적으로 분석하여 포지션을 개설하고 청산할 시점에 대한 신호를 제공합니다. 손절매(Stop Loss) 및 익절(Take Profit) 주문을 활용하며, 위험 대비 수익 비율(R:R)은 1:1입니다. 가끔 저는 이 시스템의 신호를 바탕으로 직접 거래를 하는데, 그 결과는 다음과 같습니다— 실시간 신호 이 시스템은 스마트폰으로 푸시 알림을 전송할 수 있으므로, PC에 묶여 있을 필요 없이 “이동 중에도” 매매를 할 수 있습니다. 이는 자체 거래 전문 회사에 안성맞춤입니다. 모든 고객님께 드리는 특별 혜택: 이 지표를 구매하시는 모든 분께는 제가 특별히 준비한 유틸리티를 선물로 드릴 예정이며, 이 유틸리티는 다음과 같은 기능을 제공합니다: 손절매 및 익절 주문을 자동으로 설정합니다 가격이 목표 수준에 도달하면 자동으로 포지션을 청산합니다 미결제 주문 거래를 지원합니다 평균화 거래 모드를
M1 Sniper MT5
Oleg Rodin
5 (6)
M1 SNIPER 는 사용하기 쉬운 거래 지표 시스템입니다. M1 시간대에 맞춰 설계된 화살표 지표입니다. 이 지표는 M1 시간대 스캘핑을 위한 단독 시스템으로 사용할 수 있으며, 기존 거래 시스템의 일부로도 사용할 수 있습니다. 이 거래 시스템은 M1 시간대 거래용으로 특별히 설계되었지만, 다른 시간대에도 사용할 수 있습니다. 원래는 XAUUSD와 BTCUSD 거래를 위해 이 방법을 설계했지만, 다른 시장 거래에도 유용하다는 것을 알게 되었습니다. 이 지표의 신호는 추세 방향과 반대로 거래될 수 있습니다. 저는 지표의 신호를 활용하여 양방향으로 거래할 수 있도록 돕는 특별한 거래 기법을 알려드립니다. 이 방법은 특별한 동적 지지선과 저항선 가격 영역을 활용하는 것을 기반으로 합니다. 구매하시면 M1 SNIPER 화살표 지표를 바로 다운로드하실 수 있습니다. 또한, 아래 스크린샷에 표시된 Apollo Dynamic SR 지표는 M1 SNIPER 도구를 사용하는 모든 사용자에게 무료로
Divergence Bomber
Ihor Otkydach
4.89 (94)
가끔은 제가 직접 이 시스템을 이용해 거래를 하곤 합니다. 실계좌에서 제가 직접 수행하는 BOMBER 트레이딩을 확인해 보세요 - LIVE SIGNAL 이 지표를 구매하신 분께는 다음과 같은 혜택이 무료로 제공됩니다: 각 거래를 자동으로 관리하고, 손절/익절 수준을 설정하며, 전략 규칙에 따라 거래를 종료하는 전용 도우미 툴 "Bomber Utility" 다양한 자산에 맞게 지표를 설정할 수 있는 셋업 파일(Set Files) "최소 위험", "균형 잡힌 위험", "관망 전략" 모드로 설정 가능한 Bomber Utility의 셋업 파일 이 전략을 빠르게 설치, 설정, 시작할 수 있도록 돕는 단계별 영상 매뉴얼 주의: 위의 모든 보너스를 받기 위해서는 MQL5 개인 메시지 시스템을 통해 판매자에게 연락해 주세요. 독창적인 커스텀 지표인 “Divergence Bomber(다이버전스 봄버)”를 소개합니다. 이 지표는 MACD 다이버전스(괴리) 전략을 기반으로 한 올인원(All-in-On
Gann Made Easy MT5
Oleg Rodin
5 (9)
Gann Made Easy 는 mr.의 이론을 사용하여 최고의 거래 원칙을 기반으로 하는 전문적이고 사용하기 쉬운 Forex 거래 시스템입니다. W.D. 간. 이 표시기는 Stop Loss 및 Take Profit Levels를 포함하여 정확한 BUY 및 SELL 신호를 제공합니다. PUSH 알림을 사용하여 이동 중에도 거래할 수 있습니다. 구매 후 거래 방법 안내 및 유용한 추가 지표를 무료로 받으시려면 저에게 연락주세요! 아마도 Gann 거래 방법에 대해 이미 여러 번 들었을 것입니다. 일반적으로 Gann의 이론은 초보자 거래자뿐만 아니라 이미 거래 경험이 있는 사람들에게도 매우 복잡한 것입니다. Gann의 거래 방식은 이론적으로 적용하기 쉽지 않기 때문입니다. 나는 그 지식을 연마하고 Forex 지표에 최고의 원칙을 적용하기 위해 몇 년을 보냈습니다. 표시기는 적용하기가 매우 쉽습니다. 차트에 첨부하고 간단한 거래 권장 사항을 따르기만 하면 됩니다. 지표는 지속적으로 시장 분석
Entry Points Pro for MT5
Yury Orlov
4.51 (150)
전설이 돌아왔습니다: Entry Points Pro 10. MQL5 마켓 Top-3 자리를 3년간 지켜온 전설적인 지표의 재출시입니다. 수백 개의 호평 리뷰(두 버전 합산 589개), 매일 이 지표로 거래하는 수천 명의 트레이더, 31,000회 이상의 데모 다운로드   MT4+MT5 . 지난 5년간 여러분이 남긴 리뷰를 하나도 빠짐없이 읽었고, 약속 대신 그 답을 버전 10에 담았습니다. 1999년부터 시장에서 활동하며 정직함과 자신의 평판, 그리고 고객을 소중히 여기는 개발자가 만들었습니다. Entry Points Pro의 진입 시그널은 절대 리페인팅되지 않습니다. 그리고 이번에는 개발자의 말뿐이 아니라 검증 가능한 사실입니다: 확정 시그널은 캔들 종가에서만 표시되며, 자동화 테스트에서 리페인팅 0건 이 확인되었습니다(EURUSD, XAUUSD, BTCUSD에서 2,486,568회의 불변조건 검사 — 위반 0건). 검증 방법은 공개되어 있으니 전략 테스터에서 직접 재현해 보실 수
Atomic Analyst MT5
Issam Kassas
4.44 (54)
이 제품은 2026년 시장에 맞게 업데이트되었으며 최신 MT5 빌드에 최적화되었습니다. 가격 업데이트 안내: Atomic Analyst는 현재 $99 에 제공됩니다. 다음 30회 구매 후 가격은 $199 로 인상됩니다. 특별 혜택: Atomic Analyst 구매 후 저에게 개인 메시지를 보내시면 Smart Universal EA를 무료 로 받을 수 있으며, Atomic Analyst 신호를 자동 거래로 전환할 수 있습니다. Atomic Analyst는 리페인트 없음, 재그리기 없음, 지연 없음의 Price Action 거래 인디케이터로, 수동 거래, 신호 명확성, EA 자동화를 위해 설계되었습니다. User manual: settings, inputs and strategy.   &   User Manual PDF . 가격 움직임, 강도, 모멘텀, 다중 시간대 방향 및 고급 필터를 분석하여 트레이더가 노이즈를 줄이고 약한 세팅을 피하며 더 체계적인 거래 결정을 내릴 수 있도록
FiboSniper Pro
Van Minh Nguyen
5 (2)
FiboSniper Pro – 전문 멀티 필터 Fibonacci Grid 트레이딩 시스템 FiboSniper Pro는 Fibonacci Envelopes와 ADX, EMA, RSI, ATR 및 시간 필터를 포함한 여러 단계의 시장 확인 조건을 결합한 고급 기술적 트레이딩 지표 시스템입니다. 가격 구조, 추세, 모멘텀 및 변동성 분석을 종합하여 보다 선별적이고 높은 품질의 진입 기회를 식별할 수 있도록 지원하며, 체계적인 거래 관리를 위해 ATR 기반의 Stop Loss 및 Take Profit 수준을 자동으로 제공합니다. 구매 후 Auto Trader X를 사용하여 FiboSniper Pro 신호를 자동으로 거래하는 방법에 대한 안내가 필요하시면 저에게 문의해 주세요. Auto Trader X를 사용하여 FiboSniper Pro 거래 신호를 자동화하세요:  [Auto Trader X] 사용자 가이드 및 권장 설정 파일 보기: [Click here] 업데이트 및 뉴스를 확인하려면 F
UZFX {SSS} 스캘핑 스마트 시그널 v5.0 MT5는 급변하는 시장에서 정확한 실시간 시그널을 필요로 하는 스캘퍼, 데이 트레이더, 스윙 트레이더를 위해 설계된 리페인팅이 없는 고성능 트레이딩 지표입니다. (UZFX-LABS)에서 개발한 이 지표는 가격 움직임 분석, 추세 확인 및 스마트 필터링을 결합하여 모든 통화 쌍과 시간대에서 높은 확률의 매수 및 매도 신호, 경고 신호, 추세 지속 기회를 생성합니다. 거래에 대한 망설임을 멈추고, 명확성, 정밀성, 그리고 규율 있는 시장 실행을 원하는 트레이더를 위해 설계된 체계적인 신호 시스템을 따르기 시작하세요. 제 말을 믿으세요. 이 지표는 MQL5에서 구할 수 있는 최고의 지표 중 하나입니다. 그러니 절대 놓치지 마세요!! “현명한 트레이더를 위한 스마트 신호” 지금 최신 버전 5.0이 출시되었으며, 사전 공지 없이 가격이 최대 $499.99까지 인상될 수 있으니 기회를 놓치기 전에 서둘러 구매하세요!! 최종 구매 전! 무료 체
Axiom Matrix
Issam Kassas
5 (6)
AXIOM MATRIX MT5 출시 가격: $99 Axiom Matrix는 출시 가격 $99에 제공됩니다. 첫 30회 구매 이후 가격은 $199로 인상됩니다. 구매 후, 안내 사항을 받고 독점 선물 보너스를 받기 위해 저에게 직접 DM을 보내주세요. Axiom Matrix는 MetaTrader 5용 전문 멀티 심볼, 멀티 타임프레임 시장 스캐너이자 의사결정 대시보드입니다. Axiom Matrix는 사용자의 Market Watch를 스캔하고, 여러 타임프레임을 분석하며, 여러 근거 엔진을 읽고, 가장 강한 기회를 비교하여 하나의 깔끔한 매트릭스 대시보드 안에서 최적의 BUY, SELL, WAIT 또는 차단 상태를 보여줍니다. 저는 무거운 시장 스캔 작업을 대신 처리해 줄 수 있는 하나의 도구가 필요했기 때문에 Axiom Matrix를 만들었습니다. 저는 RSI만 따로 확인하고 싶지 않았습니다. 그다음 MACD만 따로 확인하고. 그다음 이동평균. 그다음 거래량. 그다음 변동성. 그다음
Azimuth Pro
Ottaviano De Cicco
5 (7)
Azimuth Pro V2: Synthetic Fractal Structure and Confirmed Entries for MT5 Overview Azimuth Pro is a multi-level swing structure indicator by Merkava Labs . Four nested swing layers, swing-anchored VWAP, ABC pattern detection, three-timeframe structural filtering, and closed-bar confirmed entries — one chart, one workflow from micro-swings to macro-cycles. This is not a blind signal product. It is a structure-first workflow for traders who care about location, context, and timing. ️ Summer Sale
Advanced Supply Demand MT5
Bernhard Schweigert
4.53 (15)
현재 33% 할인! 초보자나 전문 트레이더를 위한 최고의 솔루션! 이 보조지표는 우리가 다수의 독창적 기능과 새로운 공식을 통합한 독특하고 고품질이며 저렴한 거래 도구입니다. 이 업데이트를 통해 이중 시간대를 표시할 수 있습니다. 더 높은 TF를 표시할 수 있을 뿐만 아니라 차트 TF와 더 높은 TF 모두를 표시할 수 있습니다: 중첩 영역 표시. 모든 Supply Demand 트레이더들이 좋아할 것입니다. :) 중요한 정보 공개 Advanced Supply Demand의 잠재력을 극대화하려면 다음을 방문하십시오. https://www.mql5.com/ko/blogs/post/720245   진입 또는 목표의 명확한 트리거 포인트를 정확히 찾아냄으로 해서 거래가 어떻게 개선될지 상상해 보십시오. 새로운 알고리즘을 기반으로 매수자와 매도자 간의 잠재적인 불균형을 훨씬 더 쉽게 분간할 수 있습니다. 왜냐하면 가장 강한 공급영역과 가장 강한 수요 영역과 과거에 어떻게 진행 되었는지를(이전
Trend Catcher ind mt5
Ramil Minniakhmetov
5 (18)
트렌드 캐처 인디케이터 트렌드 캐처 인디케이터는 개발자가 자체 개발한 맞춤형 적응형 트렌드 분석 지표들을 조합하여 시장 가격 움직임을 분석합니다. 단기적인 노이즈를 제거하고 근본적인 모멘텀 강도, 변동성 확대, 가격 구조 움직임에 집중하여 진정한 시장 방향을 파악합니다. 또한 이동 평균, RSI, 변동성 필터와 같은 맞춤형 지표들을 활용하여 가격을 평활화하고 트렌드를 필터링합니다. 실제 운영 모니터링 및 기타 제품은 다음 링크에서 확인하실 수 있습니다:   https://www.mql5.com/en/users/mechanic/seller 텔레그램에서는 EA나 설정 파일을 판매하지 않습니다. 사기이니 주의하세요. 모든 설정 파일은 블로그에서 무료로 제공됩니다. 중요! 구매 후 즉시 연락 주시면 사용 방법 및 보너스를 드립니다!
Power Candles MT5
Daniel Stein
5 (10)
Power Candles V3 - 자체 최적화 강도 지표 파워 캔들 V3는 적용된 모든 차트에서 통화 및 상품의 강세를 실행 가능한 거래 계획으로 전환합니다. 단순히 캔들에 색상을 입히는 대신, 백그라운드에서 실시간 자동 최적화를 수행하여 현재 보고 있는 종목에 대한 최적의 손절매, 익절 및 신호 임계값을 제공합니다. 한 번의 클릭으로 실시간 거래에 적용할 수 있으며, 진입점, 손절매 및 익절 선이 정확한 가격에 맞춰 차트에 표시되고, 방향과 함께 알림이 발령됩니다. 이 도구는 Stein Investments 에코시스템의 일부입니다. 18개 이상의 도구와 함께 당신의 1대1 AI 트레이딩 멘토 Max.  항상 대기 중, 모든 인디케이터를 깊이 있게 이해, 무언가를 차근차근 생각해보고 싶은 순간에 도움을 줍니다.  https://stein.investments 에서 만나보세요 매 종가 바마다 3,000회 이상의 트레이딩 시뮬레이션. 9가지 강도 상태. 2가지 전략을 병렬로 테스트.
KURAMA GOLD SIGNAL PRO (MT5) — 7중 필터 · 자동 TP/SL · 품질 점수 · 시그널 기록 저장 | XAUUSD 완전 트레이딩 시스템 실시간 리페인트 없음. 시그널이 나타나는 순간 화살표, 진입, TP, SL이 그 자리에 고정되어 이후 절대 움직이지 않습니다. 여러분이 거래하는 것은 바로 이 실시간 시그널입니다. 그리고 v7.20에서는 실제로 발신된 모든 시그널이 자동 저장되어 재시작 후에도 정확히 복원됩니다. 구매자 전용 보너스 평생 라이선스를 구매하시면 AI Zone Radar($59 상당) + 완전 PDF 매뉴얼을 무료로 드립니다. 제품 가격에 더해 $59 상당의 보너스가 따라옵니다. 구매 후 MQL5로 메시지를 보내주세요. AI Zone Radar: https://www.mql5.com/en/market/product/175834 골드 트레이더 커뮤니티에서 실제로 사용되며 정확성과
TrendMaestro5
Stefano Frisetti
note: this indicator is for METATRADER4, if you want the version for METATRADER5 this is the link:  https://www.mql5.com/it/market/product/108106 TRENDMAESTRO ver 2.5 TRENDMAESTRO recognizes a new TREND from the start, he never makes mistakes. The certainty of identifying a new TREND is priceless. DESCRIPTION TRENDMAESTRO identifies a new TREND in the bud, this indicator examines the volatility, volumes and momentum to identify the moment in which there is an explosion of one or more of these da
Crystal Heikin Ashi Signals
Muhammad Jawad Shabir
5 (4)
Crystal Heikin Ashi Signals - Professional Trend & Signal Detection Indicator Advanced Heikin Ashi Visualization with Intelligent Signal System for Manual & Automated Trading Final Price: $149 ---------> Price goes up $10 after every 10 sales . Limited slots available — act fast . Overview Crystal Heikin Ashi Signals is a professional-grade MetaTrader 5 indicator that combines pure Heikin Ashi candle visualization with an advanced momentum-shift detection system. Designed for both manual traders
Smc Pro ToolKit
Talal N Z Aljarusha
5 (10)
SMC PRO TOOLKIT — SMART MONEY ANALYSIS & STRUCTURED TRADE PLANNING SMC Pro ToolKit is a professional Smart Money Concepts analysis workspace for MetaTrader 5. It combines market structure, multi-timeframe analysis, institutional price zones, setup evaluation, confirmation tools, volume context, alerts, and risk planning inside one organized chart environment. One workspace. Multiple layers of confirmation. One structured trading plan. OPEN COMPLETE USER GUIDE MULTI-CONDITION SETUP ENGINE At
Reversion King Indicator
Eugen-alexandru Zibileanu
5 (6)
새로운 왕의 등장 - 인디케이터 + 주문 관리 표시(TP1 + TP2 + TP3) + 선택형 텔레그램 시그널 전송 기능 포함 (무료) (완전한 트레이딩 및 시그널 시스템) 골드를 위한 최고의 EA: Gold Slayer 이 인디케이터는 고급 전략, 사용자 지정 가능한 주문 관리 시스템, 그리고 엔벨로프 확장을 결합한 평균 회귀(mean reversion) 시스템을 포함하고 있습니다. 또한 RSI와 같은 여러 지능형 확인 필터를 통해 높은 확률의 반전 진입 구간을 포착하여 BUY 및 SELL 시그널을 제공합니다. 단순히 거래 방법만 배우는 것이 아니라, 여러 포지션을 효과적으로 관리하고 이전에 수익 중인 오픈 포지션으로 손실 거래를 커버하는 방법까지 익힐 수 있습니다. M5 전용으로 설계 및 최적화되었으며, 유동성이 풍부해 시그널이 더 깔끔하고 신뢰도 높은 BTCUSD와 XAUUSD에서 뛰어난 성능을 발휘합니다. 이 인디케이터는 ATR 기반으로 자동 계산된 진입가, 손절가, 익절가와
SR Liquidity MT5
Oleg Rodin
5 (2)
SR Liquidity 는 시장 유동성이 집중되고 가격이 가장 강력하게 반응하는 숨겨진 구간을 포착하도록 설계된 트레이딩 지표입니다. 이러한 특수 유동성 구간은 강력한 지지 및 저항선 역할을 하며, 시장 반전 가능성이 가장 높은 지점을 명확하게 보여주는 지도가 되어 줍니다. SR Liquidity는 일반적인 지지 및 저항선을 단순히 그리는 대신, 실제 가격 움직임을 분석하여 매수 및 매도 압력이 집중되는 구간을 포착합니다. 이러한 구간은 실질적인 시장의 흐름을 주도하는 유동성 풀(liquidity pools)에 해당합니다. 이 지표는 해당 구간을 차트에 직접 시각화하여, 가격 반응이 실제로 나타나기 전에 이를 미리 예측할 수 있도록 돕습니다. 즉, 가격 추세가 전환될 가능성을 사전에 파악하게 해주는 것입니다. 결과적으로 이 지표는 가공되지 않은 가격 움직임(price action)을 시장의 핵심 가격대, 다시 말해 추세 전환점이 될 수 있는 지점들을 보여주는 명확하고 실용적인 로드맵
Crystal Quantum Pro
Muhammad Jawad Shabir
5 (3)
CRYSTAL QUANTUM PRO Institutional Signal & Trade Intelligence for MetaTrader 5 Final Price: 199 USD ----> Price goes up 10 USD after every 10 sales. Limited launch slots available, act fast. Most indicators give you an arrow and leave you alone. A naked arrow is a gamble. Winning consistently requires CONFLUENCE , a clear STOP and TARGET , and honest PROOF that the system works. Crystal Quantum Pro delivers all three in one clean, no-repaint package. Crystal Quantum Pro is a complete decision sy
M1 Quantum MT5
Hamed Dehgani
4.27 (11)
M1 Quantum을 이용한 실시간 트레이딩 신호 : 신호   ( Quantum Trade Assistant 에 의해 거래가 자동으로 실행되며, 이 제품에 무료 로 포함되어 있습니다.) 최신 소식: 버전 1.64가 출시되었습니다. 이제 모든 거래에는 해당 지지/저항 구간 뒤에 Stop Loss가 설정됩니다. 또한 이번 버전에서는 EA의 성능을 향상시키기 위해 Smart Close 기능이 개선되었습니다. 8월 9일부터 라이브 신호는 버전 1.64로 운영되고 있습니다. 가격 계획: 현재 가격: $169 (얼리 어답터 혜택) 다음 예정 가격: $189 예정 소매 가격: $299 개발자 안내: 구매 후 저에게 연락하시면 최신 권장 설정 파일(Set File) , 사용 팁, 그리고 다른 M1 Quantum 사용자들과 소통할 수 있는 VIP 지원 그룹 초대장을 받으실 수 있습니다. 자주 묻는 질문 - 설정 파일 - 설치 가이드 M1 Quantum 은 M1 전용 전문 트레이딩 시스템으로, 손
필터:
리뷰 없음
리뷰 답변