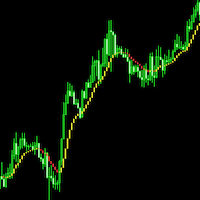
Precedent RSI
- 指标
- 版本: 1.0
- 激活: 5

Precedent RSI answers one question on every bar: when the market last looked
like this, what happened next. It turns each bar into an eight part momentum
fingerprint, searches settled history for the closest matches, and lets the
outcomes those matches actually produced decide the direction. Signals are
fixed at bar close and never move afterwards.
How It Works
Every bar is described by eight readings taken from RSI behaviour rather than
from the RSI level alone: value, slope, acceleration, distance from neutral,
percentile rank, dispersion, fast to slow spread, and regime structure. Each
reading is scaled so no single one can dominate the comparison.
Past bars enter a memory bank only after their outcome has settled, which takes
the full outcome horizon in bars. A bar is labelled bullish or bearish only if
price cleared a volatility scaled threshold, and anything inside that threshold
is discarded rather than stored as a weak example.
The current fingerprint is then compared against the bank using a compressed
distance measure, and the closest analogs vote on direction weighted by how
close they are. Because the bank can only ever contain outcomes that had
already finished, the indicator is non-repainting by construction rather than
by a setting you have to remember to switch on.
The Model Learns What Matters
Not every feature separates winners from losers in every market. Precedent RSI
measures how cleanly each of the eight features divided the bullish records
from the bearish ones inside its own memory bank, and reweights the comparison
accordingly. A feature that carries no directional information gets quieter, a
feature that separates well gets louder, and the weights blend rather than jump
so a single unusual stretch of market cannot throw the model around.
The current weights are printed live on the dashboard. You can see exactly what
the model is paying attention to instead of taking it on faith, and you can
switch the learning off and pin all eight weights by hand.
Two Scores, Both Must Clear
A poll tells you which way. It does not tell you whether the answer is worth
acting on, so that question gets its own number.
Setup Rank grades the situation: how one sided the vote was, how genuinely
similar the analogs were, whether the wider tape agrees, and whether volatility
is in a range where a move can travel. Model Confidence grades the conviction:
how lopsided the consensus was, whether the analogs clustered tightly or
straggled, and whether the read has been steady or is flickering.
A setup can rank well while the model is unsure, and the model can be certain
about a setup sitting in poor conditions. An arrow is printed only when both
clear their own floor and every enabled filter agrees.
Adaptive Trend Band
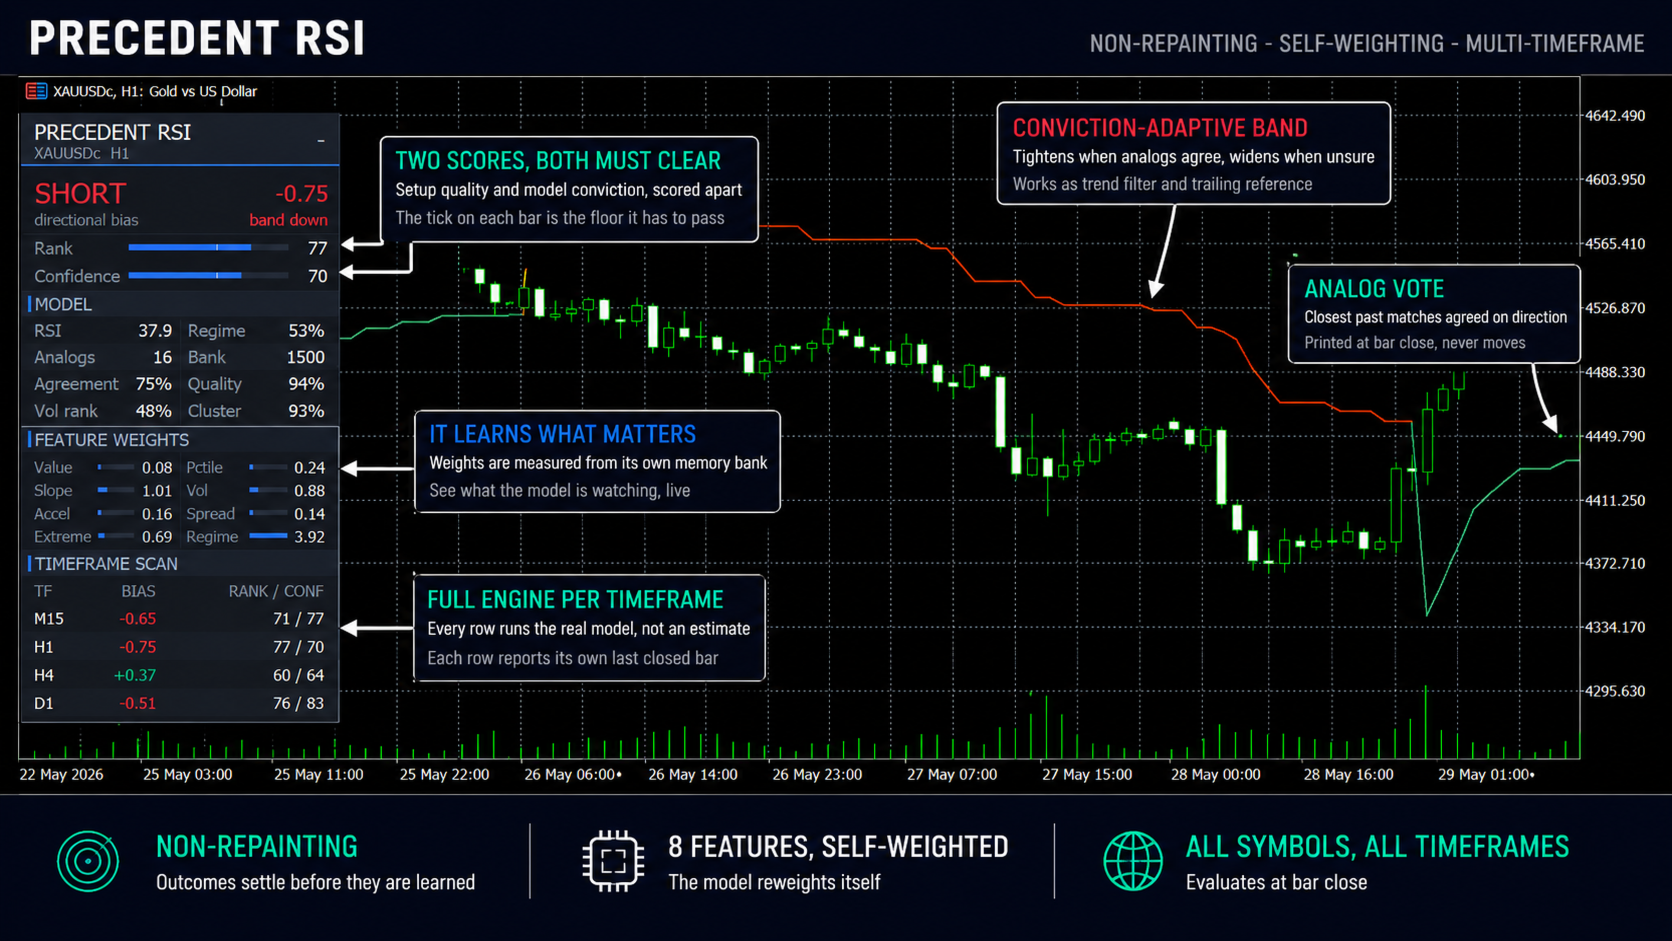
The band around price is an ATR channel whose width moves with model conviction.
When the analogs agree strongly the band draws in and the flip comes early,
because there is reason to believe the move. When conviction fades the band
widens and sits back, which is exactly the condition where a tight stop is worth
the least. It doubles as a trend filter and as a trailing reference.
Timeframe Scan
The dashboard carries a scan table of up to six timeframes. Each row runs the
full engine over rates from its own timeframe rather than approximating from
the current chart, so a row means the same thing the chart means. Rows report
the last closed bar of their own timeframe, so an H4 row does not flicker for
four hours. The row matching your chart timeframe is filled from the chart's own
reading, so the table can never contradict the headline above it.
Dashboard
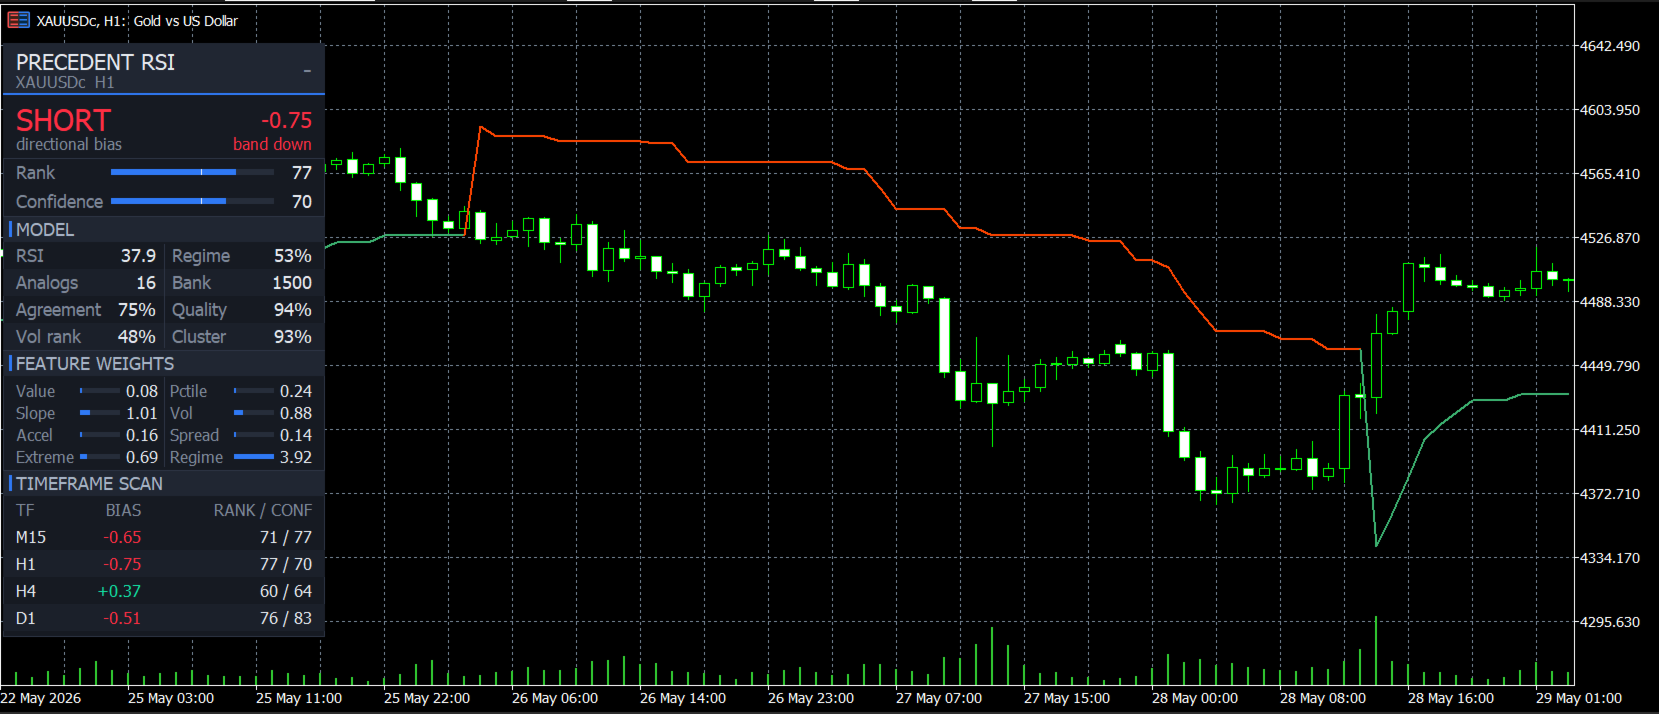
The panel reports the live RSI reading, directional bias, both scores against
their floors, how many analogs voted, how large the memory bank has grown,
agreement, similarity quality, analog clustering, volatility rank, regime
structure, and the eight learned weights. Drag it anywhere, collapse it to the
title bar, dock it to any of the four corners, and it remembers where you left
it across timeframe switches. Dark and light themes are included.
If the chart is too short to hold the whole panel, detail blocks are dropped in
order of least importance so the verdict, the two scores and the scan table stay
on screen, and the header says so rather than letting content fall off the edge.
Parameters
Core Engine
Price Source - PRICE_CLOSE
Base RSI Length - 14
Statistics Window - 100
Normalisation Window - 200
Analog Memory
Memory Depth - 1500 records
Outcome Horizon - 8 bars
Learning Sensitivity - 0.75 ATR
ATR Length For Outcomes - 14
Analog Count k - 16
Feature Weights
Auto-Optimize Weights - true
Adaptation Speed - 0.15
Bars Between Weight Updates - 25
Eight manual weights, used when auto is off
Signal Gates
Trade Direction - Both
Min Rank To Signal - 55
Min Confidence To Signal - 55
Trend Gate - true
Volatility Band Filter - true, 25 to 95
Chop Filter - true, threshold 8
Adaptive Trend Band
Band ATR Length - 10
Band ATR Multiplier - 3.0
Band Adaptivity To Conviction - 0.8
Display, Dashboard, Timeframe Scan, Alerts and Diagnostics groups control
presentation, the scan timeframes, popup and push alerts, and an optional log
of how many bars each gate passed.
Usage
Start with the defaults and watch the two scores rather than the arrows. The
gauges show each score against the floor it has to clear, so you can see which
gate is holding a signal back before you change anything. If you want more
signals, lower the score that is consistently short rather than lowering both.
Use the trend band as the context and the arrows as the trigger. The scan table
is there to tell you whether the higher timeframes are pointing the same way,
which is usually the difference between a trade that runs and one that stalls.
For tuning, switch on the gate breakdown log. It prints how many bars each
filter passed over the scored window, so the filter that is actually binding is
obvious instead of guessed at.
Directional bias, setup rank and model confidence are published as indicator
buffers, so an Expert Advisor can read all three through iCustom.
Compatibility
Any symbol and any timeframe. Signals evaluate at bar close only. The engine
runs once per closed bar rather than on every tick. Compiled X64 Regular.
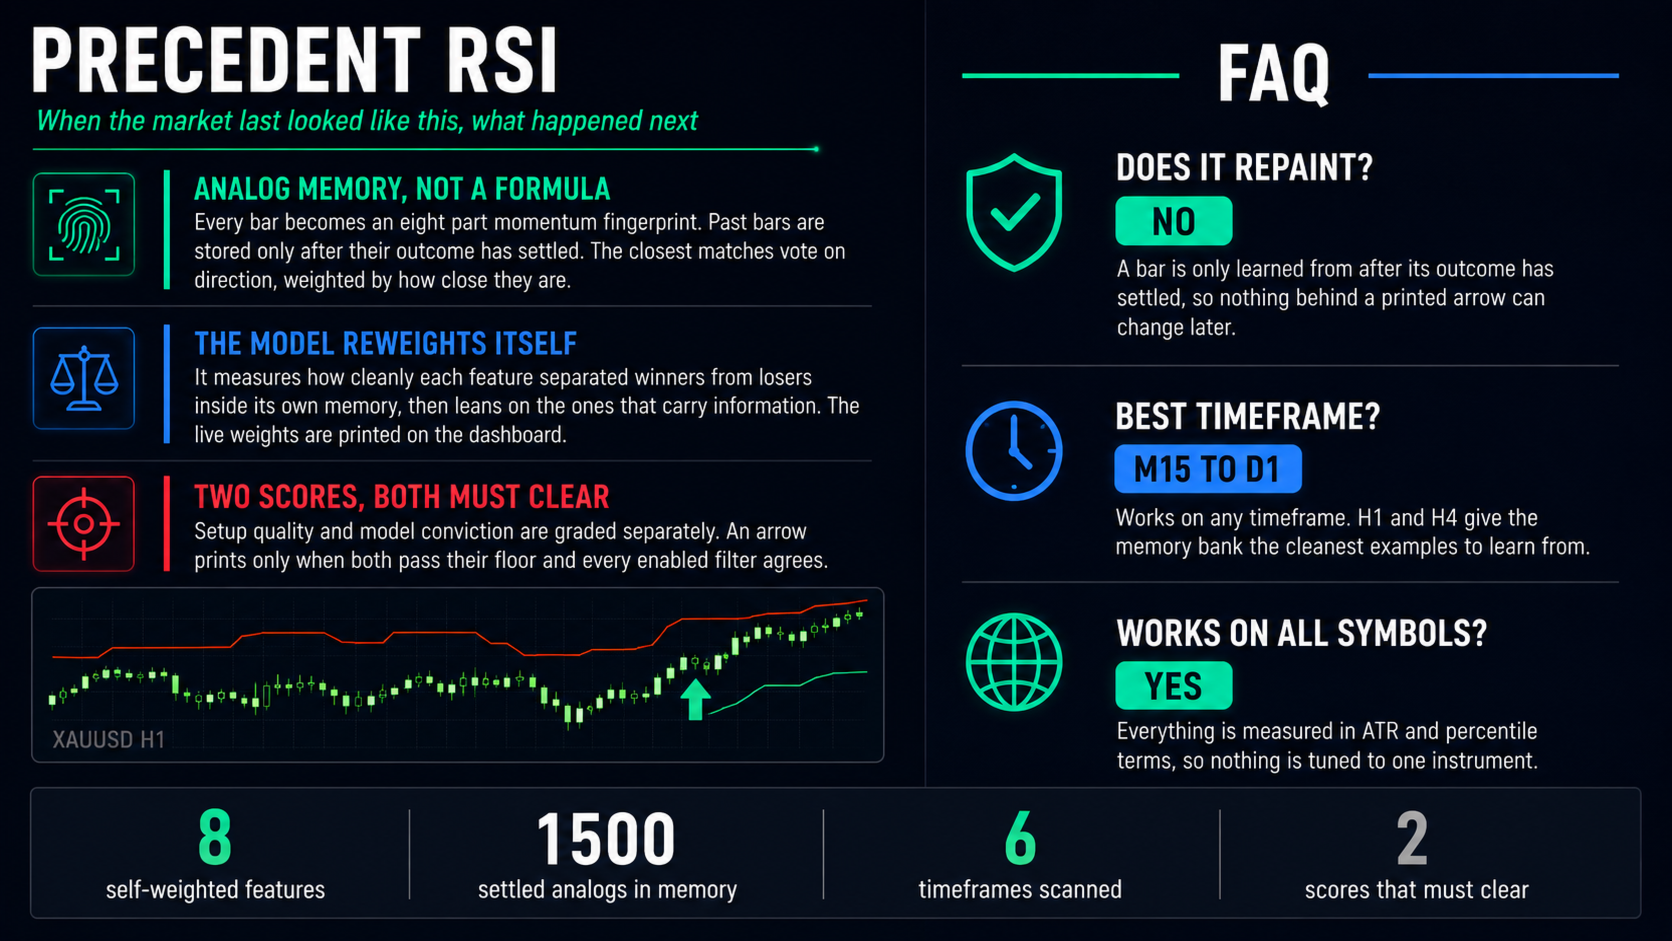
Does it repaint? No. A bar enters the memory bank only after its outcome has
settled, so nothing the classifier sees can change later, and a printed arrow
cannot move. Verify it yourself: note the arrows, switch timeframe away and
back, and compare.
Is it laggy? Evaluation happens at bar close, so a signal appears at the close
of the bar it belongs to. That is the cost of not repainting.
Support
For questions and support, please use the comments section of this product page
or contact the author through the MQL5 messaging system.