Precedent RSI

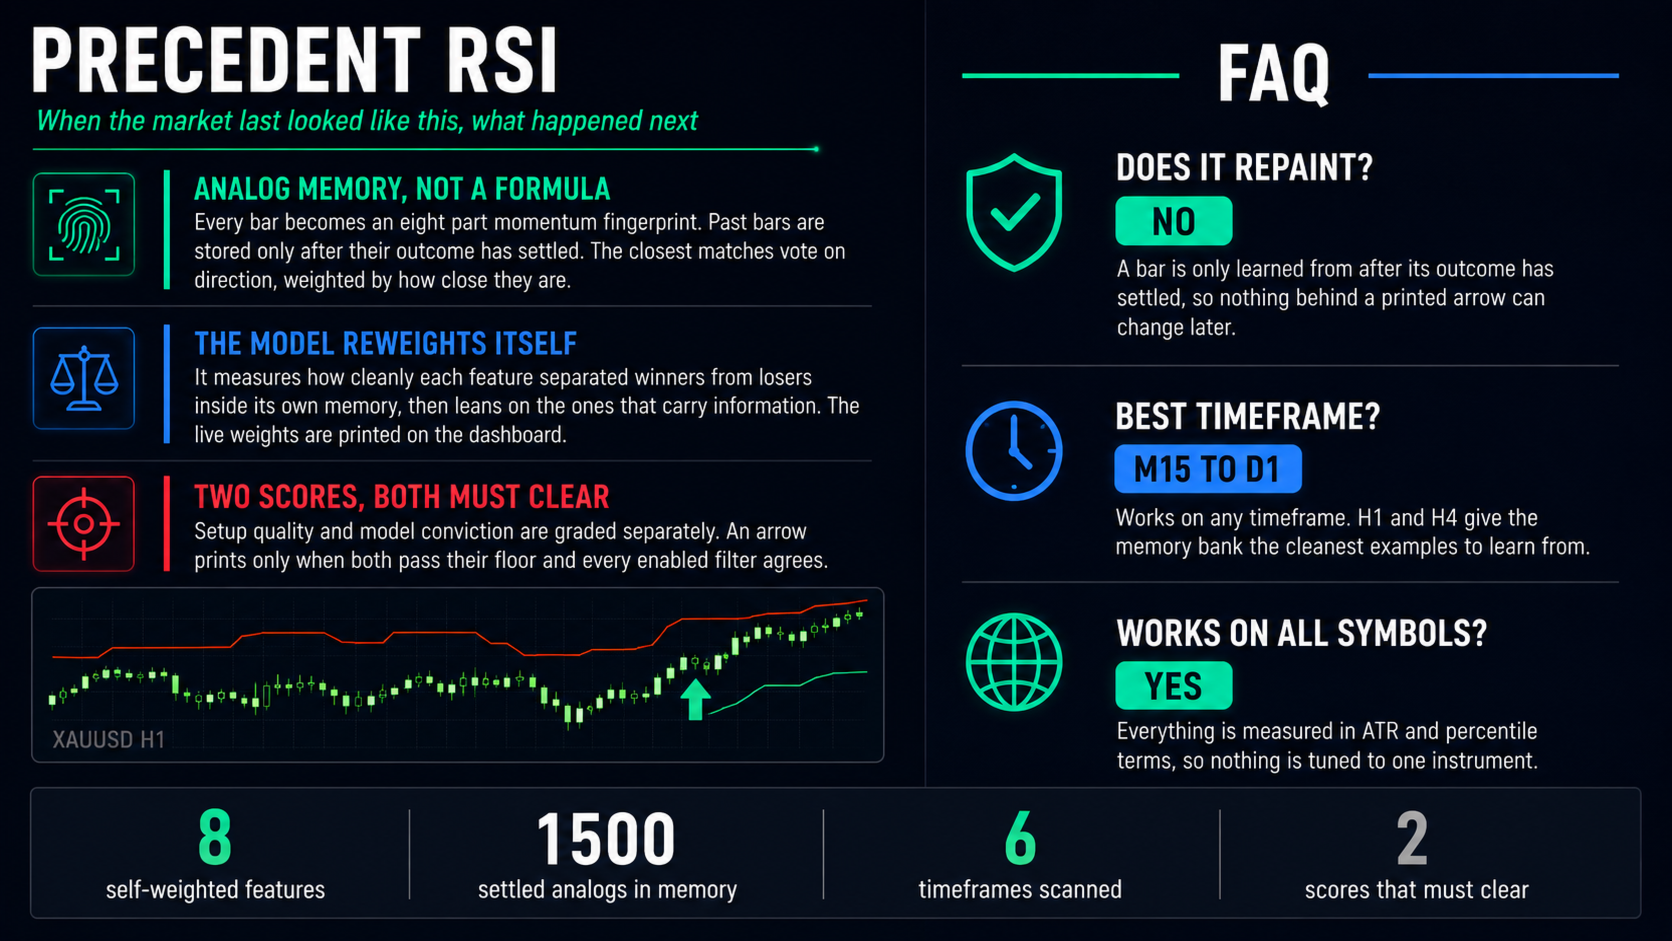
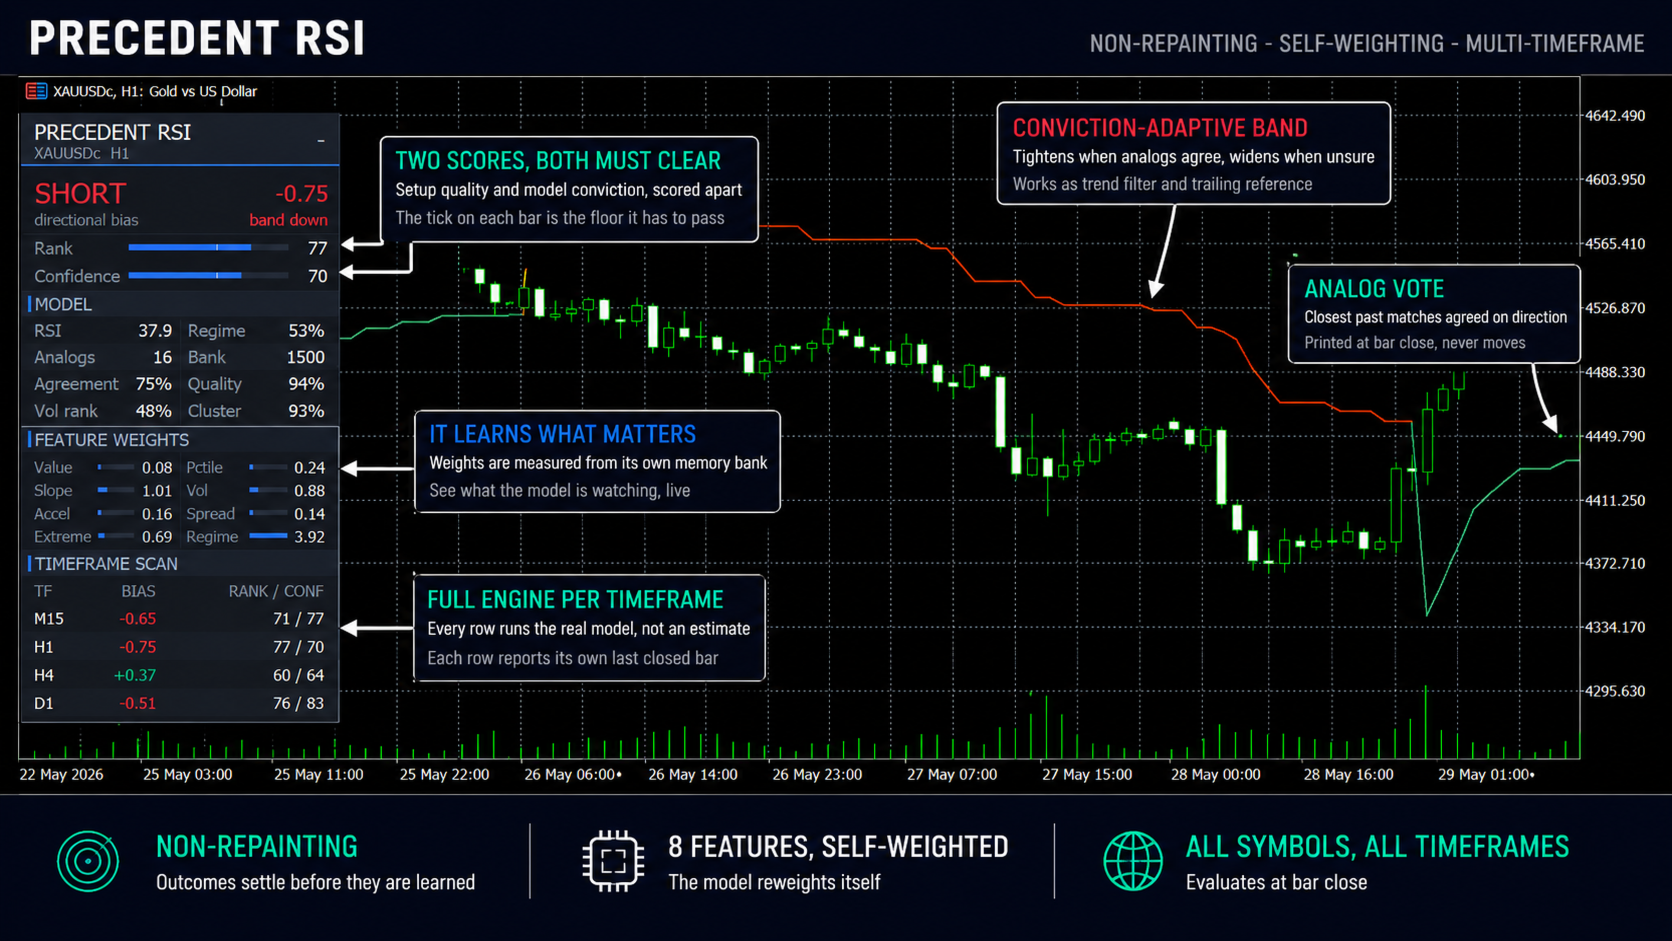
Precedent RSI answers one question on every bar: when the market last looked
like this, what happened next. It turns each bar into an eight part momentum
fingerprint, searches settled history for the closest matches, and lets the
outcomes those matches actually produced decide the direction. Signals are
fixed at bar close and never move afterwards.


How It Works

Every bar is described by eight readings taken from RSI behaviour rather than
from the RSI level alone: value, slope, acceleration, distance from neutral,
percentile rank, dispersion, fast to slow spread, and regime structure. Each
reading is scaled so no single one can dominate the comparison.

Past bars enter a memory bank only after their outcome has settled, which takes
the full outcome horizon in bars. A bar is labelled bullish or bearish only if
price cleared a volatility scaled threshold, and anything inside that threshold
is discarded rather than stored as a weak example.

The current fingerprint is then compared against the bank using a compressed
distance measure, and the closest analogs vote on direction weighted by how
close they are. Because the bank can only ever contain outcomes that had
already finished, the indicator is non-repainting by construction rather than
by a setting you have to remember to switch on.


The Model Learns What Matters

Not every feature separates winners from losers in every market. Precedent RSI
measures how cleanly each of the eight features divided the bullish records
from the bearish ones inside its own memory bank, and reweights the comparison
accordingly. A feature that carries no directional information gets quieter, a
feature that separates well gets louder, and the weights blend rather than jump
so a single unusual stretch of market cannot throw the model around.

The current weights are printed live on the dashboard. You can see exactly what
the model is paying attention to instead of taking it on faith, and you can
switch the learning off and pin all eight weights by hand.


Two Scores, Both Must Clear

A poll tells you which way. It does not tell you whether the answer is worth
acting on, so that question gets its own number.

Setup Rank grades the situation: how one sided the vote was, how genuinely
similar the analogs were, whether the wider tape agrees, and whether volatility
is in a range where a move can travel. Model Confidence grades the conviction:
how lopsided the consensus was, whether the analogs clustered tightly or
straggled, and whether the read has been steady or is flickering.

A setup can rank well while the model is unsure, and the model can be certain
about a setup sitting in poor conditions. An arrow is printed only when both
clear their own floor and every enabled filter agrees.


Adaptive Trend Band

The band around price is an ATR channel whose width moves with model conviction.
When the analogs agree strongly the band draws in and the flip comes early,
because there is reason to believe the move. When conviction fades the band
widens and sits back, which is exactly the condition where a tight stop is worth
the least. It doubles as a trend filter and as a trailing reference.


Timeframe Scan

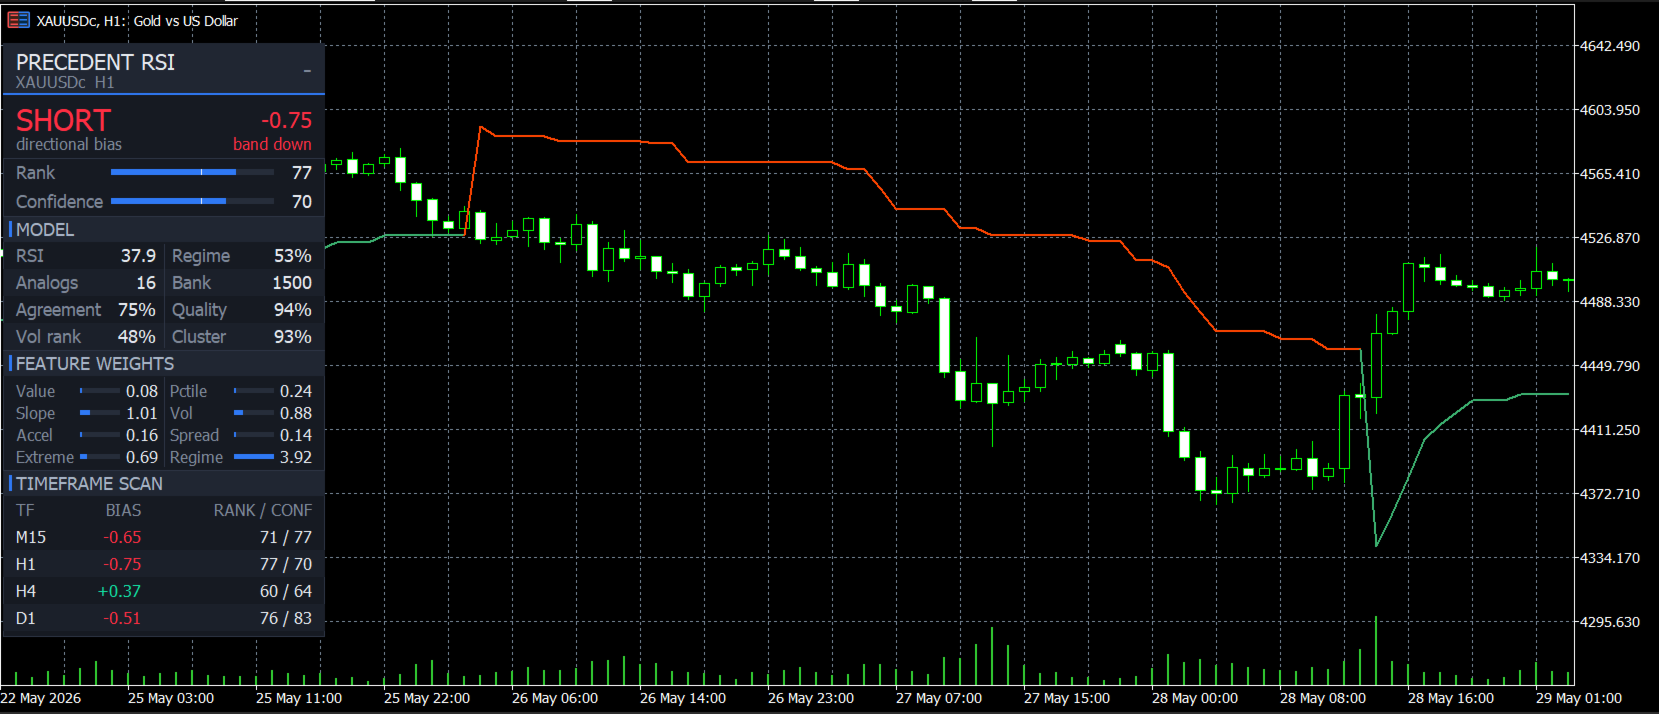
The dashboard carries a scan table of up to six timeframes. Each row runs the
full engine over rates from its own timeframe rather than approximating from
the current chart, so a row means the same thing the chart means. Rows report
the last closed bar of their own timeframe, so an H4 row does not flicker for
four hours. The row matching your chart timeframe is filled from the chart's own
reading, so the table can never contradict the headline above it.


Dashboard

The panel reports the live RSI reading, directional bias, both scores against
their floors, how many analogs voted, how large the memory bank has grown,
agreement, similarity quality, analog clustering, volatility rank, regime
structure, and the eight learned weights. Drag it anywhere, collapse it to the
title bar, dock it to any of the four corners, and it remembers where you left
it across timeframe switches. Dark and light themes are included.

If the chart is too short to hold the whole panel, detail blocks are dropped in
order of least importance so the verdict, the two scores and the scan table stay
on screen, and the header says so rather than letting content fall off the edge.


Parameters

Core Engine
  Price Source - PRICE_CLOSE
  Base RSI Length - 14
  Statistics Window - 100
  Normalisation Window - 200

Analog Memory
  Memory Depth - 1500 records
  Outcome Horizon - 8 bars
  Learning Sensitivity - 0.75 ATR
  ATR Length For Outcomes - 14
  Analog Count k - 16

Feature Weights
  Auto-Optimize Weights - true
  Adaptation Speed - 0.15
  Bars Between Weight Updates - 25
  Eight manual weights, used when auto is off

Signal Gates
  Trade Direction - Both
  Min Rank To Signal - 55
  Min Confidence To Signal - 55
  Trend Gate - true
  Volatility Band Filter - true, 25 to 95
  Chop Filter - true, threshold 8

Adaptive Trend Band
  Band ATR Length - 10
  Band ATR Multiplier - 3.0
  Band Adaptivity To Conviction - 0.8

Display, Dashboard, Timeframe Scan, Alerts and Diagnostics groups control
presentation, the scan timeframes, popup and push alerts, and an optional log
of how many bars each gate passed.


Usage

Start with the defaults and watch the two scores rather than the arrows. The
gauges show each score against the floor it has to clear, so you can see which
gate is holding a signal back before you change anything. If you want more
signals, lower the score that is consistently short rather than lowering both.

Use the trend band as the context and the arrows as the trigger. The scan table
is there to tell you whether the higher timeframes are pointing the same way,
which is usually the difference between a trade that runs and one that stalls.

For tuning, switch on the gate breakdown log. It prints how many bars each
filter passed over the scored window, so the filter that is actually binding is
obvious instead of guessed at.

Directional bias, setup rank and model confidence are published as indicator
buffers, so an Expert Advisor can read all three through iCustom.


Compatibility

Any symbol and any timeframe. Signals evaluate at bar close only. The engine
runs once per closed bar rather than on every tick. Compiled X64 Regular.

Does it repaint? No. A bar enters the memory bank only after its outcome has
settled, so nothing the classifier sees can change later, and a printed arrow
cannot move. Verify it yourself: note the arrows, switch timeframe away and
back, and compare.

Is it laggy? Evaluation happens at bar close, so a signal appears at the close
of the bar it belongs to. That is the cost of not repainting.


Support

For questions and support, please use the comments section of this product page
or contact the author through the MQL5 messaging system.
추천 제품
RubdFx Spike
Namu Makwembo
Rubdfx Spike Indicator 1.5: Updated for Strategic Trading The Rubdfx Spike Indicator is developed to aid traders in identifying potential market reversals and trends. It highlights spikes that indicate possible upward or downward movements, helping you observe when a trend may continue. A trend is identified when a buy or sell spike persists until the next opposite spike appears. Key Features: Versatility: Any Timeframe Adaptability: Designed   to work on all Timeframes however Recommended for
Trend Speaker 지표 는 실시간으로 시장 동향을 쉽게 추적하고 분석하려는 트레이더를 위해 설계된 강력한 도구입니다. 차트에서 명확하고 신뢰할 수 있는 매수 및 매도 신호를 제공하여 시장의 현재 추세를 매우 편리하게 평가할 수 있습니다. 사용자 친화적인 인터페이스를 갖춘 Trend Speaker는 잠재적인 거래 기회를 놓치지 않도록 도와주며, 정보에 기반한 결정을 내리고 거래 전략을 향상시키는 데 도움을 줍니다. 이 지표는 모든 매수 및 매도 신호에 대해 Stop Loss와 Take Profit을 표시합니다. 스크린샷에서: 초록색 점은 TP1에서 TP7까지의 Take Profit을 나타냅니다 빨간색 점은 Stop Loss를 나타냅니다. 사용법: 모든 시간대에서 실행할 수 있습니다. 매수 및 매도 화살표의 색상과 두께를 쉽게 변경할 수 있습니다. 이 지표를 사용하는 것은 매우 간단하고 쉽습니다. 편안하게 앉아 있고 모든 것이 잘 될 것입니다. 속성을 변경하여 TP와 SL을 쉽게
CChart
Rong Bin Su
Overview In the fast-paced world of forex and financial markets, quick reactions and precise decision-making are crucial. However, the standard MetaTrader 5 terminal only supports a minimum of 1-minute charts, limiting traders' sensitivity to market fluctuations. To address this issue, we introduce the Second-Level Chart Candlestick Indicator , allowing you to effortlessly view and analyze market dynamics from 1 second to 30 seconds on a sub-chart. Key Features Support for Multiple Second-Level
Kill Zones MT5
Diego Arribas Lopez
MT4 Version Kill Zones Kill Zones allows you to insert up to 3 time zones in the chart. The visual representation of the Kill Zones in the chart together with an alert and notification system helps you to ignore fake trading setups occurring outside the Kill Zones or specific trading sessions. Using Kill Zones in your trading will help you filter higher probability trading setups. You should select time ranges where   the market   usually reacts with high volatility. Based on   EST time zone, fo
DoIt EA Monitor - Multi EA Performance Dashboard for MT5 Your account can be profitable while one EA quietly drags down the portfolio. MetaTrader history shows the combined result, but it does not clearly show which strategy deserves more capital and which one needs attention. DoIt EA Monitor runs on one chart and separates live and historical performance by magic number, EA and symbol. It is completely read-only. It never opens, closes or modifies a trade. KNOW WHICH EA IS EARNING ITS PLACE Aut
FREE
Aussenstab Markttechnik
Alexander Josef Zeidler
This indicator shows external bars ("Aussenstäbe") in the chart in candle form. The colors of the candles can be set individually. Also different colors for bearish and bullish bars are possible. In addition, the color of the wicks or outlines is also adjustable. Outside bars are mentioned e.g. by Michael Voigt in the book "Das große Buch der Markttechnik". All other candles are inner bars.
통화 강도 측정기는 현재 어떤 통화가 강하고 어떤 통화가 약한지에 대한 빠른 시각적 가이드를 제공합니다. 미터는 모든 외환 교차 쌍의 강도를 측정하고 계산을 적용하여 각 개별 통화의 전체 강도를 결정합니다. 우리는 28 쌍의 추세를 기반으로 통화의 강도를 기반으로 계산합니다. MQL5 블로그에 액세스하여 표시기의 무료 버전을 다운로드할 수 있습니다. Metatrader 테스터 제한 없이 구매하기 전에 시도하십시오.   여기를 클릭하십시오. 1. 문서 모든 추세 통화 강도 문서( 지침 ) 및 전략 세부 정보는 MQL5 블로그의 이 게시물에서 볼 수 있습니다.   여기를 클릭하십시오. 2. 연락처 질문이 있거나 도움이 필요하면 비공개 메시지를 통해 저에게 연락하십시오. 3. 저자 SAYADI ACHREF, 핀테크 소프트웨어 엔지니어이자 Finansya 설립자.
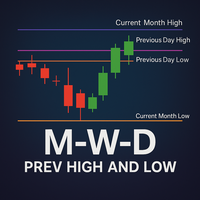
한눈에 분석을 강화하세요! 이 인디케이터는 가격이 최근 반등하거나 돌파한 주요 레벨을 자동으로 표시하여, 수동으로 그릴 필요 없이 지원 및 저항 구역을 보여줍니다. 차트에 추가하기만 하면 각 기간의 이전 최고가 및 최저가 라인이 나타납니다. 각 라인의 의미 Previous Month High ‣ 이전 달 최고가: 지난 월간 기간 동안 기록된 최고 가격. Previous Month Low ‣ 이전 달 최저가: 지난 월간 기간 동안 기록된 최저 가격. Previous Week High ‣ 이전 주 최고가: 지난 주간 기간 동안 기록된 최고 가격. Previous Week Low ‣ 이전 주 최저가: 지난 주간 기간 동안 기록된 최저 가격. Previous Day High ‣ 이전 일 최고가: 직전 거래일의 최고 가격. Previous Day Low ‣ 이전 일 최저가: 직전 거래일의 최저 가격. 사용 이유 차트를 열자마자 반등 과 돌파 를 포착. 검증된 구역에서 이익실현 (T
TrendCue Core
Mohammadreza Faghanimakrani
Trade with a clearer chart and a defined exit plan. TrendCue Core gives clear BUY and SELL signals after the candle closes, helping you read the chart and manage each setup more easily. SPECIAL BONUS: After purchasing TrendCue Core, leave a comment on the product page or send me a private message to receive the TrendCue Scanner bonus. When a setup qualifies, Core shows a fixed Entry and three targets: TP1, TP2 and TP3. The exit plan is simple: price can reach the predefined targets, or the
Trillion Pips Pro MT5
Sivaramakrishnan Natarajan
TRILLION PIPS ELITE PRO INDICATOR Advanced Wave-Based Auto Trend System Built with 12+ Years of Real Market Experience, this is not just an indicator — it is a complete market intelligence system designed to help traders identify key levels, understand auto trend direction, and read market movement with confidence. UNIQUE POWER OF THIS INDICATOR Proprietary Strategy – Only from Trillion Pips Advanced Wave-Based Market Structure Engine Auto Trend Detection System Built-in Trend Decider Log
Classic Divergence Pro
Syamsurizal Dimjati
Adaptive RSI-OsMA-STO   is an advanced market intelligence tool designed to detect price momentum and high-probability reversal points with absolute precision. By unifying three of the market's most powerful oscillators, this indicator provides dynamic divergence visualization without cluttering your chart workspace. Key Features Triple-Oscillator Confluence:   Seamlessly combines Adaptive RSI, Stochastic, and OsMA into a single integrated panel. This system filters out false signals by cross-re
CURRENCYPOWER NAVIGATOR MT5 Currency Strength Ranking Dashboard TAGLINE See the strongest and weakest currencies before choosing the pair. PRODUCT OVERVIEW CurrencyPower Navigator MT5 is a currency-strength indicator for MetaTrader 5. Instead of focusing on one chart only, it evaluates a basket of major Forex pairs and estimates the relative strength of individual currencies. The indicator then ranks the main currencies and helps identify stronger-versus-weaker combinations that may offer
FREE
SSL Channel MT5
Steven Mccutcheon Roberton
Boost your trading accuracy with the SSL Channel Indicator , designed to identify trends and precise entry points. This dynamic tool adapts to all trading instruments and timeframes. Perfect for scalpers, day traders, and swing traders, the SSL Channel Indicator simplifies market analysis, helping you trade confidently and effectively. Unlock your trading potential today! MT4 Link-  https://www.mql5.com/en/market/product/127493
OnScreen Calendar
Edwin Kipchirchir
Onscreen Calendar uses the Metatrader calendar events and displays them automatically right on the screen within the range of days of your choice. With many factors influencing every trade, it is easy to lose sight of what truly moves the market, so having the calendar visible at all times can greatly help. You will also save a lot of time understanding how different types of news, such as moderate impact news, affect the market.  You have total control of the content to display on your screen.
Trend Strength Visualizer
Alexander Denisovich Jegorov
Trend Strength Visualizer A Simple Tool for Trend Analysis This indicator helps you quickly assess the strength of market trends using fast and slow moving averages. It’s designed to give you a clear visual representation of the trend, so you can make better trading decisions. ~Displays: Green Line : Strong uptrend (potential buying opportunities). Red Line : Strong downtrend (potential selling opportunities). ~Values That Can Be Changed: Fast MA period. Slow MA period. Line color for uptrend an
​AlphaPulse Quant (Momentum Pulse Reversal System) ​ Strategy Overview ​AlphaPulse Quant is an intelligent quantitative trading system meticulously engineered to capture institutional market sweeps and extreme overbought/oversold inflection points. Rejecting the lagging nature of traditional trend-following indicators, the strategy utilizes a proprietary multi-dimensional momentum pulse algorithm to execute counter-trend deployments just as trends exhaust and retail market sentiment reaches F
Flow Matrix Supply Demand
Francesc Jordi Mallol Nolden
FZ-100 Flow Matrix — Structural Supply & Demand Intelligence Most supply and demand indicators stop at drawing rectangles. FZ-100 Flow Matrix goes further by transforming market structure into a complete decision framework. It identifies the origin of institutional-style displacement, confirms the resulting zone, evaluates its quality, monitors the retest, validates the reaction, and generates a structured risk map—all directly on your MetaTrader 5 chart. FZ-100 is designed for traders who want
Volume Bar POC 인디케이터 는 틱 거래량을 기반으로 주요 가격 수준(Point of Control, POC)을 정확하게 시각화할 수 있는 혁신적인 도구입니다. 이 인디케이터는 각 캔들 내의 모든 가격 포인트를 분석하여 가장 중요한 가격 수준을 표시하며, 강력한 지지 및 저항 영역으로 활용할 수 있습니다. 데이 트레이딩 및 장기 거래 전략에 이상적입니다. Volume Bar POC 인디케이터는 어떻게 작동합니까? 이 인디케이터는 각 캔들이 형성되는 동안 POC를 계산하기 위해 고급 프로세스를 사용합니다: 캔들이 열릴 때 테이블 생성 : 새 캔들이 열리면 인디케이터는 다음 데이터를 포함하는 내부 테이블을 생성합니다: 가격 : 캔들의 Low와 High 사이의 모든 가격 수준. 거래량 : 각 가격 수준에서 발생한 틱 수(틱 거래량). 테이블은 캔들 범위 내의 모든 가격 포인트를 동적으로 포함합니다. 캔들이 형성되는 동안 테이블 업데이트 : High와 Low 값이 변할 때마다 새로
Zonar Smart Analysis
Elvin Entero Tomolin
**Zonar Smart Analysis** is a complete "Smart Money" trading system designed for MetaTrader 5. It automates the classic **Opening Range Breakout (ORB)** strategy while filtering false signals using advanced Price Action algorithms (Wick Rejection & Swing Analysis). Stop guessing where the session is going. Let Zonar draw the zones, identify the breakout, and highlight institutional Order Blocks for maximum confluence. ### Key Features * **Automated ORB Box:** Automatically detects the Market
E2C Lines
Eduardo Cristian De Carvalho
Descubra o poder do nosso indicador de alta precisão, projetado para identificar as regiões de alvo e exaustão de qualquer ativo. Testado e validado por mais de 3 anos nos mercados de mini dólar e mini índice, ele oferece confiabilidade e eficácia incomparáveis. Transforme sua estratégia de trading e alcance novos patamares de sucesso com nossa ferramenta inovadora.
Market Ticker Pro MT5
John Louis Fernando Diamante
The only Market Ticker on the market! Add a professional novelty to your workspace, with built in mini-charts A scrolling Market Ticker that displays price changes from all symbols in the Market Watch list. Provides an easy snapshot of symbol prices, and keeps scrolling automatically while you trade and analyse the chart. The ticker color (+/- price changes) are based on either the current or completed candle, and the previous candle. Options include: - MTF, eg choose to show price changes of t
Previous Candle Levels MT5
Wachinou Lionnel Pyrrhus Sovi Guidi
1 (1)
Previous Candle Levels MT5 shows the previous candle levels, it shows the previous candle Open High Low Close levels (OHLC Levels) in different time frame. It's designed to help the trader to analyse the market and pay attention to the previous candle levels in different time frame.  We all know that the OHLC Levels in Monthly, Weekly and Daily are really strong and must of the time, the price strongly reacts at those levels. In the technical analysis, the user can use them as a support and res
FREE
ShortBS
Yan Qi Zhu
ShortBS是一个很好的短线交易指示器,能很好与 BestPointOfInitiation ( https://www.mql5.com/zh/market/product/96671 )配合,能让你找到最合适的buy和sell位置,指标不含有未来函数,不会重新绘制。是一个针对(如果你感觉到这个指标能够帮助你进行更准确的交易,请帮忙给个好评,希望我的作品能够帮助更多有需要的人) ===================参数列表===================== maPeriod: 25 slowPeriod:20 fastPeriod:10 stepPeriod:5 =================参考使用方法=================== 此指标可以适用于任何交易品种,能够用在任何周期。
The   Auric Pulse Indicator   is a powerful MetaTrader 5 (MT5) tool designed to identify trends (uptrend, downtrend, and consolidation) in financial markets. It is particularly effective for trading   Gold (XAUUSD)   due to its sensitivity adjustments and multi-timeframe capabilities.  Indicator Overview The indicator provides: Three trend states   (color-coded): Green   = Uptrend (strong bullish momentum) Red   = Downtrend (strong bearish momentum) Yellow   = Consolidation (sideways market) Mul
Supply and Demand Zones MT5
Peter Mueller
4.86 (21)
The Supply and Demand Zone Indicator is a powerful and easy-to-use tool designed to help traders identify critical supply and demand zones on the chart. These zones can provide valuable insight into potential market reversals, breakouts, and important price levels where buyers or sellers are likely to take control. The best   FREE Trade Manager . If you want to create your own Hedging or Grid strategies without any coding make sure to check out the   ManHedger Key Features: Automatic Zone Detect
FREE
Equity Pulse MT5 Real-time equity, drawdown, and portfolio performance tracking in one clean trading panel. Equity Pulse MT5 is a practical account-monitoring indicator for MetaTrader 5. It helps traders see exactly where they stand across today, yesterday, recent days, the current week, month, and year. Instead of checking account history manually or relying only on the terminal’s floating profit number, Equity Pulse gives you a clear performance snapshot directly on the chart. It is designed
Multiple Positions
Emanuel Reynard Phillips
한 번에 여러 포지션/거래를 열어야 합니까? 우리는 귀하의 쉬운 솔루션을 만들었습니다. 이제 한 번에 여러 직위를 입력할 수 있습니다. 로트 크기, 포지션 수, 이익 실현 및 손실 중지를 설정할 수 있습니다. 예: 특정 로트 규모로 3, 5, 10 또는 원하는 수의 포지션을 구매하려고 합니다. 이제 "구매" 버튼을 탭하기만 하면 됩니다. 또는 예: 특정 로트 규모로 3, 5, 10 또는 원하는 수의 포지션을 판매하려고 합니다. 간단히 "판매" 버튼을 클릭하시면 됩니다. han beon-e yeoleo pojisyeon/geolaeleul yeol-eoya habnikka? ulineun gwihaui swiun sollusyeon-eul mandeul-eossseubnida. ije han beon-e yeoleo jig-wileul iblyeoghal su issseubnida. loteu keugi, pojisyeon su, iig silhyeon mich sonsil jung
MT5 Rectangle Extender Indicator
Muhammad Shamsuddeen Muhammad
MT5 Rectangle Extender Indicator is a simple and easy tool that automatically extends any box/rectangle drawn on the chart to the right edge of the screen.  This tool can be used for easy drawing of zones and can help with determining future areas of interest on the chart once price trades back to those levels. Very suitable for supply and demand, order blocks, POI's (Points of Interest) mapping on charts. Sometimes its better to have a zone than a single price level as price can shoot above or
Tired of information overload when analyzing forex currency strength? Introducing "All Currency Strength Live", the ultimate dashboard indicator for MetaTrader 5 that simplifies your trading life. This innovative tool provides a clear, concise overview of the strength of all major currencies, empowering you to make informed trading decisions with ease. With "All Currency Strength Live,"  you gain access to real-time insights into both price and volume strength across all major currencies. No mor
Onion
Nadiya Mirosh
The Onion Trend Indicator is a revolutionary trend trading and market data filtering solution that combines all the important features of a trend tool in one tool! It is great for any trader, be it Forex or binary options. No settings are required, everything is optimized by time and experience, it works effectively both in flat conditions and in trend conditions. The Onion Trend Indicator is a technical analysis tool for financial markets that reflects current deviations in the price of stock
이 제품의 구매자들이 또한 구매함
SMART TREND TRADING SYSTEM — 특별 혜택 트레이딩 시스템, 자동매매 EA, 교육과 지원을 하나로. MT5용 Smart Trend Trading System을 99 USD에 구매하고, 시스템의 신호를 자동매매에 활용할 수 있는 Smart Universal Expert Advisor를 무료로 받으세요 . STTS는 추세 방향, 진입·청산 신호, 반전 구간, 주요 가격 수준을 차트에 모아 보여줍니다. 시스템을 참고해 수동으로 거래하거나, 포함된 EA를 연결하여 선택한 설정에 따라 자동으로 거래를 실행할 수 있습니다. 현재 가격인 99 USD는 앞으로 이루어지는 30건의 구매에 적용됩니다. 이후 가격은 149 USD로 인상됩니다. 전체 패키지 구성 구매 시 다음 항목이 포함됩니다. • MT5용 Smart Trend Trading System. • Smart Universal Expert Advisor — 무료. • 전체 STTS PDF 사용자 설명서. • STTS
Trend Sniper X
Sarvarbek Abduvoxobov
4.9 (39)
Trend Sniper X 는 트레이더가 추세 방향과 잠재적 반전 지점을 명확하고 정확하게 포착할 수 있도록 도와주는 MetaTrader 5용 멀티 타임프레임 추세 추종 지표입니다. MT4용: https://www.mql5.com/en/market/product/193245 가격 정보: 현재 가격은 프로모션 할인가이며, 향후 업데이트 및 새로운 기능이 출시됨에 따라 변동될 수 있습니다. 보너스 혜택: 본 지표 전용 무료 자동매매 Assistant EA를 받으시려면 구매 후 작성자에게 메시지를 보내주시기 바랍니다. Code2Profit 채널 멀티 타임프레임 분석으로 시장을 마스터하세요! Trend Sniper X로 승률을 극대화하는 방법: 핵심 규칙 및 세션 팁 기술 사양 플랫폼 MetaTrader 5 지표 유형 멀티 타임프레임 추세 지표 운용 타임프레임 모든 차트 타임프레임 지원, 독립적으로 선택 가능한 상위 타임프레임(M1–MN1) 주요 상품 외환, 금(XAUUSD) 및 기타 C
Neuro Poseidon MT5
Daria Rezueva
4.75 (52)
Neuro Poseidon is a new indicator by Daria Rezueva. It combines precise trading signals with adaptive TP/SL levels - creating best possible trades as a result! Message me and get  Neuro Poseidon Assistant  as a gift to automize your trading process! What makes it stand out? 1. Proven profitability on all assets and timeframes 2. Only confirmed BUY and SELL signals present on the chart 3. Adaptive TP & SL levels generated by the software for each trade 4. Easy to understand - suitable for al
M1 Sniper MT5
Oleg Rodin
5 (7)
M1 SNIPER 는 사용하기 쉬운 거래 지표 시스템입니다. M1 시간대에 맞춰 설계된 화살표 지표입니다. 이 지표는 M1 시간대 스캘핑을 위한 단독 시스템으로 사용할 수 있으며, 기존 거래 시스템의 일부로도 사용할 수 있습니다. 이 거래 시스템은 M1 시간대 거래용으로 특별히 설계되었지만, 다른 시간대에도 사용할 수 있습니다. 원래는 XAUUSD와 BTCUSD 거래를 위해 이 방법을 설계했지만, 다른 시장 거래에도 유용하다는 것을 알게 되었습니다. 이 지표의 신호는 추세 방향과 반대로 거래될 수 있습니다. 저는 지표의 신호를 활용하여 양방향으로 거래할 수 있도록 돕는 특별한 거래 기법을 알려드립니다. 이 방법은 특별한 동적 지지선과 저항선 가격 영역을 활용하는 것을 기반으로 합니다. 구매하시면 M1 SNIPER 화살표 지표를 바로 다운로드하실 수 있습니다. 또한, 아래 스크린샷에 표시된 Apollo Dynamic SR 지표는 M1 SNIPER 도구를 사용하는 모든 사용자에게 무료로
SuperScalp Pro
Van Minh Nguyen
4.65 (34)
SuperScalp Pro - Professional Multi-Layer Confluence Scalping System SuperScalp Pro는 클래식 Supertrend에 여러 지능형 확인 필터를 추가한 고급 스캘핑 지표입니다. 더 높은 확률의 Buy/Sell 거래 기회를 식별하는 데 도움을 주며, 잘못된 신호를 크게 줄이는 데 도움을 줍니다. 명확한 Buy 및 Sell 화살표가 차트에 직접 표시되며, ATR 기반 Stop Loss 및 Take Profit 수준이 실시간으로 자동 계산됩니다. 구매 후 설정 방법 및 권장 구성에 대한 안내가 필요하시면 저에게 문의해 주세요. SuperScalp Pro Auto Trader를 사용하여 신호를 쉽게 자동화할 수 있습니다: [Auto Trader] 권장 설정 파일 다운로드: [Set File] 전체 문서는 제품 블로그에서 확인할 수 있습니다: [User Guide] 업데이트를 확인하려면 공식 채널에 참여하세요: [Official C
Zoryk Gold
Reda El Koutbane
5 (12)
ZORYK — MetaTrader 5용 XAUUSD 전문 신호 및 트레이드 플래닝 시스템 이런 경험이 있을 것입니다. 골드를 분석하고 진입을 기다린 뒤 마침내 포지션을 열었지만 가격이 곧바로 반대 방향으로 움직입니다. 너무 일찍 청산하거나 Stop Loss를 옮기거나 몇 초 동안 망설입니다. 그 후 시장은 내가 없이도 처음 예상했던 목표까지 정확히 움직입니다. 문제는 항상 방향이 아니었습니다. 진짜 문제는 불확실성이었습니다. 정확한 진입 위치를 몰랐습니다. 어느 지점에서 원래의 트레이드 아이디어가 무효가 되는지 몰랐습니다. 가까운 수익을 확보해야 할지 더 큰 움직임을 기다려야 할지 판단하기 어려웠습니다. 현재 setup이 정말 강한지 아니면 단지 새로운 거래를 억지로 찾고 있는지도 확신하기 어려웠습니다. 골드는 매우 빠르게 움직입니다. 명확한 계획이 없다면 좋은 분석도 몇 초 만에 나쁜 결정으로 바뀔 수 있습니다. ZORYK는 이 문제를 해결하기 위해 개발되었습니다.
Gann Made Easy MT5
Oleg Rodin
5 (10)
Gann Made Easy 는 mr.의 이론을 사용하여 최고의 거래 원칙을 기반으로 하는 전문적이고 사용하기 쉬운 Forex 거래 시스템입니다. W.D. 간. 이 표시기는 Stop Loss 및 Take Profit Levels를 포함하여 정확한 BUY 및 SELL 신호를 제공합니다. PUSH 알림을 사용하여 이동 중에도 거래할 수 있습니다. 구매 후 거래 방법 안내 및 유용한 추가 지표를 무료로 받으시려면 저에게 연락주세요! 아마도 Gann 거래 방법에 대해 이미 여러 번 들었을 것입니다. 일반적으로 Gann의 이론은 초보자 거래자뿐만 아니라 이미 거래 경험이 있는 사람들에게도 매우 복잡한 것입니다. Gann의 거래 방식은 이론적으로 적용하기 쉽지 않기 때문입니다. 나는 그 지식을 연마하고 Forex 지표에 최고의 원칙을 적용하기 위해 몇 년을 보냈습니다. 표시기는 적용하기가 매우 쉽습니다. 차트에 첨부하고 간단한 거래 권장 사항을 따르기만 하면 됩니다. 지표는 지속적으로 시장 분석
SMC Intraday Formula
Kareem Abbas
5 (25)
먼저 솔직하게 말하겠습니다. 어떤 인디케이터도 단독으로 당신을 수익성 있게 만들어주지 않습니다. 누군가 그렇게 말한다면, 그는 당신에게 꿈을 파는 것입니다. 완벽한 매수/매도 화살표를 보여주는 모든 인디케이터는 완벽하게 보이도록 만들 수 있습니다 — 단지 올바른 과거 구간을 확대하고 승리한 거래만 캡처하면 됩니다. 우리는 그렇게 하지 않습니다.  SMC Intraday Formula는 도구입니다. 시장 구조를 읽고, 가장 높은 확률의 가격 구간을 표시하며, 현재 스마트 머니의 흐름이 어떻게 보이는지 아주 단순한 언어로 보여줍니다. 최종 결정은 여전히 당신이 합니다. 실행도 당신이 합니다. 하지만 이제는 희망이 아니라 정확성으로 거래하게 됩니다. 우리는 이 인디케이터를 지난 약 3년 동안 골드(XAUUSD) 및 주요 외환 통화쌍의 데이 트레이딩 스캘핑에 사용해 왔습니다. M1, M5, M15, M30에서 우리의 핵심 도구입니다. 이 도구는 미래를 예측하려 하지 않습니다 — 지금 형성
GoldenX Entry MT5
Kareem Abbas
5 (16)
GoldenX Entry는 MT5용 인디케이터로, 적응형 Smart Entry Trend 알고리즘, 신호 스코어링 시스템, 시장 레짐 감지 기능, 그리고 변동성 필터를 포함합니다. 각 신호에는 계산된 진입 레벨, 3개의 익절(TP1, TP2, TP3) 레벨, 그리고 손절(Stop-Loss) 레벨이 포함됩니다. 이 인디케이터는 다양한 시장 환경에 적응하도록 설계된 다중 분석 레이어 구조 위에 구축되어 있으며, 내장 최적화기와 통계 추적 시스템을 결합합니다. 또한 Risk-to-Reward(RR) 지표와 과거 거래 행동 기반의 정량 분석을 제공합니다. 시작은 간단합니다 — 선택한 타임프레임에서 최적화기를 실행한 뒤 차트에서 바로 인디케이터를 사용하면 됩니다. 핵심 기능 GoldenX Entry는 하나의 차트에서 신호 엔진, 트레이드 관리 기능, 그리고 과거 통계 추적을 통합합니다: - 내장 최적화기: 최적화기는 차트에서 원클릭으로 실행됩니다. 200개의 파라미터 조합을 두 단계 탐색
Unix Scalper
Issam Kassas
4 (4)
UNIX SCALPER — 특별 혜택 매매 기회를 찾고, 거래 계획을 확인하고, 실행 방법을 선택하세요. MT5용 UNIX Scalper를 99 USD에 구매하면 신호 자동매매에 사용할 수 있는 Smart Universal Expert Advisor를 무료로 받으실 수 있습니다. UNIX Scalper는 시장 분석, BUY/SELL/WAIT 판단, Entry, Stop Loss, TP1 및 TP2 가격 수준을 하나의 정돈된 패널에 제공합니다. 거래 계획에 따라 수동으로 매매하거나, 포함된 EA를 연결하여 선택한 설정에 따라 자동으로 실행할 수 있습니다. 현재 가격인 99 USD는 앞으로 30건의 구매에 적용됩니다. 이후 가격은 149 USD로 인상됩니다. 전체 패키지 구성 구매 시 다음 항목이 포함됩니다. • MT5용 UNIX Scalper. • Smart Universal Expert Advisor — 무료. • UNIX Scalper 전체 PDF 사용자 매뉴얼. • UNIX
Entry Points Pro for MT5
Yury Orlov
4.52 (151)
전설이 돌아왔습니다: Entry Points Pro 10. MQL5 마켓 Top-3 자리를 3년간 지켜온 전설적인 지표의 재출시입니다. 수백 개의 호평 리뷰(두 버전 합산 589개), 매일 이 지표로 거래하는 수천 명의 트레이더, 31,000회 이상의 데모 다운로드   MT4+MT5 . 지난 5년간 여러분이 남긴 리뷰를 하나도 빠짐없이 읽었고, 약속 대신 그 답을 버전 10에 담았습니다. 1999년부터 시장에서 활동하며 정직함과 자신의 평판, 그리고 고객을 소중히 여기는 개발자가 만들었습니다. Entry Points Pro의 진입 시그널은 절대 리페인팅되지 않습니다. 그리고 이번에는 개발자의 말뿐이 아니라 검증 가능한 사실입니다: 확정 시그널은 캔들 종가에서만 표시되며, 자동화 테스트에서 리페인팅 0건 이 확인되었습니다(EURUSD, XAUUSD, BTCUSD에서 2,486,568회의 불변조건 검사 — 위반 0건). 검증 방법은 공개되어 있으니 전략 테스터에서 직접 재현해 보실 수
Welcome to ENTRY IN THE ZONE AND SMC MULTI TIMEFRAME Entry In The Zone and SMC Multi Timeframe is a real-time market analysis tool based on Smart Money Concepts (SMC), designed to analyze market structure, price direction, and key trading zones. It supports both Single-Timeframe Analysis and Multi-Timeframe Analysis, providing a clearer view of the overall market structure across multiple timeframes, with real-time BUY / SELL signals that do not repaint. It is designed to help filter trading opp
Reversion King Indicator
Eugen-alexandru Zibileanu
5 (9)
새로운 왕의 등장 - 인디케이터 + 주문 관리 표시(TP1 + TP2 + TP3) + 선택형 텔레그램 시그널 전송 기능 포함 (무료) (완전한 트레이딩 및 시그널 시스템) 골드를 위한 최고의 EA: Gold Slayer 이 인디케이터는 고급 전략, 사용자 지정 가능한 주문 관리 시스템, 그리고 엔벨로프 확장을 결합한 평균 회귀(mean reversion) 시스템을 포함하고 있습니다. 또한 RSI와 같은 여러 지능형 확인 필터를 통해 높은 확률의 반전 진입 구간을 포착하여 BUY 및 SELL 시그널을 제공합니다. 단순히 거래 방법만 배우는 것이 아니라, 여러 포지션을 효과적으로 관리하고 이전에 수익 중인 오픈 포지션으로 손실 거래를 커버하는 방법까지 익힐 수 있습니다. M5 전용으로 설계 및 최적화되었으며, 유동성이 풍부해 시그널이 더 깔끔하고 신뢰도 높은 BTCUSD와 XAUUSD에서 뛰어난 성능을 발휘합니다. 이 인디케이터는 ATR 기반으로 자동 계산된 진입가, 손절가, 익절가와
Market Structure Order Block Dashboard MT5는 시장 구조와 주요 가격 반응 구역을 차트에서 직접 읽고자 하는 트레이더를 위해 설계된 MT5 지표입니다. BOS, ChoCH, 오더 블록, Fair Value Gap (FVG), 유동성, Kill Zones, Volume Profile 그리고 빠른 분석을 위한 콤팩트한 대시보드를 결합합니다. 이 지표는 시장 구조, ICT 및 Smart Money 개념을 의사결정 프레임워크로 사용하는 트레이더를 대상으로 합니다. 추세 지속, 가능한 반전, 가격 불균형, 유동성 타겟 및 관심 구역을 보다 체계적으로 식별하는 데 도움을 줄 수 있습니다. 구매자를 위한 포함 리소스 구매 후 MQL5 개인 메시지로 요청하시면 완전한 PDF 사용 설명서와 파라미터 설정 팁을 제공해 드립니다. MQL5 개인 메시지를 통한 직접 기술 지원. 1.20 버전은 두 가지 주요 추가 기능을 제공합니다: Pending BOS / Pending
Atomic Analyst MT5
Issam Kassas
4.46 (59)
ATOMIC ANALYST — 특별 혜택 시장 분석 도구, 자동매매 EA, 교육과 지원을 하나로. MT5용 Atomic Analyst를 99 USD에 구매하고, 지표의 신호를 자동매매에 활용할 수 있는 Smart Universal Expert Advisor를 무료로 받으세요 . Atomic Analyst는 가격 움직임 분석, 추세 방향, 진입·청산 신호, 손절 수준, 여러 익절 수준을 차트에 모아 보여줍니다. 분석을 참고해 수동으로 거래하거나, 포함된 EA를 연결하여 선택한 설정에 따라 자동으로 거래를 실행할 수 있습니다. 현재 가격인 99 USD는 앞으로 이루어지는 30건의 구매에 적용됩니다. 이후 가격은 149 USD로 인상됩니다. 전체 패키지 구성 구매 시 다음 항목이 포함됩니다. • MT5용 Atomic Analyst. • Smart Universal Expert Advisor — 무료. • 전체 Atomic Analyst PDF 사용자 설명서. • Atomic Ana
통화 강도 마법사는 성공적인 거래를 위한 올인원 솔루션을 제공하는 매우 강력한 지표입니다. 표시기는 여러 시간 프레임의 모든 통화 데이터를 사용하여 이 또는 해당 외환 쌍의 힘을 계산합니다. 이 데이터는 특정 통화의 힘을 확인하는 데 사용할 수 있는 사용하기 쉬운 통화 지수 및 통화 전력선의 형태로 표시됩니다. 필요한 것은 거래하려는 차트에 표시기를 부착하는 것뿐입니다. 표시기는 거래하는 통화의 실제 강세를 보여줍니다. 지표는 또한 추세와 거래할 때 유리하게 사용할 수 있는 구매 및 판매 거래량 압력의 극한값을 보여줍니다. 지표는 또한 피보나치에 기반한 가능한 대상을 보여줍니다. 표시기는 PUSH 알림을 포함한 모든 유형의 알림을 제공합니다. 구매 후 연락주세요. 나는 당신과 거래 팁을 공유하고 당신에게 무료로 훌륭한 보너스 지표를 줄 것입니다! 나는 당신에게 행복하고 유익한 거래를 기원합니다!
FiboSniper Pro
Van Minh Nguyen
5 (3)
FiboSniper Pro – Multi-Filter Fibonacci System with Auto SL/TP and Control Panel FiboSniper Pro는 동적 Fibonacci Envelopes와 여러 확인 필터를 결합하여 선별된 Buy 및 Sell 신호를 생성하는 기술적 지표입니다. Fibonacci 레벨은 Moving Average와 ATR을 기반으로 계산된 후 ADX, EMA, RSI, ATR, Volume, Time 및 Candle 구조를 통해 필터링됩니다. 이 지표는 ATR 기반의 자동 Stop Loss 및 Take Profit 레벨을 차트에 직접 표시하며, 빠른 설정 조정을 위한 인터랙티브 Control Panel을 제공합니다. 구매 후 권장 설정 파일과 자세한 사용 방법을 받으려면 저에게 문의해 주세요. Auto Trader X를 사용하여 FiboSniper Pro 신호를 자동화할 수 있습니다: [Auto Trader X] User Guide 및 Se
Adaptive Price Action Engine 지표를 구매하면 EA(자동매매 프로그램)가 무료 멀티 타임프레임 기반 자기 최적화 추세 & 캔들 패턴 분석 시스템 시장은 끊임없이 변화하며, 모든 Price Action 패턴이 모든 시장 환경에서 동일한 가치를 가지는 것은 아닙니다. Adaptive Price Action Engine 은 변화하는 시장 환경에 적응할 수 있도록 설계되었으며, 추세 구조, 멀티 타임프레임 분석, 캔들 패턴 및 통계적 최적화 를 하나의 분석 프레임워크로 결합합니다. 두 가지 적응형 모드 Dual Alpha Trend Mode 낮은 타임프레임과 높은 타임프레임에서 적합한 Alpha Trend 파라미터를 자동으로 탐색하여, 최근 시장 움직임에 맞춰 추세 분석을 조정합니다. Candlestick + Alpha Mode Alpha Trend를 통한 시장 국면 분석과 22개의 상승 및 하락 캔들 패턴 을 결합합니다. 모든 패턴을 동일하게 취급하는 대신, 다양
SMART PRICE ACTION CONCEPTS — 특별 혜택 구조를 확인하고, 구간을 파악하고, 거래 계획을 세우세요. MT5용 Smart Price Action Concepts를 49 USD에 구매하면 Smart Universal Expert Advisor를 무료로 받으실 수 있습니다. Smart Money Concepts(SMC), ICT 방식의 분석, 가격 행동 분석을 하나의 정돈된 차트에서 활용하세요. 시장 구조, 오더 블록, 유동성 참고 수준과 불균형을 파악하고, Smart Panel에서 표시할 요소를 선택할 수 있습니다. 현재 가격인 49 USD는 앞으로 30건의 구매에 적용됩니다. 이후 가격은 100 USD로 인상됩니다. 전체 패키지 구성 • MT5용 Smart Price Action Concepts. • Smart Universal Expert Advisor — 무료 보너스. • 전체 PDF 사용자 매뉴얼 및 공식 온라인 강좌. • 단계별 설치 및 설정 안내.
Divergence Bomber
Ihor Otkydach
4.89 (94)
이 지표를 구매하신 분께는 다음과 같은 혜택이 무료로 제공됩니다: 각 거래를 자동으로 관리하고, 손절/익절 수준을 설정하며, 전략 규칙에 따라 거래를 종료하는 전용 도우미 툴 "Bomber Utility" 다양한 자산에 맞게 지표를 설정할 수 있는 셋업 파일(Set Files) "최소 위험", "균형 잡힌 위험", "관망 전략" 모드로 설정 가능한 Bomber Utility의 셋업 파일 이 전략을 빠르게 설치, 설정, 시작할 수 있도록 돕는 단계별 영상 매뉴얼 주의: 위의 모든 보너스를 받기 위해서는 MQL5 개인 메시지 시스템을 통해 판매자에게 연락해 주세요. 독창적인 커스텀 지표인 “Divergence Bomber(다이버전스 봄버)”를 소개합니다. 이 지표는 MACD 다이버전스(괴리) 전략을 기반으로 한 올인원(All-in-One) 거래 시스템입니다. 이 기술 지표의 주요 목적은 가격과 MACD 지표 간의 다이버전스를 감지하고, **향후 가격이 어느 방향으로 움직일지를 알려주
Auto Optimized SpeedAngle 은 지속적인 워크포워드 최적화(Walk-Forward Optimization, WFO)를 통해 곡선 적합(curve-fitting)을 제거한 기관 수준의 모멘텀 벡터화 시스템입니다. 시장 체제가 바뀔 때 성능이 떨어지는 정적 입력에 의존하는 대신, 이 지표는 표본 외(Out-of-Sample, OOS) 검증을 사용하여 매개변수를 동적으로 재보정하며, 표시되는 신호가 과거의 우연이 아닌 진정한 통계적 우위를 나타내도록 보장합니다. 핵심 기관용 프레임워크 워크포워드 최적화 엔진: 핵심 알고리즘은 수천 가지의 룩백(lookback) 및 임계값 조합을 지속적으로 스캔하며, 데이터를 인샘플(in-sample)과 표본 외(out-of-sample) 세트로 엄격하게 분리합니다. 미지의 데이터 환경에서 수학적 우수성이 증명된 경우에만 새로운 매개변수 구성을 채택합니다. 정량적 목적 함수: 순수한 총이익을 쫓는 대신, 최적화 엔진은 기관 수준의 안정성
Volatility Master for MetaTrader is a real-time dashboard tool that scans up to  50 symbols  to identify high-volatility , trending markets instantly. With bullish/bearish signals, customizable alerts, and a user-friendly interface, it helps you avoid range-bound conditions and focus on high-probability trades. Clarity leads to confidence. Trade confidently and protect your capital effectively with this powerful dashboard. We don't offer free or bonus indicators in exchange of reviews from you.
PZ Trend Trading MT5
PZ TRADING SLU
3.8 (5)
Capture every opportunity: your go-to indicator for profitable trend trading Trend Trading is an indicator designed to profit as much as possible from trends taking place in the market, by timing pullbacks and breakouts. It finds trading opportunities by analyzing what the price is doing during established trends. [ Installation Guide | Update Guide | Troubleshooting | FAQ | All Products ] Trade financial markets with confidence and efficiency Profit from established trends without getting whips
Power Candles MT5
Daniel Stein
4.58 (12)
Power Candles V3 - 자체 최적화 강도 지표 파워 캔들 V3는 적용된 모든 차트에서 통화 및 상품의 강세를 실행 가능한 거래 계획으로 전환합니다. 단순히 캔들에 색상을 입히는 대신, 백그라운드에서 실시간 자동 최적화를 수행하여 현재 보고 있는 종목에 대한 최적의 손절매, 익절 및 신호 임계값을 제공합니다. 한 번의 클릭으로 실시간 거래에 적용할 수 있으며, 진입점, 손절매 및 익절 선이 정확한 가격에 맞춰 차트에 표시되고, 방향과 함께 알림이 발령됩니다. 이 도구는 Stein Investments 에코시스템의 일부입니다. 18개 이상의 도구와 함께 당신의 1대1 AI 트레이딩 멘토 Max.  항상 대기 중, 모든 인디케이터를 깊이 있게 이해, 무언가를 차근차근 생각해보고 싶은 순간에 도움을 줍니다.  https://stein.investments 에서 만나보세요 매 종가 바마다 3,000회 이상의 트레이딩 시뮬레이션. 9가지 강도 상태. 2가지 전략을 병렬로 테스트.
IQ FX Gann Levels a precision trading indicator based on W.D. Gann’s square root methods . It plots real-time, non-repainting support and resistance levels to help traders confidently spot intraday and scalping opportunities with high accuracy. William Delbert Gann (W.D. Gann) was an exceptional market analyst, whose trading technique was based on a complex blend of mathematics, geometry, astrology, and ancient mathematics which proved to be extremely accurate. We don't offer free or bonus indic
RelicusRoad Pro MT5
Relicus LLC
4.96 (24)
RelicusRoad Pro: 퀀트 시장 운영 체제 70% 할인 평생 이용권 (한정 시간) - 2,000명 이상의 트레이더와 함께하세요 왜 대부분의 트레이더는 "완벽한" 지표를 가지고도 실패할까요? 진공 상태에서 단일 개념 만으로 거래하기 때문입니다. 문맥 없는 신호는 도박입니다. 지속적인 승리를 위해서는 컨플루언스(중첩) 가 필요합니다. RelicusRoad Pro는 단순한 화살표 지표가 아닙니다. 완전한 퀀트 시장 생태계 입니다. 독점적인 변동성 모델링을 사용하여 가격이 이동하는 "공정 가치 로드"를 매핑하고, 단순 노이즈와 실제 구조적 돌파를 구분합니다. 추측은 그만두세요. 기관급 로드 로직으로 거래를 시작하세요. 핵심 엔진: "Road" 알고리즘 시스템의 중심에는 시장 상황에 실시간으로 적응하는 동적 변동성 채널인 Road Algo 가 있습니다. 세이프 라인(평형) 과 가격이 수학적으로 반전될 가능성이 높은 확장 레벨 을 투영합니다. Simple Road: 일반적인 시장을 위
ATstrong
Zaha Feiz
5 (1)
ATSTRONG PRO: 시장 구조 및 돌파(Breakout) 지표 돌파 감지 엔진 | 5개의 동적 TP 목표 | 실시간 대시보드 패널 | 리페인팅 없음 출시 기념 가격 현재 가격: $59 — 10개가 판매될 때마다 가격이 $10씩 인상됩니다. ATSTRONG PRO 는 MetaTrader 5 전용으로 설계된 고급 돌파 및 기관 수준의 시장 구조 지표입니다. 높은 확률의 스윙 피벗을 감지하고, 군집된 지지 및 저항 축적 영역을 식별하며, 실시간으로 구조 붕괴(BOS) 및 특성 변화(CHoCH) 신호를 제공합니다. 이 지표는 차트 위에 동적 손절매(Stop Loss)와 5개의 개별 이익 실현 수준(TP1 ~ TP5)을 자동으로 그려주며, 위험 대비 보상 투영 상자, 별점으로 매겨진 신호 품질 등급, 실시간 온차트 성과 분석 대시보드를 함께 제공합니다. 거래 주의 사항: 이 지표는 수동 거래 및 시장 분석용입니다. 캔들이 마감될 때 시각적으로 명확한 신호, 레벨, 알림을 리페인팅
PZ Divergence Trading MT5
PZ TRADING SLU
3.71 (7)
Unlock hidden profits: accurate divergence trading for all markets Tricky to find and scarce in frequency, divergences are one of the most reliable trading scenarios. This indicator finds and scans for regular and hidden divergences automatically using your favourite oscillator. [ Installation Guide | Update Guide | Troubleshooting | FAQ | All Products  ] Easy to trade Finds regular and hidden divergences Supports many well known oscillators Implements trading signals based on breakouts Displays
Trend Catcher ind mt5
Ramil Minniakhmetov
5 (18)
트렌드 캐처 인디케이터 트렌드 캐처 인디케이터는 개발자가 자체 개발한 맞춤형 적응형 트렌드 분석 지표들을 조합하여 시장 가격 움직임을 분석합니다. 단기적인 노이즈를 제거하고 근본적인 모멘텀 강도, 변동성 확대, 가격 구조 움직임에 집중하여 진정한 시장 방향을 파악합니다. 또한 이동 평균, RSI, 변동성 필터와 같은 맞춤형 지표들을 활용하여 가격을 평활화하고 트렌드를 필터링합니다. 실제 운영 모니터링 및 기타 제품은 다음 링크에서 확인하실 수 있습니다:   https://www.mql5.com/en/users/mechanic/seller 텔레그램에서는 EA나 설정 파일을 판매하지 않습니다. 사기이니 주의하세요. 모든 설정 파일은 블로그에서 무료로 제공됩니다. 중요! 구매 후 즉시 연락 주시면 사용 방법 및 보너스를 드립니다!
Axiom Matrix
Issam Kassas
5 (8)
Axiom Matrix — 특별 혜택 Axiom Matrix을 49 미국 달러에 구매하고 Smart Universal Expert Advisor를 무료로 받으세요. 시장을 탐색하세요. 기회를 비교하세요. 다음 차트를 선택하세요. Axiom Matrix는 여러 종목과 시간대의 분석을 하나의 대시보드에 모읍니다. 모든 차트를 따로 확인하지 않고 집중할 시장을 찾으세요. 종합시세 또는 선택한 종목을 여러 시간대에서 탐색. 추세, 모멘텀, 거래량, 변동성 및 시장 품질 정보 비교. Best Axiom Pick, 신호 상태 및 클릭 가능한 셀로 거래 조건 확인. Axiom Matrix는 분석 대시보드이며 거래를 실행하지 않습니다. 패키지 구성 Axiom Matrix Smart Universal Expert Advisor PDF 사용 설명서와 온라인 강좌. 설정 안내와 구매자 커뮤니티 이용 혜택. Smart Universal Expert Advisor는 별도의 보너스입니다. 이 제품의 직접적인
제작자의 제품 더 보기
ATR Stop Loss Finder automatically calculates and displays dynamic   stop loss levels on your chart based on the Average True Range   indicator. The tool helps traders place logical, volatility-adjusted   stop loss orders rather than relying on fixed pip values or arbitrary   price levels.   The indicator plots two lines directly on the chart: an upper line   for short positions and a lower line for long positions. Both lines   update in real time with each new bar. A small information panel  
Lion Lightning Scalper: Unleash Your Trading Potential with a Professional-Grade Expert Advisor The Lion Lightning Scalper isn't your average Expert Advisor (EA); it's a powerful, cutting-edge tool designed to meet the needs of traders seeking maximum profitability in the volatile Forex market. Why Choose Lion Lightning Scalper? Superior Speed: With sophisticated trading strategies and lightning-fast market analysis, Lion Lightning Scalper can enter and exit the market in fractions of a second
Apex Market Structure is a complete Smart Money toolkit that maps market   structure, order blocks, liquidity and multi-timeframe trend in real time,   directly on your chart. It is built for traders who read price action the   way institutions do: structure breaks, liquidity sweeps, and reaction zones,   all detected automatically and confirmed at bar close.   Everything is drawn for you. No manual line drawing, no guesswork, no second   indicator needed.   How It Works   The indicator con
Triple Signal HARSI
Keattisuk Viriyasu
Triple Signal HARSI turns the classic Heikin Ashi RSI oscillator into a   complete decision tool by adding three layers of confirmation: a built-in   alert engine, a multi-timeframe dashboard, and automatic divergence   detection. Instead of staring at one oscillator, you get momentum,   higher-timeframe context, and reversal warnings in a single window.   How It Works   The indicator converts a zero-centered RSI into smoothed Heikin Ashi   candles, so momentum shifts appear as clean candle
Vertex Structure Dashboard delivers a complete multi-timeframe market structure analysis in a single, compact panel. It monitors up to 9   timeframes simultaneously and displays trend bias, structural breaks, momentum, and value zones in real time — no tab-switching, no manual   tracking.   The panel is fully draggable and collapsible. Its position persists across timeframe changes through GlobalVariables, so your layout stays   exactly where you placed it.   How It Works   Each enabled tim
Ricochet Burst
Keattisuk Viriyasu
Ricochet is an automated trading system for EURUSD on the M1 timeframe, built   around one simple but powerful idea: a losing trade should not be the end of the   move, it should be the start of the next one.   Most systems take a stop loss and walk away. Ricochet does the opposite. The   moment a trade is stopped out, the engine changes state and fires again in the   direction the market just proved it wanted to go. A failed entry becomes the   trigger for the recovery. That is the Ricochet p
Signal Verdict
Keattisuk Viriyasu
Most traders never actually find out whether the signal they follow makes money. Signal Verdict answers that on your own chart. It replays your entry rule across history, opens and closes a simulated position for every signal, and reports what really came out: win rate, expectancy in R, profit factor, drawdown, and how often each take profit was reached. It is not limited to its own signals. Signal Verdict can read the buffers of any indicator installed on your terminal, so the arrows you are
Understudy
Keattisuk Viriyasu
Understudy shows which market regime you are in, and it tells you when its own machine learning is not good enough to be trusted. Most machine learning indicators ask you to take the model on faith. This one measures itself against a fixed structural baseline on every closed bar and publishes the verdict on the chart. It will tell you, in writing, when it is losing. HOW IT WORKS Two forecasters run side by side. The Principal is a fixed structural model. Its weights never change, so it stay
Sweep Ledger
Keattisuk Viriyasu
Most liquidity tools draw a level and leave you to guess whether it mattered. Sweep Ledger keeps a record. Every structural high and low it draws carries an outcome: whether price only wicked through it, or actually closed beyond it, and whether that breakout was still holding a fixed number of bars later. The running tally sits on the panel, so you can see how levels on this symbol and this timeframe have actually behaved before you commit to the next one. What Gets Recorded A level is crea
필터:
리뷰 없음
리뷰 답변