CVD Range Divergencee

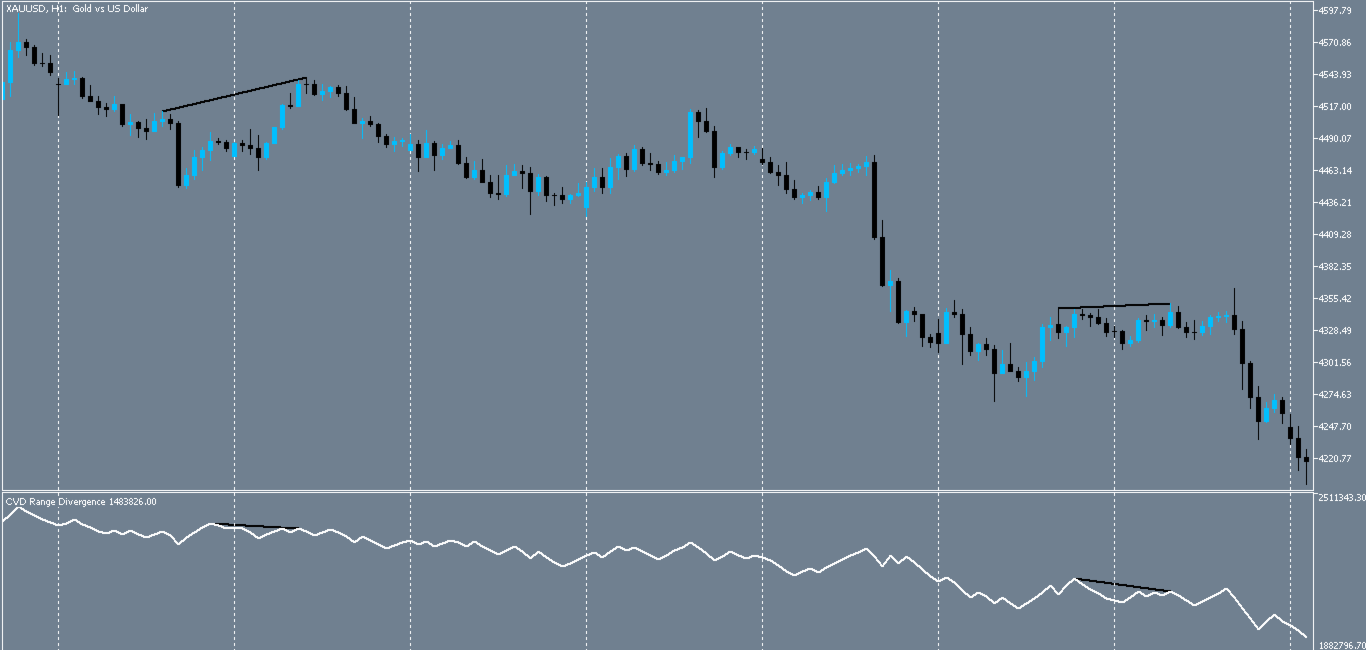
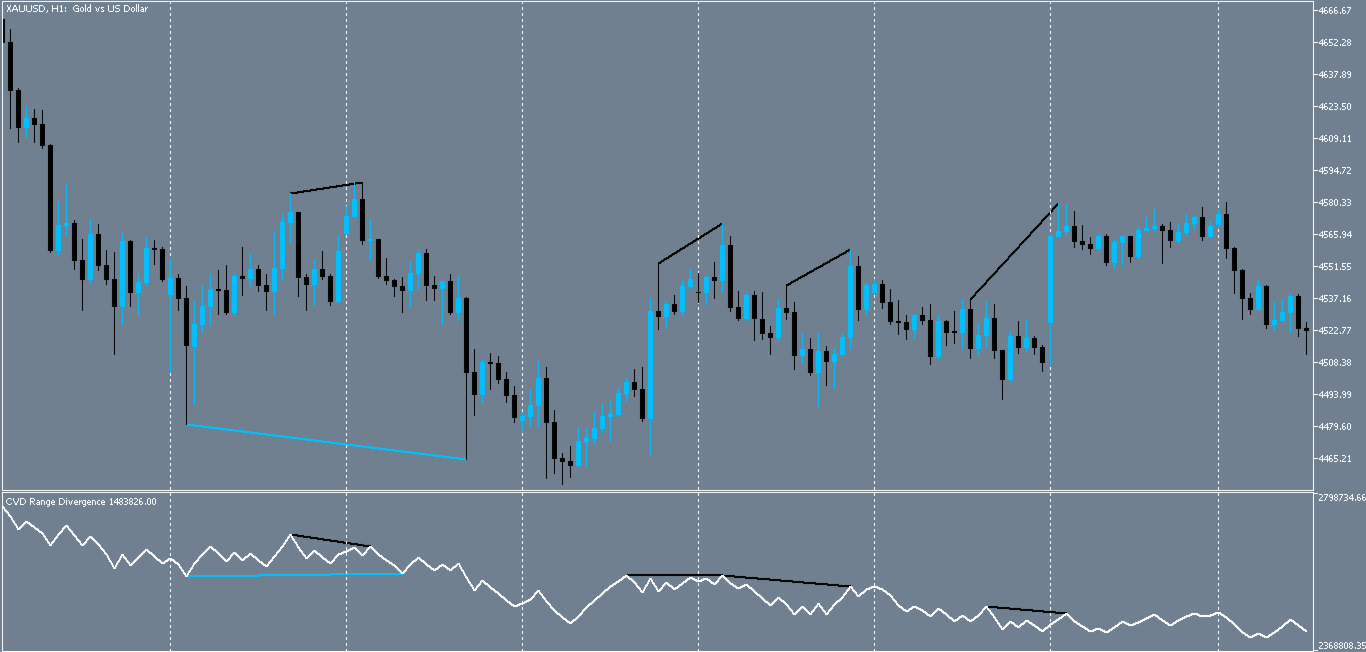
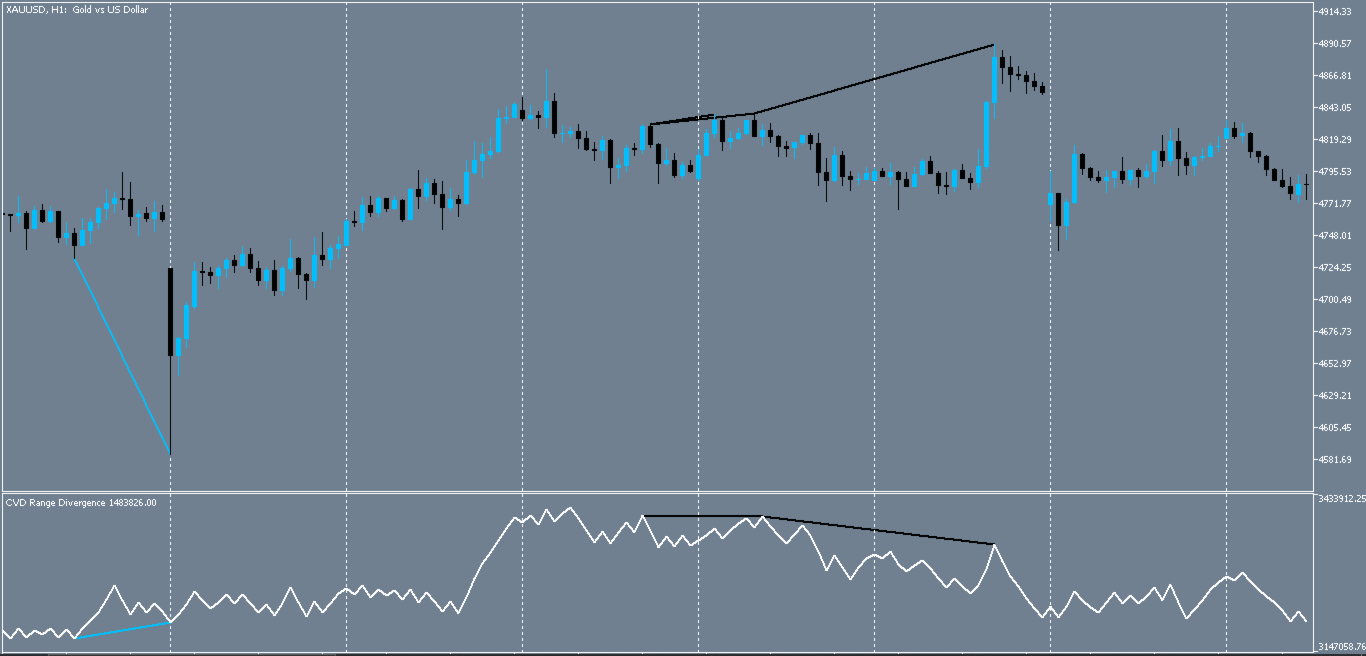
CVD Range Divergence is a powerful volume-based technical indicator designed for MetaTrader 5 (MQL5). It calculates the Cumulative Volume Delta (CVD) by analyzing the difference between buying and selling pressure per candle, utilizing either Tick Volume or Real Volume.

  • Multi-Period Swing Scanning: Automatically scans a user-defined range of swing periods (e.g., 9 to 13) to detect regular and hidden divergences between price peaks/troughs and CVD peaks/troughs.

  • Weighted Delta Support: Includes an option to calculate CVD using a weighted average method based on candle body position relative to High/Low, providing a more granular view of market flow.

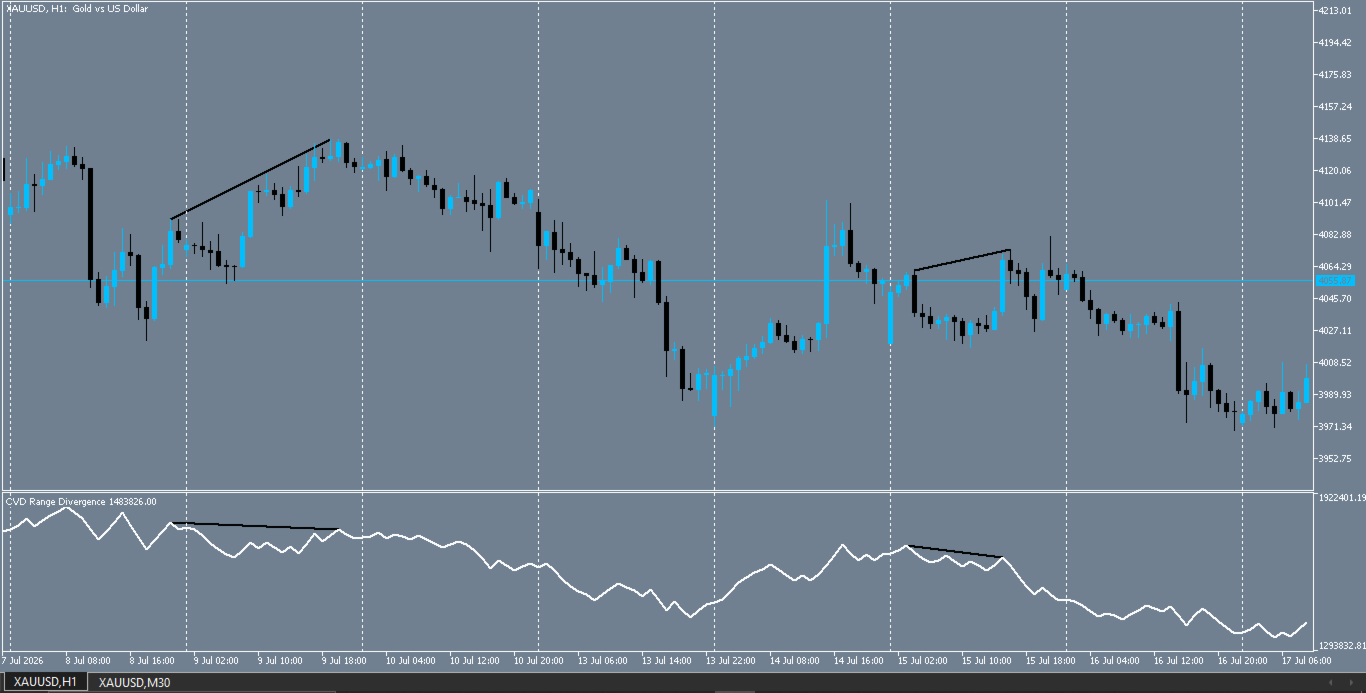
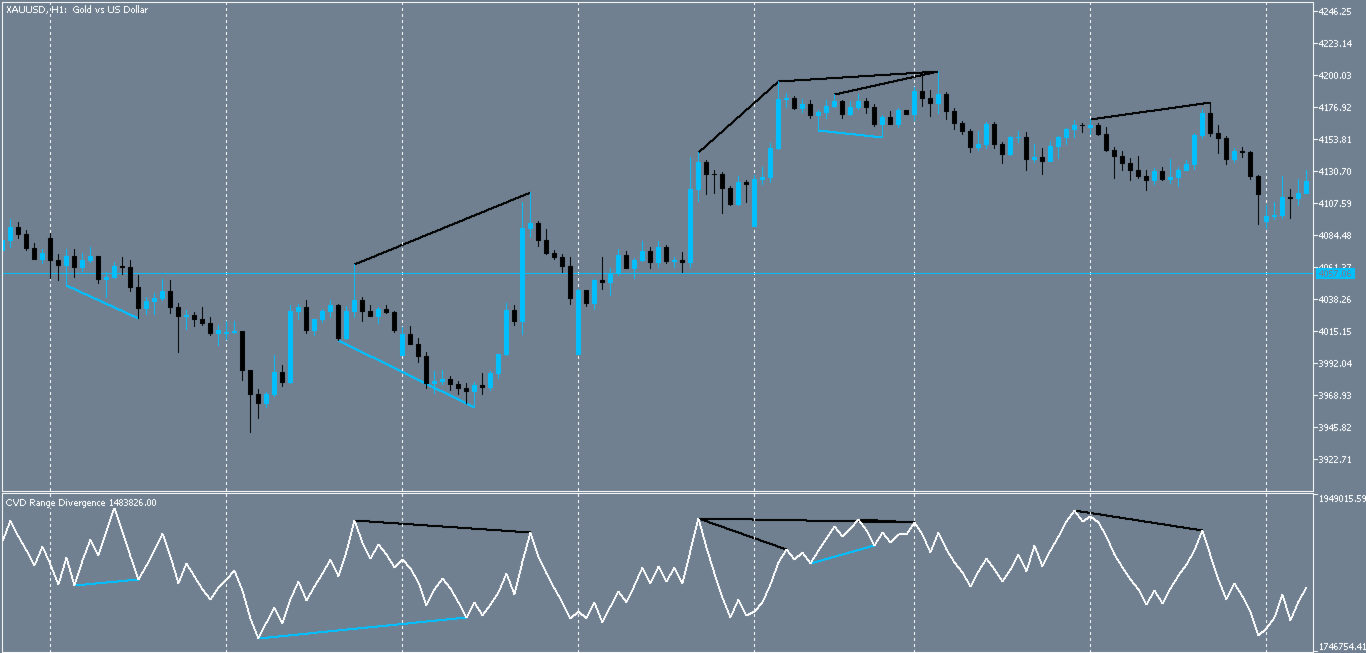
  • Visualization: Plots the CVD line in a separate window. Detected divergences are marked with colored trend lines (DeepSkyBlue for Bullish, Black for Bearish) on both the price chart and the CVD subwindow. Arrows can be optionally enabled on the main chart (disabled by default).

  • Smart Alerting: Built-in popup and push notification systems. The alert logic is strictly timestamp-bound to ensure you never receive spam about historical divergences when reloading the chart or switching timeframes.

  • Robust Design: The code handles input validation, logic resets when toggling calculation methods, and correctly renders objects in the intended sub-windows.
作者的更多信息
VWAP Anchor Tool
Jackson Mukurani Wanguthi
Anchored VWAP is a lightweight, interactive volume-weighted average price indicator designed for traders who need precision without clutter. Unlike standard VWAP that resets every session, this tool lets you drop up to five custom anchors directly on any candle. Each anchor calculates VWAP from that exact point forward, complete with standard deviation bands to highlight where price may find support or resistance relative to volume. Key Features: • Up to 5 simultaneous anchors — compare multi
FREE
Market Pulse Dashboard
Jackson Mukurani Wanguthi
A clean, information-dense dashboard that sits on your chart and answers the five questions every trader should ask before pulling the trigger: 1) What am I looking at? — Symbol, timeframe, live spread in points and pips. 2) When am I trading? — Active forex session with overlap detection, candle countdown timer, broker server time (auto-detected UTC offset, DST-proof), and your local time. 3) How much should this move? — 5 configurable ATR multiplier rows for quick SL/TP sizing, plus Daily,

FREE
Adaptive Alpha EMA
Jackson Mukurani Wanguthi
Adaptive Alpha EMA is a next-generation trend indicator that revolutionizes the classic EMA crossover by introducing real-time volatility responsiveness. Unlike traditional EMAs that rely on static periods, Adaptive Alpha EMA measures volatility speed through ATR (Average True Range) and automatically scales the alpha (smoothing factor) of both fast and slow EMAs. The result is an indicator that tightens during low-volatility consolidation and expands during explosive trend moves — delivering e
FREE
UniversalLevelAlert
Jackson Mukurani Wanguthi
4 (1)
UniversalLevelAlert is a free, lightweight MT5 chart indicator that combines price-level alerts with multi-timeframe candle-close alerts — all in one tool. What it does: Price Alerts: Set up to 5 horizontal alert lines directly on the chart. Drag them visually to adjust levels. Get notified when price comes within a trigger distance. Candle-Close Alerts: Monitor up to 5 timeframes simultaneously. Get alerted the moment a candle closes on any chosen timeframe, with bullish/bearish classification
FREE
Time Period Labels
Jackson Mukurani Wanguthi
4 (1)
TimePeriodLabels – See where new periods start on any chart A clean indicator that draws vertical lines and labels when a new year, month, week or day begins. No more squinting at dates or placing manual lines every time you open a chart. Each period type has its own colour and style so you instantly know what changed. What it does Detects when the day, week, month or year flips on the current timeframe. Draws a vertical line at the first bar of the new period. Adds a text label (for day, month
FREE
Asian Session Anchor Profile
Jackson Mukurani Wanguthi
亚洲交易时段锚定轮廓 交易者操作指南 1. 概述 亚洲交易时段锚定轮廓从亚洲交易时段推导出一组结构化的参考水平,并将其投射到随后的伦敦和纽约交易时段中。这些水平旨在以三种方式使用: 作为支撑和阻力区域,定义价格最可能发生争夺的位置; 作为突破区域,当价格果断突破并站稳时,表明区间扩展; 作为统计扩展带,用于识别价格是否已超出其正常离散范围。 该指标不产生信号。它定义的是价格框架,交易决策在此框架内做出。 2. 图表组件 亚洲交易时段区间(阴影框)   ——亚洲交易时段记录的最高和最低价格。框的边界代表当日初始平衡,并作为主要的日内支撑和阻力区域,以及最常被测试的突破触发器。 成交量分布水平   ——源自亚洲交易时段内交易活动的分布: POC(控制点)   ——交易活动最密集的价格水平。代表该时段的平衡点。 VAH(价值区域高点)   ——包含该时段大部分活动区域的上边界。起阻力作用。 VAL(价值区域低点)   ——该区域的下边界。起支撑作用。 锚定VWAP和标准差带 : 亚洲VWAP   ——以亚洲交易时段开始为锚点的成交量加权平均价格。 日VWAP   ——以交易日开始为锚点的
FREE
ACE Signals
Jackson Mukurani Wanguthi
ACE Signals Adaptive Confluence Engine — Precision Entry Signals Through Multi-Layer Validation Tired of repainting arrow indicators that fire late, whipsaw in chop, and leave you holding the bag? Most signal indicators rely on a single condition — a moving average cross, an RSI spike, or a price pattern. In volatile markets, that is not enough. ACE Signals was engineered from the ground up to eliminate false entries by requiring three independent layers of market intelligence to align before a
FREE
Risk Management Suite
Jackson Mukurani Wanguthi
风险管理套件 —— 您的策略。您的入场。每一笔交易都拥有机构级纪律。 您已有自己的策略,也懂得如何解读市场。真正让交易者受挫的往往不是策略本身,而是从   “我看到了机会”   到   “订单已进场管理”   之间发生的一切:凭感觉估算的手数、设得太紧的止损、移动后的止盈、报复性交易,或是开了第三个品种却未察觉前两个品种已构成同向押注。 本套件将   彻底消除这一切。永远消除。 运作方式 —— 一分钟配置,终生纪律 一次设定您的风险。   选择您每笔交易愿意承担账户的百分比,以及账户在   所有   持仓中允许持有的最大总风险。 选择您希望如何处理交易。   固定的盈亏比,或是基于波动率的追踪止损。可选保本止损。可选最多三档分批止盈。 执行您自己的策略。   看到您的形态,按下 BUY 或 SELL。完成。 从点击的那一刻起,本套件将接管您过去所有手动操作的工作: 为您计算仓位   —— 每一笔交易都精确承担您设定的风险百分比,并按券商合约规则进行校验。无需计算器。不会出错。再无 “我原意是 1%”。 为您设置止损和止盈   —— 基于波动率,按您选择的盈亏比,在您进场前就配置好。最坏
Smartflow
Jackson Mukurani Wanguthi
SMARTFLOW —— 像机构一样看清市场 一个引擎。一眼洞察。一次决策。 Smartflow 是一款面向 MetaTrader 5 的一体化市场智能分析层。它读取市场结构、绘制流动性分布,并为您呈现一幅完整、可直接用于决策的市场图景:趋势是什么、关键水平在哪里、何时该行动。 没有杂乱的图表。没有层层堆叠的五个指标。没有反复犹豫。Smartflow 为您承担繁重的分析工作 —— 始终如一,在每个K线、每个交易时段、每个品种上。 SMARTFLOW 在您的图表上呈现什么   多周期趋势仪表盘   —— 一个简洁的图表内嵌面板,实时显示当前图表周期以及两个更高周期的趋势倾向。让您一秒钟掌握更大格局,从此避免逆势交易。   自动趋势识别   —— Smartflow 像专业交易台一样读取市场结构:追踪哪些关键水平被守住、哪些被突破。结果是一个清晰、实时更新的多头/空头判断 —— 无需手动画线、无需主观臆断、无需猜测。   机构级供需区域   —— 大型订单聚集的水平被实时检测、绘制并更新。活跃区域高亮显示;被突破的区域会淡化但仍保持可见,让您始终清楚流动性在哪里被消耗,以及市
筛选:
无评论
回复评论