
CVD Range Divergencee
- Indicatori
- Versione: 1.5

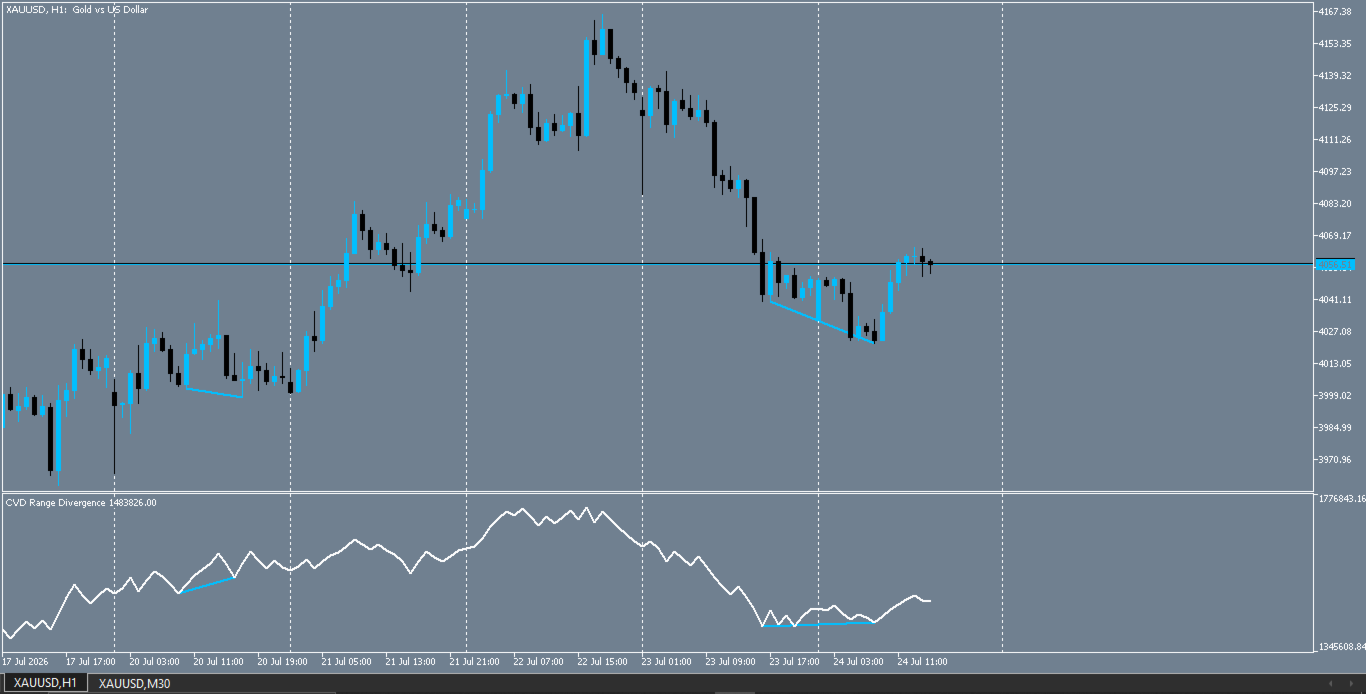
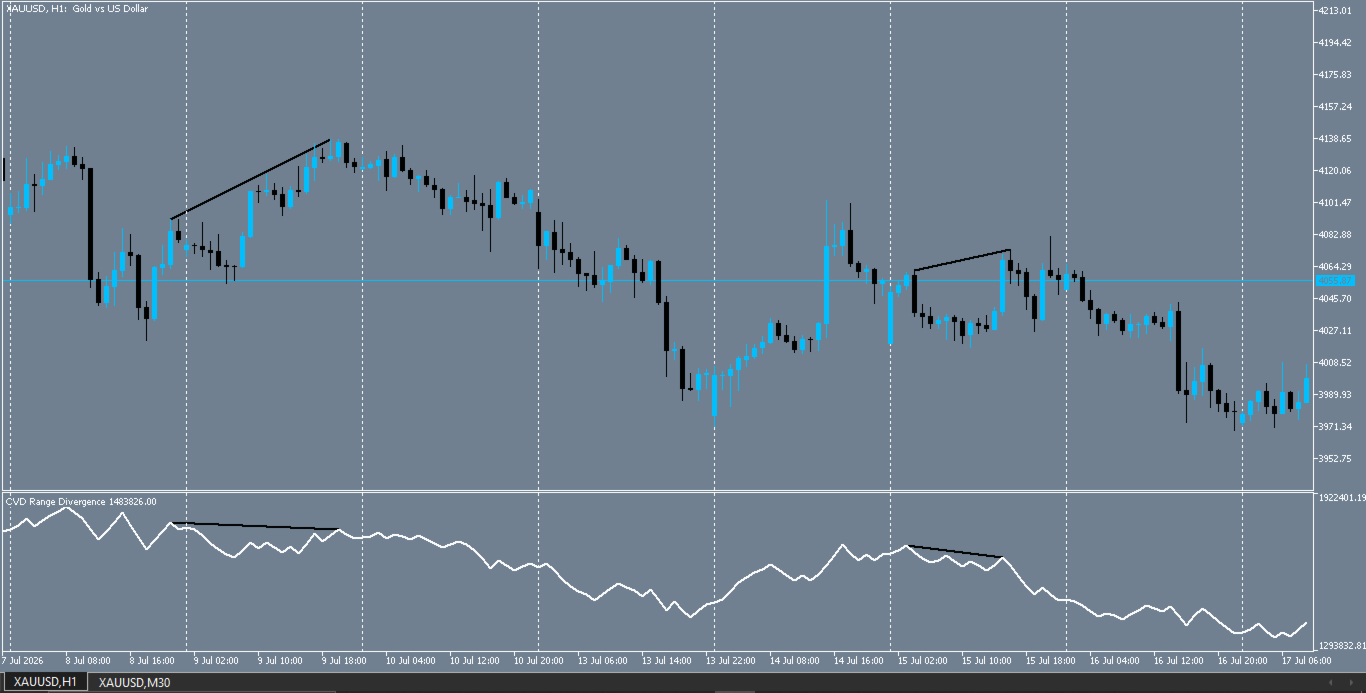
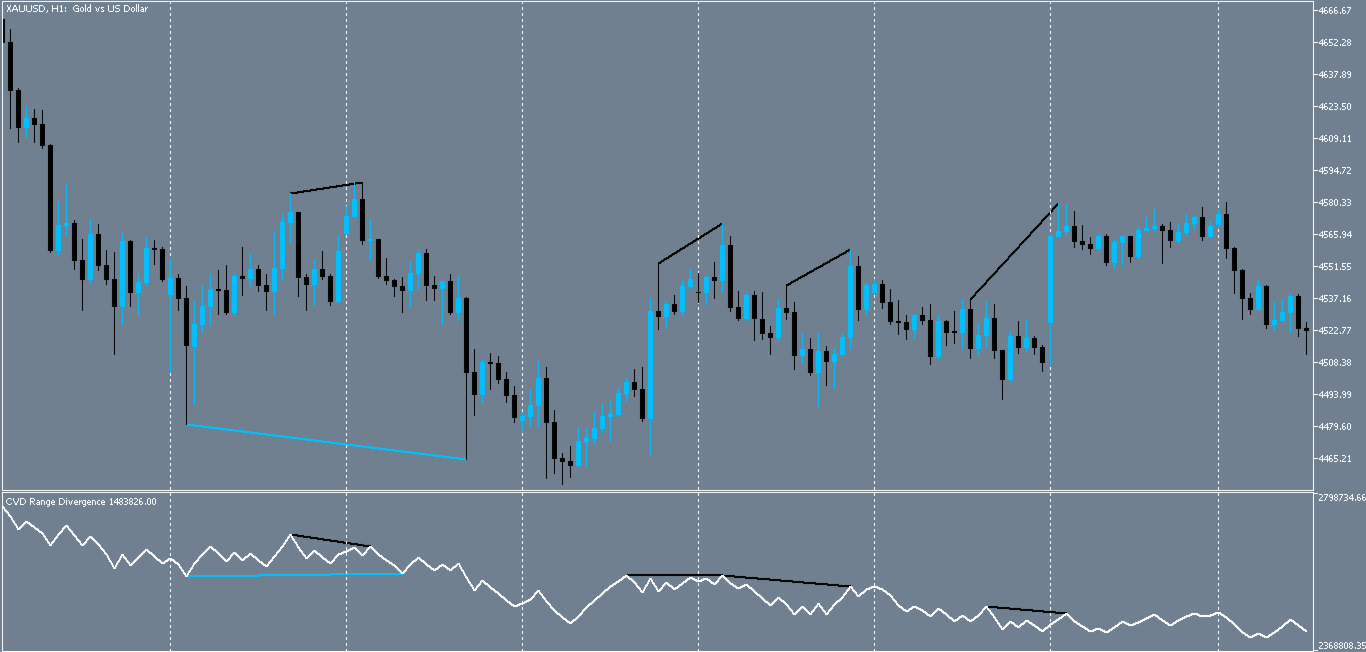
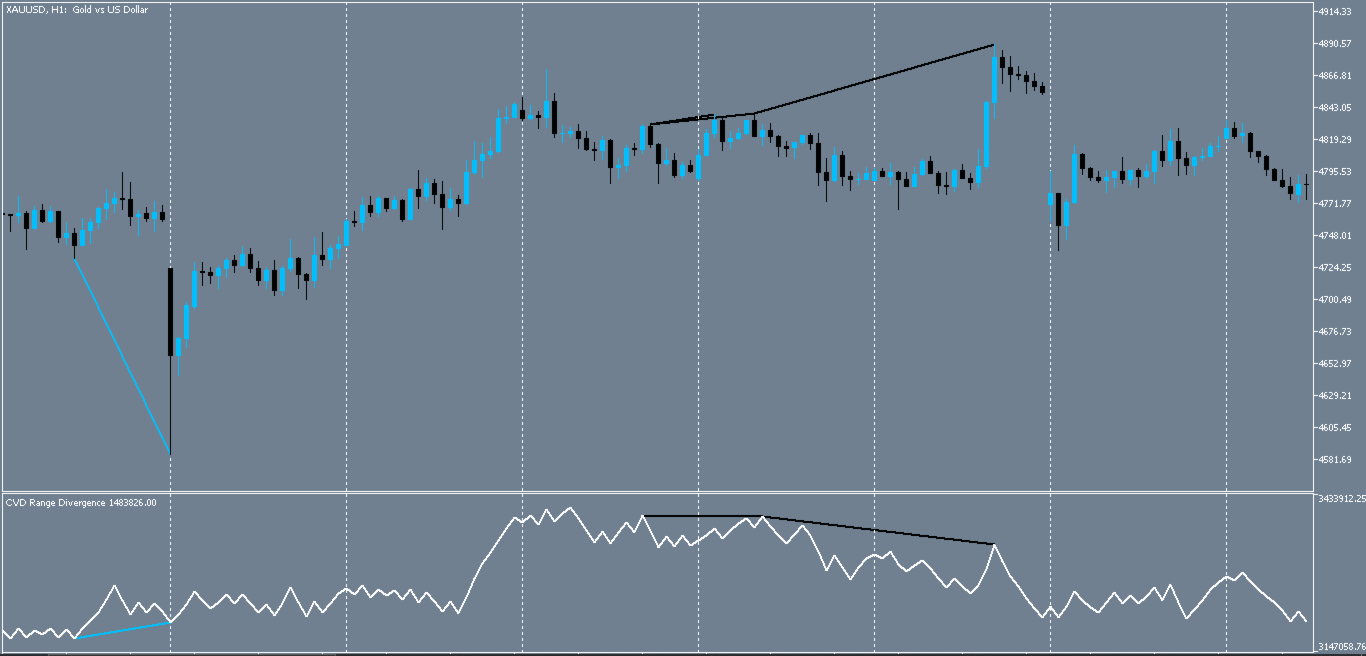
CVD Range Divergence is a powerful volume-based technical indicator designed for MetaTrader 5 (MQL5). It calculates the Cumulative Volume Delta (CVD) by analyzing the difference between buying and selling pressure per candle, utilizing either Tick Volume or Real Volume.
-
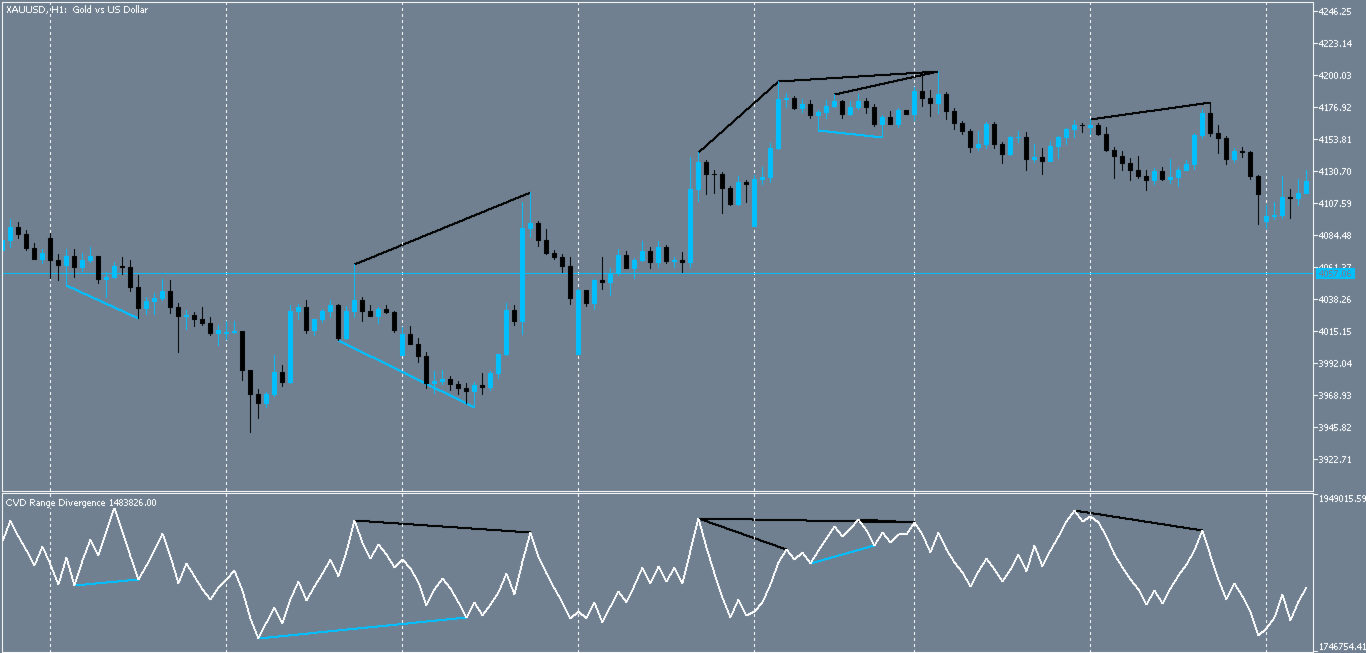
Multi-Period Swing Scanning: Automatically scans a user-defined range of swing periods (e.g., 9 to 13) to detect regular and hidden divergences between price peaks/troughs and CVD peaks/troughs.
-
Weighted Delta Support: Includes an option to calculate CVD using a weighted average method based on candle body position relative to High/Low, providing a more granular view of market flow.
-
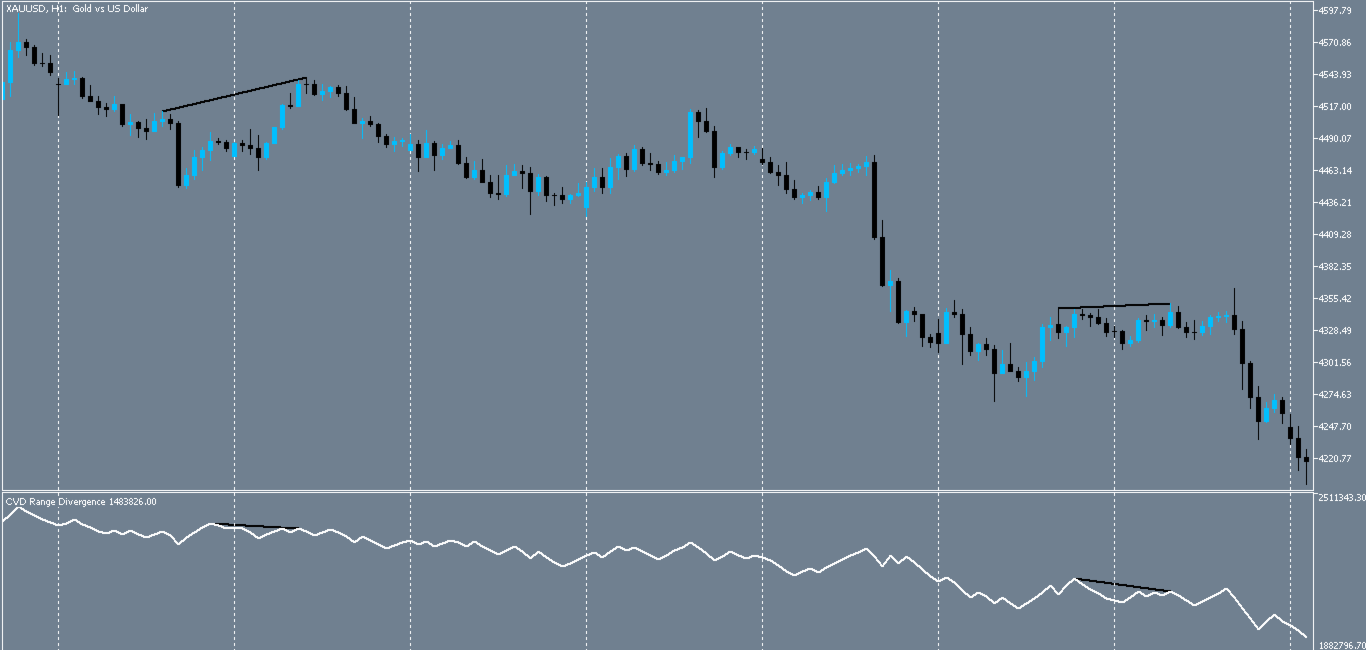
Visualization: Plots the CVD line in a separate window. Detected divergences are marked with colored trend lines (DeepSkyBlue for Bullish, Black for Bearish) on both the price chart and the CVD subwindow. Arrows can be optionally enabled on the main chart (disabled by default).
-
Smart Alerting: Built-in popup and push notification systems. The alert logic is strictly timestamp-bound to ensure you never receive spam about historical divergences when reloading the chart or switching timeframes.
-
Robust Design: The code handles input validation, logic resets when toggling calculation methods, and correctly renders objects in the intended sub-windows.



































This is good and helpful. Thank you for sharing.