Liquidity Cluster
- 指标
-
Churchill Thapelo Malesa
 Mr Churchill Thapelo Malesa, CAIA
Founder and Lead Developer, GIOTRADE Investment Solutions LLC - 版本: 1.0
- 激活: 10
Liquidity Clusters
Every retail trader in the world places their stop loss in the same place. Above the swing high. Below the swing low. This is not discipline. This is a pattern. And institutional participants exploit it on every timeframe, on every instrument, every single day.
Liquidity Clusters maps every one of those levels for you. Automatically. In real time. Before the move happens.
You will never again wonder where the next liquidity sweep is going. You will see it on the chart before the price gets there.
How It Works
The indicator scans your chart and identifies every significant swing high and swing low within a configurable lookback window. Above each swing high, it draws a buy-side liquidity zone, the exact price area where retail long positions are resting their stops and where breakout traders have placed their entries. Below each swing low, it draws a sell-side liquidity zone where short sellers have their stops and where breakdown traders are sitting.
These are not theoretical lines. They represent the precise price levels where a statistically predictable concentration of real stop orders has accumulated. This is the liquidity pool that informed large traders need to fill large positions. This is where price is engineered to go.
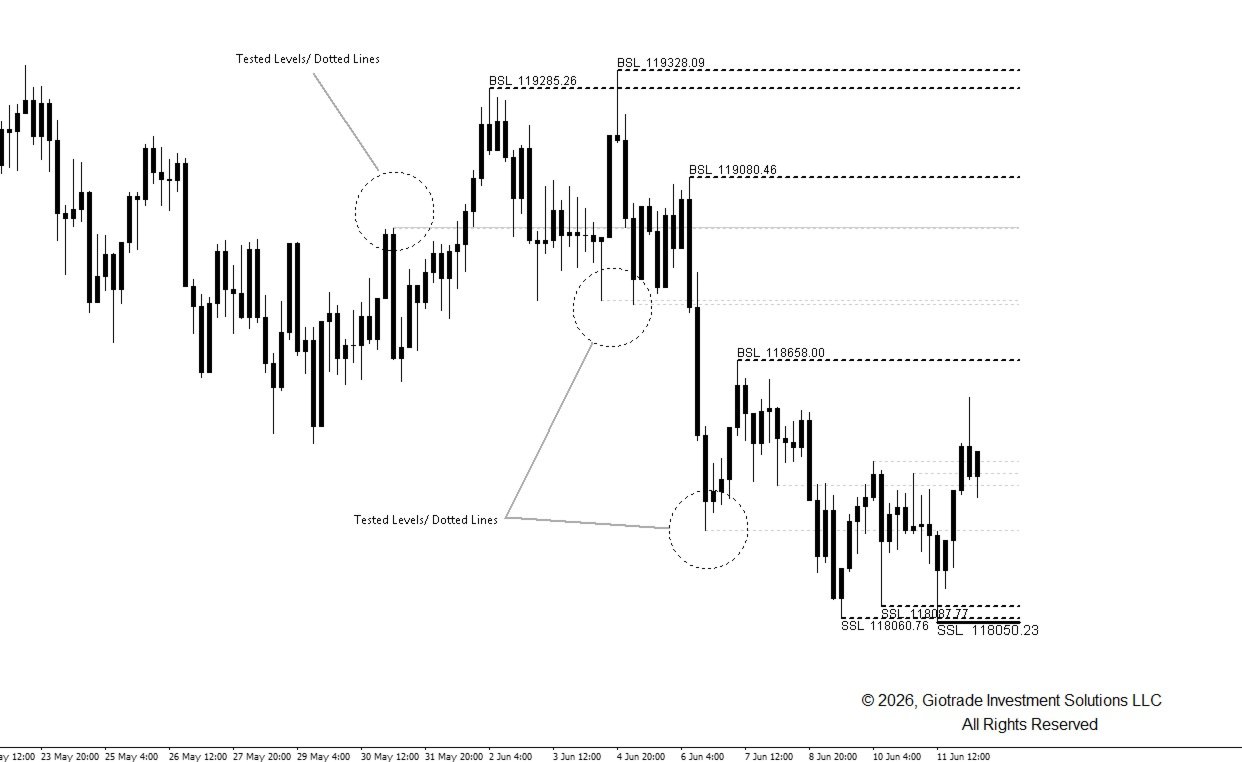
The moment price closes through a zone, the indicator detects the sweep and instantly reclassifies it as tested. The zone greys out. You are never looking at a level that has already been taken. Your chart stays clean, current and actionable at all times.
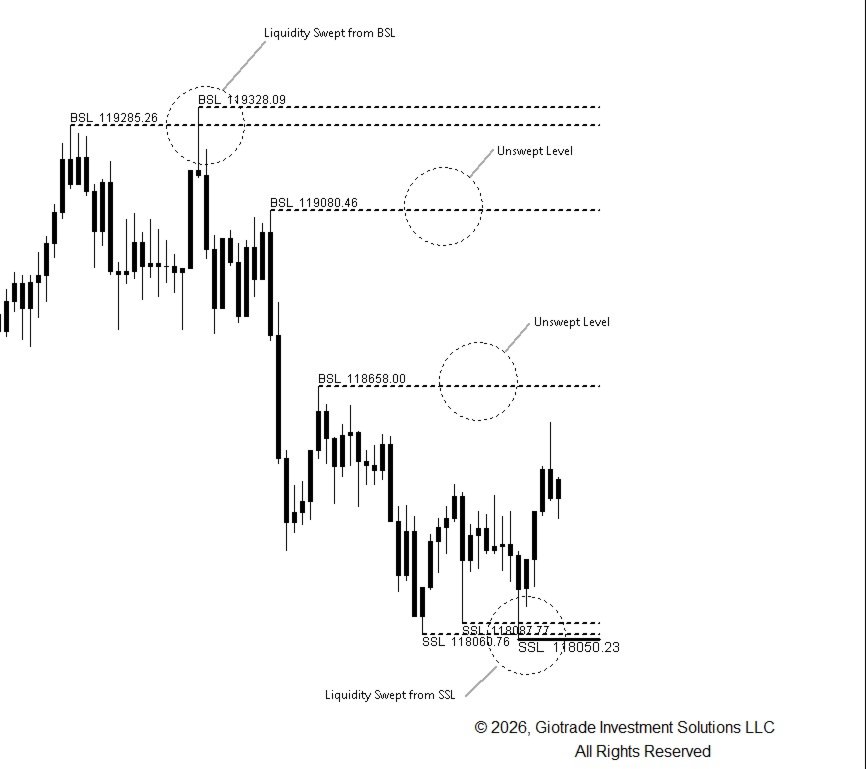
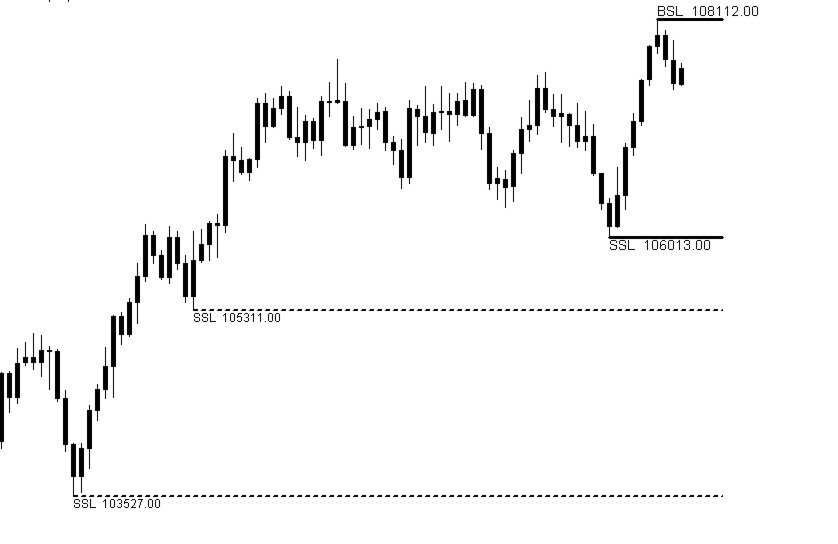
What You See On The Chart
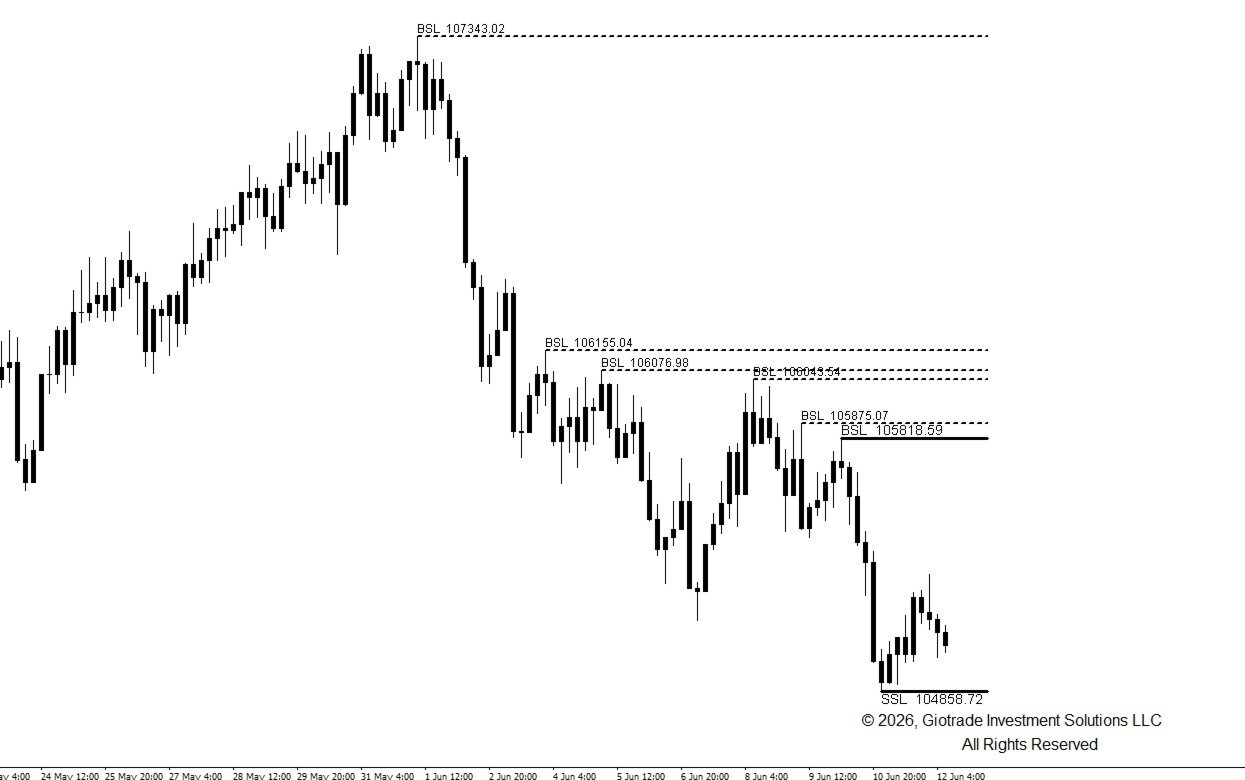
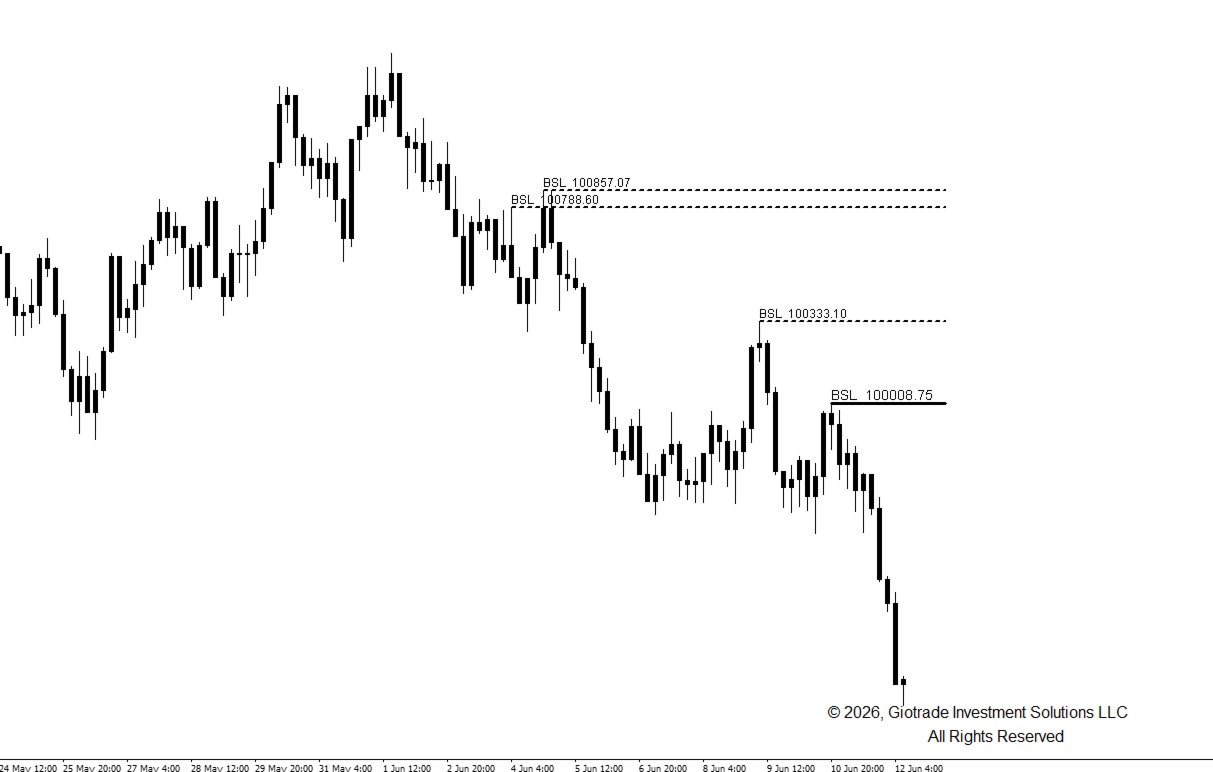
Buy Side Liquidity (BSL) Zones plotted above swing highs. Long stop orders and breakout entries rest here. Institutional short sellers drive price up into BSL to trigger those stops and fill their positions at the liquidity provided. Displayed in gold. These are your upside targets and your short entry confluences.
Sell Side Liquidity (SSL) Zones plotted below swing lows. Short stop orders and breakdown entries rest here. Institutional buyers accumulate positions by pushing price down into SSL, sweeping stops, then reversing hard. Displayed in blue. These are your downside targets and your long entry confluences.
Tested and Swept Levels The moment price closes through a zone boundary the level is reclassified as swept. The line shifts to grey and dotted immediately. No manual management. No stale levels cluttering your chart. You always know exactly which pools of liquidity are live and which have been taken. You can also hide swept levels entirely with a single setting.
Zone Labels Every active zone is labelled with its type and exact price level in IBM Plex Mono. Clean. Precise. Professional. Labels are suppressed on tested levels so your focus stays on what matters.
Key Features
Automatic swing pivot detection with configurable lookback and pivot strength
Buy side and sell side liquidity zones rendered simultaneously across the full chart
Live sweep detection that greys out zones the instant price closes through them
Configurable zone height in points so you can tune the indicator to any instrument's volatility profile
Up to four active levels per side so you always see the full liquidity stack
Option to hide swept levels completely for a clean uncluttered workspace
Full independent color customization for buy zones, sell zones and tested levels
Newest zone emphasized with a bolder line weight so your eye goes straight to the most relevant level
IBM Plex Mono price labels on every active zone
Compatible with every symbol — Forex, Gold, Indices, Crypto, Synthetic Indices
Pure MQL5 with no DLL and no external data feed required
What You Can Do With It
Catch the sweep and reverse When price approaches an untested SSL or BSL zone, sweeps through it and prints a reversal candle, the zone greys out in real time confirming the hunt is complete. It is one of the highest probability setups in modern price action trading and this indicator flags every single one.
Stack it with your existing confluences Overlay Stop Loss Clusters on top of your Order Blocks, Value Gaps and Break of Structure confirmations. When a BSL zone sits directly above an Order Block or inside a value gap, the confluence is institutional grade. You are no longer guessing at targets. You are reading the map that smart money is already following.
Know your targets before you enter Already in a short? The nearest untested SSL zone below current price is your most statistically valid first target. Institutional sellers are engineering price toward that liquidity before reversing or continuing. Stop guessing where to take profit. Let the liquidity map tell you.
Read trend strength in real time When price sweeps a BSL zone and keeps going without reversing, that is genuine bullish strength. The market absorbed the supply at the sweep and continued higher. When price sweeps and immediately rejects, that is the stop hunt. The indicator shows you which one is happening as it happens.
See the full liquidity stack above and below With up to four levels per side active simultaneously, you see the complete picture of where liquidity is resting across the structure. You know exactly which level is most likely to be targeted next and which ones are already off the table.
Installation
Purchase and download the indicator file
In MT5 go to File then Open Data Folder then MQL5 then Indicators
Copy the file into the Indicators folder
In the MT5 Navigator panel right click Indicators and select Refresh
Drag the indicator onto any chart
Configure pivot strength, zone height and maximum levels to suit your trading style and your instrument
About GioTrade Investment Solutions
GioTrade Investment Solutions is a South African financial services company specialising in investment management, trading research and proprietary financial software development. Our tools are built for professional traders who demand institutional grade analysis inside the platforms they already use every day.
© 2026 GioTrade Investment Solutions LLC
Churchill T. Malesa, CAIA