Titan SMC Ultimate

Titan SMC Ultimate Suite v6.5 — Kurumsal Sürüm Çıkış Notları:

- 4-Corner Institutional SMC Kokpit & MTF Radar: Kullanıcı tarafından sabitlenebilir (Üst-Sol, Üst-Sağ, Alt-Sol, Alt-Sol, Alt-Sağ) performans HUD eklendi; canlı Gerçek Sıçrama Kazanma Oranı (%), Ortalama Kar (Pips/Puan), İşlem Aralığı Premium/İndirim Oranı ve gömülü 5-Zaman Dilimi (M5-D1) BOS/CHoCH hizalama çubuğu eklendi.

- Sıfır Çarpışma Bölgesi ve Likidite Etiketleme: Emir Blokları (BULL/BEAR OB), Adil Değer Boşlukları (FVG) ve BSL/SSL (Duraklar) hatları için yeniden tasarlanmış metin çapa pozisyonları, böylece etiketler grafikte asla örtüşmemelidir.

- Geliştirilmiş Zen Modu Azaltma ve Hedef Tışınları: Geçersiz bölgeler için gerçek zamanlı azaltma kaldırma yükseltilmiş ve kazanan zıplama oklarında yeşil işaretli altın çizgili Take-Profit projeksiyon çizgileri eklenmiştir.


Titan SMC Ultimate Suite

Titan SMC Ultimate Suite, yüksek hassasiyet, netlik ve yapısal doğruluk sağlamak üzere tasarlanmış hepsi bir arada Smart Money Concepts (SMC) analitik çerçevesidir. Gelişmiş bir Piyasa Yapısı motorunu kapsamlı likidite arama mekanizmalarıyla entegre ederek, bu paket yatırımcılara birleşik bir teknik matris sunar ve birden fazla örtüşen gösterge ihtiyacını ortadan kaldırır.

6.00 sürümünde yenilikler:

Çekirdek motor sıfırdan yeniden tasarlandı ve giriş parametreleri içinde sezgisel bir "Master Switch" Kullanıcı Arayüzü eklendi. Bu, yatırımcıların Piyasa Yapısı (BOS/CHOCH), Adil Değer Boşlukları (FVG'ler), Sipariş Blokları (OB) ve Likidite Havuzları gibi bireysel yapısal unsurları anında değiştirmelerine olanak tanır ve böylece özel analitik gereksinimlere göre tamamen özelleştirilmiş bir grafik ortamı oluşturulmasını sağlar.

Temel Özellikler:

  • Otomatik likidite hedefleri (BSL/SSL): Dinamik Buyside Likidite (BSL) ve Sellside Likidite (SSL) havuzlarını otomatik olarak tanımlar ve projeksiyon yapar; yüksek olasılıklı kurumsal mıknıtış bölgelerini ve kar hedeflerini vurgular.

  • Hassas Piyasa Yapısı: Gerçek zamanlı, yeniden boyanmayan Yapı Kırılması (BOS) ve Karakter Değişikliği (CHOCH) tespitine, sıkı mum gövdesi kapanış doğrulama mantığına dayanır.

  • Dinamik azaltma motoru (zen modu): Korumalar, fiyat hareketiyle tamamen azaltıldığında Adil Değer Boşlukları ve Sipariş Bloklarını otomatik olarak kaldırır veya ortadan kaldırır.

  • Yapısal Zıplama Doğrulama Okları: Ana bölgelerdeki şamdanları (pin barları ve yutucu desenler gibi) izleyen bir fiyat eylemi doğrulama modülü içerir. Yapısal reddetme doğrulandığında net bir yön oku basar.

  • Optimize Çekirdek Mimarisi: Yüksek optimize edilmiş çok iş parçacıklı çalıştırma özelliğine sahiptir; bu özellik, karmaşık SMC verilerinin geniş tarihsel çubukları işlenirken bile stabil terminal performansı ve minimum gecikme sağlar.

Ticaret Uygulaması ve Stratejisi:

  1. Likidite Süpürmesi: Büyük bir Likidite Havuzunu (BSL veya SSL) süpüren bir genişleme için piyasayı takip edin.

  2. Yapısal Değişim: Yön yanlılığı oluşturmak için mum gövdesi yakınında onaylanan karşı trend Karakter Değişikliği (CHOCH) bekleyin.

  3. Bölge Tanımlaması: Yapısal değişimin geride bıraktığı yeni oluşan, dengesiz Adil Değer Boşluklarını veya Sipariş Bloklarını bulun.

  4. Onay ve Uygulama: Fiyat bu prim/indirim bölgelerine geri çekildiğinde ve girişi yapısal bir sıçrama oku ile doğruladığında pozisyonları gerçekleştirin.

Önerilen Konfigürasyonlar:

  • Desteklenen Varlıklar: Büyük döviz çiftleri (FX Majors), Hisse Senedi Endeksleri (örneğin NASDAQ, US30) ve yüksek likiditeli Kripto Para Yatırımları (BTCUSD, ETHUSD) için optimize edilmiştir.

  • Zaman Dilimleri: M15'in gün içi uygulama ve giriş iyileştirmesi için kullanılması, H1 ve H4 grafiklerinin makro yön önyargısı için izlenmesi şiddetle tavsiye edilir.


推荐产品
Non-proprietary study of Joe Dinapoli used for trend analysis. The indicator gives trend signals when the fast line penetrates the slow line. These signals remain intact until another penetration occurs. The signal is confirmed at the close of the period. It is applicable for all timeframes.   Inputs lnpPeriod: Period of moving average. lnpSmoothK: %K period. lnpSmoothD: %D period.                                       *****************************************************************************
FREE
Non-proprietary study of Joe Dinapoli used for trend analysis. The indicator gives trend signals when the fast line penetrates the slow line. These signals remain intact until another penetration occurs. The signal is confirmed at the close of the period. It is applicable for all timeframes.   Parameters Fast EMA: period of the fast moving average. Slow EMA: period of the slow moving average. Signal EMA: period of the signal line.                              ************************************
FREE
Great Indicator
Ruben David Santana Rodriguez
Les presento un indicador que funciona como estrategia por si solo , trabaja muy bien en periodos de 4 horas pero puedes aplicarlo a cualquier timeframe , las señales son muy faciles de interpretar , en momento en que la linea naranja pasa hacia arriba las media azul y roja , se entra en largos , la operativa se mantiene abierta hasta que la linea naranja cruce la media mas cercana ya sea la azul o la roja , si la operacion era long y la linea azul cruza hacia arriba la linea roja y la naranja c
Introduction to Chart Pattern MT Chart Pattern MT is a chart pattern scanner to detect the triangle pattern, falling wedge pattern, rising wedge pattern, channel pattern and so on. Chart Pattern MT uses highly sophisticated chart pattern detection algorithm. However, we have designed it in the easy to use with intuitive user interface. Chart Pattern MT will show all the patterns in your chart in the most efficient format for your trading. You do not have to do tedious manual pattern detection an
该指标旨在与艾略特波浪理论相结合,提供了两种不同的工作方式: 自动工作: 在此模式下,指标会自动检测图表上的所有五个动机波浪,并为您提供预测和潜在的逆转区域。它还可以提供警报和推送消息。这种自动功能简化了识别和分析艾略特波浪模式的过程。 手动工作: 此选项适用于喜欢手动方法的交易员,用于手动绘制九个不同等级的波浪。每个等级都可以在它们出现后通过调整图表上的绘制线条来单独定义。此功能简化了手动绘制波浪的过程,使其更加高效。需要注意的是,所有绘图数据将保存在平台的数据文件夹中,以备将来参考。 参数: Name: 指标名称。 Use_System_Visuals: 启用或禁用指标主题,以匹配交易平台的整体外观。 Explain_Comment: 允许启用或禁用波浪编号的解释性注释,有助于理解已识别的波浪。 Show_Last_Candle_Counter: 启用或禁用蜡烛计时器,提供有关当前蜡烛收盘的剩余时间的信息。 Candle_Counter_Color: 蜡烛计时器文本的颜色。 Basic_Wave_Color: 用于表示波浪的主要颜色。 Bullish_Wave_Color: 当检测
MACD Divergence Finder
Segundo Calvo Munoz
MACD Divergence Finder Indicator will help you to find Divergences between your typical MACD values and the Chart Prices as potential points of actual Trend Reversion or Pull Backs to increase your positions as per the current Trend. Indicator Windows draws MACD value and Divergence arrows but not MACD Signal as it is not considered relevant to detect this kind of Classic Divergences. In some computer/VPS with old microprocessors or low RAM size, when you launch this Indicator (attach it, change
El indicador "MR BEAST ALERTAS DE LIQUIDEZ" es una herramienta avanzada diseñada para proporcionar señales y alertas sobre la liquidez del mercado basándose en una serie de indicadores técnicos y análisis de tendencias. Ideal para traders que buscan oportunidades de trading en función de la dinámica de precios y los niveles de volatilidad, este indicador ofrece una visualización clara y detallada en la ventana del gráfico de MetaTrader. Características Principales: Canal ATR Adaptativo: Calcula
交易会话时间指示器: “交易会话时间指示器”是一个强大的技术分析工具,旨在增强您对外汇市场中不同交易会话的理解。这个无缝集成的指标提供了关于主要交易会话的开盘和收盘时间的重要信息,包括东京、伦敦和纽约。通过自动时区调整,它为全球交易者提供服务,帮助他们优化交易时间表,以获取高流动性时段,并避开低活跃时段。该指标提供了关于市场情绪、高峰波动期和交叠交易会话的见解,帮助日内交易者做出与其策略一致的精确决策。其可定制的显示允许个性化用户体验,其交易时段数据可用于制定交易计划。通过提高低活跃时段的意识,该指标帮助交易者避免过度交易,并专注于优质机会。适用于 MetaTrader 4,“交易会话时间指示器”是寻求优化交易路程的交易者的宝贵工具。 特点: - 优化的时间表:提供主要交易会话时间,并与高流动性相符。 - 电话和电子邮件提醒:在会话开始时提醒您。 - 杀伤区域:使用警报设置ICT风格的杀伤区域。 - 重叠分析:探索会话重叠并针对活动增加。 - 日内精度:帮助日内决策并关注与策略一致的会话。 - 可定制的显示:个性化偏好和颜色设置。 - 避免过度交易:提高低活跃意识并优先考虑质量
FREE
Skynet Lasso
Roman Yablonskiy
This indicator displays entry and exit points in the market. The indicator is based on Parabolic and various mathematical and statistical methods to increase profitability and reduce the number of losing trades. The indicator helps in many cases to skip false inputs, the support and resistance lines go around the price in a certain mode, reducing losses. The dashboard shows the results of the indicator so that you can adjust it more accurately and see how the parameters affect the result. The n
Teknolojide ki yüksek gelişim, üretim, e ticaret, lojistik vb tüm sektörlerde kullanıma başlandığı gibi artık finansal piyasalarda da “ yapay zeka ve algoritma” kullanılmaya başlandı. Smart Algoritma indikatörü; kaynak kodu içinde yer alan algoritma ve yapay zekası ile hiçbir analize ihtiyaç duyulmadan gün içi bütün forex enstrümanları için size buy ve sell sinyalleri yanında hedef kanal (gün içi en yüksek ve en düşük seviyeler) verir. İndikatör texti aşağıda ki bölümlerden oluşur ve herkesin a
Equity Performance Analyzer
Frank William Jr Colbert
Have patterns that drive your trading success or failure. The Equity Performance Analyzer breaks down your trade history by symbol, day of the week, and hour of entry to identify exactly when your strategies perform best and worst. It ranks every possible trading pattern (e.g., "EURUSD-BUY-Mon-14") by Net Profit, Win Rate, Return/Drawdown, and a Monte Carlo Proxy. More than just an analytics tool, it generates ready-to-use input parameters for your EAs and a crucial "Worst Patterns to Avoid" se
MQLTA Currency Strength Matrix
MQL4 Trading Automation
4.38 (8)
Currency Strength Matrix (CSM) is an indicator that will show you the current strength of the major currencies in several timeframes, allowing you to sort the currencies for strength and spot possible trading setups. This indicator is ideal for scalping and in all those events of sudden big moves. How does it work? The CSM compares the value of the current moving average with the same moving average in the previous candle for all the 28 pairs and all 9 timeframes, producing a Matrix of Strength
FREE
Introduction to X3 Chart Pattern Scanner X3 Cherart Pattern Scanner is the non-repainting and non-lagging indicator detecting X3 chart patterns including Harmonic pattern, Elliott Wave pattern, X3 patterns, and Japanese Candlestick patterns. Historical patterns match with signal patterns. Hence, you can readily develop the solid trading strategy in your chart. More importantly, this superb pattern scanner can detect the optimal pattern of its kind. In addition, you can switch on and off individu
Mr Beast Cobertura
Luis Mariano Vazquez Marcos
Mr Beast Super Hedge Asesor experto diseñado para trabajar encerrando el precio entre 2 valores hasta que rompa en una dirección tanto de compra como de venta. Este robot de trading de Forex ha sido desarrollado por MRBEAST como una herramienta para facilitar el trading intradía. Tenga en cuenta que el uso de este robot implica ciertos riesgos y no garantiza ganancias consistentes en el mercado de divisas. El robot de trading se basa en algoritmos y estrategias que he diseñado, los cuales se han
SuperTrend EA is an expert advisor or trading robot based on the Supertrend Buy-Sell Magic Indicator. It is capable of detecting and following both minor and major trends. SuperTrend EA MT4 is obtained from artificial intelligence algorithms developed by MXRobots company. This EA, in addition to the SuperTrend indicator, includes other instruments that contribute to the activities of this intelligent trading robot, which you can experience Algo Trend EA (supertrend algo trading). SuperTrend EA
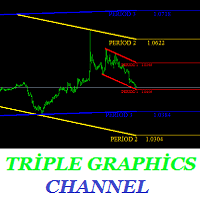
Are you tired of channeling? This indicator is designed to draw channels. Triple graphics channels, automatically installs 3 different graphics channels. These channels are shown on a single graphic. These channels are calculated by a number of different algorithms. Automatically draws on the screen. You can select three time zones. Parameters Period1 - from here you can select the first period. It can be selected from 1 minute time period to monthly time period. Period1_Channel_Color - period1
Gioteen Volatility Index (GVI)   - your ultimate solution to overcoming market unpredictability and maximizing trading opportunities. This revolutionary indicator helps you in lowering your losing trades due to choppy market movements. The GVI is designed to measure market volatility, providing you with valuable insights to identify the most favorable trading prospects. Its intuitive interface consists of a dynamic red line representing the volatility index, accompanied by blue line that indicat
Wolfe Wave Scanner MT4
Reza Aghajanpour
4.64 (11)
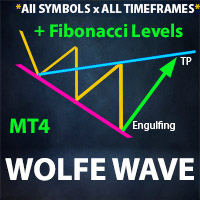
**  All Symbols  x  All Timeframes  scan just by pressing scanner button ** *** Contact me  to send you instruction and add you in "Wolfe Wave Scanner group" for sharing or seeing experiences with other users. Big Update: 2026/10/24 Introduction: A Wolfe Wave is created with five-wave patterns in price. It shows supply and demand and a fight towards a balance price. T hese waves of price actions can help traders identify the boundaries of   the trend . Also  It helps forecast how the price will
WARNING: PRICE IS SUBJECT TO RISE AT ANY TIME. GET YOUR COPY TODAY TO AVOID MORE COST! Dear Traders I am so glad to introduce to you my other tool called the Forex Sniper Entries Indicator. This tool is designed to help serious traders and investors capture big moves in the currency price movements. The philosophy behind this tool is all about winning big and riding the price movement from its beginning until the maximum point. We want to capture those big moves in both down and up markets as mu
Relative Trend Index
Mahdi Ebrahimzadeh
指标从另一种编程语言转换为 MQL。RTI 是以震荡方式识别图表趋势的强大工具。 以下是原始程序员的一些说明: 概述 由 Zeiierman 开发的相对趋势指数 (RTI) 是一种创新的技术分析工具,旨在衡量市场趋势的强度和方向。与某些传统指标不同,相对趋势指数具有独特的适应能力,能对市场波动做出反应,同时还能将微小的短期市场波动的影响降至最低。 相对趋势指数融合了趋势跟踪和均值回复的特点,并采用可定制的直观方法来衡量趋势强度,其对价格走势的敏感性使该指标脱颖而出。 使用该相对强弱指标代替 RSI 的好处 相对强弱指数 (RSI) 和相对趋势指数 (RTI) 都是强大的技术指标,各有千秋。 不过,RTI 与相对强弱指数有一些关键的不同之处,尤其是在识别趋势和超买/超卖(OB/OS)区域方面,RTI 可以说更加复杂和精确。
GP Confluence Scanner MT4 Advanced Multi-Timeframe Market Structure & Confluence Analysis Don't get stopped out easily again! GP Confluence Scanner MT4 is an advanced technical analysis indicator developed for MetaTrader 4, designed to reveal important market levels, hidden support and resistance, and multiple technical confluences before entering a setup. Rather than relying on a single indicator, GP Confluence Scanner combines multiple analytical techniques to identify areas where significant
Introduction to Harmonic Volatility Indicator Harmonic Volatility Indicator is the first technical analysis applying the Fibonacci analysis to the financial volatility. Harmonic volatility indicator is another level of price action trading tool, which combines robust Fibonacci ratios (0.618, 0.382, etc.) with volatility. Originally, Harmonic Volatility Indicator was developed to overcome the limitation and the weakness of Gann’s Angle, also known as Gann’s Fan. We have demonstrated that Harmonic
该软件工具旨在简化以您选择的五种可自定义颜色创建水平趋势线和矩形的过程。 在 MT5 中绘制精确的水平趋势线可能具有挑战性,但使用此指标,您可以轻松地以适合您偏好的颜色创建它们。 此外,我们的工具还可以清晰显示与您绘制的水平线相关的价格水平。 我们重视您的反馈,并希望您发现该工具成为满足您交易需求的宝贵资产。 请随时与我们分享您的想法。 .......................................................................................... ..........................................................................................
DigiGrid EA
Sergey Belov
5 (2)
The Expert Advisor builds a grid of orders at prices near support or resistance levels. Entry points are calculated by the EA using the author's algorithm and based on a variety of factors. The EA uses several time ranges for analysis. The built-in trend filter allows to make more accurate entries with a greater likelihood of closing them with profit and thus reducing the number of simultaneously open orders. All orders are closed upon reaching the expected profit. Through the use of TakeProfit
Ultimate pattern builder indicator Allows you to build any pattern with up to 3 candlesticks (+ special fourth). This indicator is special because you can create any pattern you want, by modifying body and both wicks separately to your needs. If you ever wanted to create your own patterns , or just adjust any known popular pattern, then this is perfect for you. With this indicator you can learn how to build candles, testing it in strategy tester and get marked new candles on realtime charts, ho
FREE
Colored Line Graph
Igor Semyonov
2.5 (2)
描述 这款指标在主要金融工具的窗口里绘制彩色线性市场情绪图表。  它有助于判断支撑和阻力级别。   目的 本指标可以用于手工,或自动交易 EA的一部分。对于自动交易, 您可用的指标数值缓存区为 双精度 类型:  上升线 - 缓存区 0, 必须不等于 EMPTY_VALUE。 下降线 - 缓存区 1, 必须不等于 EMPTY_VALUE。
FREE
A   rocket   (from   Italian :   rocchetto ,   lit. 'bobbin/spool') [nb 1] [1]   is a   projectile   that   spacecraft ,   aircraft   or other   vehicles   use to obtain   thrust   from a   rocket engine . Rocket engine exhaust is formed entirely from   propellant   carried within the rocket. [2]   Rocket engines work by   action and reaction   and push rockets forward simply by expelling their exhaust in the opposite direction at high speed, and can therefore work in the   vacuum   of space. In
Divergence Matrix Pro for MetaTrader 4 Divergence Matrix Pro is a confirmed multi-oscillator divergence indicator for MetaTrader 4. It detects regular and hidden divergence between price and selected oscillators, then presents the confirmed structure through divergence lines, pivot labels, action markers, an optional current-timeframe Matrix Panel and optional alerts. The indicator is an analysis and confirmation tool. It does not open or close trades, and the signal score is not a win rate or a
Elliott Wave Trend MT4
Young Ho Seo
4 (7)
Elliott Wave Trend was designed for the scientific wave counting. This tool focuses to get rid of the vagueness of the classic Elliott Wave Counting using the guideline from the template and pattern approach. In doing so, firstly Elliott Wave Trend offers the template for your wave counting. Secondly, it offers Wave Structural Score to assist to identify accurate wave formation. It offers both impulse wave Structural Score and corrective wave Structure Score. Structural Score is the rating to sh
Fusion Cross
Adolfina Denysenko
Fusion Cross 是一款适用于 MetaTrader 4 的现代箭头指标,融合了多种成熟工具的优势。 WPR(威廉姆斯百分比范围); RSI(相对强弱指数) 这些工具的组合能够生成高度精准的市场入场信号,有效过滤虚假信号,仅显示趋势反转或延续概率较高的关键点位。 核心功能: 图表上直接显示清晰的买入/卖出箭头信号 即时通知 声音警报 电子邮件 手机推送通知 ️自定义信号触发时机:可选择在K线开盘时或收盘后触发(通过参数设置)。 适用于任意周期和货币对。 操作简易:安装后即可直接跟随信号进行交易。 工作原理: 指标通过 WPR 指标追踪超买/超卖状态。 借助RSI指标过滤虚假信号。 当市场即将上涨时,会出现蓝色向上箭头; 红色向下箭头则提示可能下跌。 Fusion Cross 因此能够帮助交易者提前捕捉趋势反转或延续的信号。 核心优势: 信号永不重绘(箭头位置固定不变); 兼容短线剥头皮与中期交易策略 多货币支持,适用于所有交易品种(包括但不限于: 外汇、黄金、指数、加密货币)。
该产品的买家也购买
Miraculous Indicator Binary & Forex v3 StrategySafe Miraculous Indicator Binary & Forex v3 StrategySafe 是一款专业交易指标,适合希望获得清晰信号、强大确认工具以及结构化交易方式的 Binary 和 Forex 交易者。 v3 版本加入了 MIR Dashboard、Miraculous Confirmation Dashboard、GANN Law、Square of 9 水平线、GANN 角度以及更强的 Forex 分析模式。 核心功能 同时支持 Binary 和 Forex 交易模式。 MIR Dashboard 可快速读取市场状态。 Miraculous Confirmation Dashboard 用于确认交易机会。 GANN Law drawing lines 用于 Forex 市场结构分析。 Square of 9 线条、方向和关键价格水平。 1x1 GANN Angle 用于判断趋势压力。 Entry Information TP 帮助寻找合理止盈区域。 Strateg
OrderFlow Absorption – 專業級MT4買賣差與吸收訊號指標 釋放真正訂單流分析的力量,OrderFlow Absorption 是MetaTrader 4上最強大的買賣差(Delta)直方圖與吸收訊號指標。專為想看清每一個價格波動背後真相的交易者設計,這個工具揭示了隱藏的買賣壓力與推動市場的吸收事件。 功能特色 買賣差直方圖視覺化:   以清晰的色彩直方圖即時顯示買方與賣方壓力。 吸收訊號偵測:   先進邏輯自動辨識多空吸收事件,及早預警潛在反轉。 圖表標記:   吸收訊號直接標示於主圖表,方便視覺辨識。 彈出式警報:   新吸收訊號出現時即時通知。 自訂門檻:   過濾弱訊號,專注高勝率機會。 資源管理:   高效運算,適用於大型圖表也能流暢運行。 全品種兼容:   適用於任何商品與週期,包括外匯、指數、商品等。 簡易整合:   參數簡單,快速上手與調整。 OrderFlow Absorption 的邏輯說明 OrderFlow Absorption 採用專利演算法,能在沒有完整Tick數據的情況下,估算每根K棒的買賣壓力(Delta)。它分析成交量、價格行為、K
Meravith
Ivan Stefanov
5 (3)
做市商工具。 Meravith 将: 分析所有时间周期并显示当前正在运行的趋势。 标注流动性区域(成交量均衡区),即多头与空头成交量相等的位置。 在您的图表上直接显示来自不同时间周期的所有流动性水平。 生成并展示基于文本的市场分析供您参考。 根据当前趋势计算目标位、支撑位和止损位。 计算交易的风险回报比。 根据您的账户余额计算仓位大小,并估算潜在利润。 在市场出现重大变化时,Meravith 还会发出警告。 指标的主要线条: 多头/空头成交量衰竭线 —— 作为目标位使用。 趋势线 —— 指示市场趋势方向。根据市场是多头还是空头而改变颜色,并作为趋势支撑。其颜色主要反映市场情绪。 成交量均衡线(Eq)—— Eq(Volume Equilibrium)是系统的核心。它表示买卖双方成交量的平衡点,即市场流动性所在位置。向上突破 Eq 表示多头倾向,向下突破 Eq 表示空头倾向。突破后,应等待回调——当价格回到相反趋势的偏离线或衰竭线附近时。 使用方法:只需将其添加到图表中。 Meravith 可以分析一切——趋势和回调。 趋势线与某条成交量衰竭线之间的距离越大,说明该方向的成交量越高。 趋
First time on MetaTrader, introducing IQ Star Lines - an original Vedic Astrology based indicator. "Millionaires don't use astrology, billionaires do" . - J.P. Morgan, Legendary American financier and banker. We don't offer free or bonus indicators in exchange of reviews from you. You won't need any free products with this indicator to make it work. ;) Enjoy! Welcome to  the new and updated  IQ Star Lines , the ultimate fusion of ancient planetary harmonic cycles and modern quantitative trading.
CVD背離偵測 - 先進成交量能差分析   我們解決的問題 大多數交易者僅依賴價格走勢,錯過了揭示真實市場情緒的關鍵成交量流向信息。傳統指標滯後於價格變動,導致進場過晚和風險管理不佳。 CVD背離偵測 通過分析價格與成交量差動量之間的關係來解決這個問題,在重大市場變動之前為您提供早期預警信號。   CVD背離分析的優勢   早期市場逆轉偵測   - 在價格圖表出現之前發現動量轉變   智能資金追蹤   - 觀察機構何時累積或分配   減少虛假信號   - 成交量確認價格走勢,提供更高概率設置   多時間框架優勢   - 適用於所有時間框架,從剝頭皮到波段交易   通用應用   - 兼容外匯、股票、商品和加密貨幣   4個市場階段 - 真實交易故事 設想EUR/USD接近重要支撐位...   階段1:初始下跌(CVD在零線上方下跌) 價格從阻力位開始下跌 CVD信號下跌但保持在零線上方 解讀:   賣壓增強,但買方仍然存在   階段2:加速賣出(CVD跌破零線以下) 價格繼續向支撐位下跌 CVD信號跌破零線 解讀:   賣方佔主導,動量
FFx Engulfing Setup Alerter gives trade suggestions with Entry, Target 1, Target 2 and StopLoss. Below are the different options available: Entry suggestion - pips to be added over the break for the entry 3 different options to calculate the SL - by pips, by ATR multiplier or at the pattern High/Low 3 different options to calculate the 2 TPs - by pips, by ATR multiplier or at Risk/Reward Offset the dashboard - any place on the chart Remove the suggestion once the price reached the SL line Lines
FFx InsideBar Setup Alerter gives trade suggestions with Entry, Target 1, Target 2 and StopLoss. Below are the different options available: Entry suggestion - pips to be added over the break for the entry Minimum candle size - to avoid too close buy/sell entry suggestions 3 different options to calculate the SL - by pips, by ATR multiplier or at the pattern High/Low 3 different options to calculate the 2 TPs - by pips, by ATR multiplier or at Risk/Reward Offset the dashboard - any place on the c
FFx OutsideBar Setup Alerter gives trade suggestions with Entry, Target 1, Target 2 and StopLoss. Below are the different options available: Entry suggestion - pips to be added over the break for the entry. 3 different options to calculate the SL - by pips, by ATR multiplier or at the pattern High/Low. 3 different options to calculate the 2 TPs - by pips, by ATR multiplier or at Risk/Reward. Offset the dashboard - any place on the chart. Remove the suggestion once the price reached the SL line.
FFx PinBar Setup Alerter gives trade suggestions with Entry, Target 1, Target 2 and StopLoss. Below are the different options available: Entry suggestion - pips to be added over the break for the entry Minimum candle size - to avoid too small candles 3 different options to calculate the SL - by pips, by ATR multiplier or at the pattern High/Low 3 different options to calculate the 2 TPs - by pips, by ATR multiplier or at Risk/Reward Offset the dashboard - any place on the chart Remove the sugges
Lineverse Trendlines
Arkady Segal
5 (1)
Automatic, live & interactive picture of all trendlines. Assign push, email and sound alerts to the lines of your choice and be informed about price rollback, breakout, rollback after breakout, number of rollbacks, line expiration by double breakout. Correct, drag or delete the lines and interactively tune the line system. https://youtu.be/EJUo9pYiHFA . Chart examples https: //www.mql5.com/en/users/efficientforex Price Interaction Events All events are effective immediately and only after one
FFx MACD Divergences
Eric Venturi-Bloxs
The purpose of this new version of the MT4 standard indicator provided in your platform is to display in a sub-window multiple timeframes of the same indicator with its divergences. See the example shown in the picture below. But the display isn't like a simple MTF indicator. This is the real display of the indicator on its timeframe. Here's the options available in the FFx divergences indicator: Select the timeframes to be displayed (M1 to Monthly) Define the width (number of bars) for each tim
FFx RSI Divergences
Eric Venturi-Bloxs
The purpose of this new version of the MT4 standard indicator provided in your platform is to display in a sub-window multiple timeframes of the same indicator with its divergences. See the example shown in the picture below. But the display isn't like a simple MTF indicator. This is the real display of the indicator on its timeframe. Here's the options available in the FFx divergences indicator: Select the timeframes to be displayed (M1 to Monthly) Define the width (number of bars) for each tim
FFx CCI Divergences
Eric Venturi-Bloxs
The purpose of this new version of the MT4 standard indicator provided in your platform is to display in a sub-window multiple timeframes of the same indicator with its divergences. See the example shown in the picture below. But the display isn't like a simple MTF indicator. This is the real display of the indicator on its timeframe. Here's the options available in the FFx divergences indicator: Select the timeframes to be displayed (M1 to Monthly). Define the width (number of bars) for each ti
The FFx Dashboard MTF alerter will show you on a single chart all the timeframes (M1 to Monthly) with their own status for the indicator. 2 Alert Options: Single timeframe: each selected timeframe alert separately when a signal occurs Multi timeframes: all selected timeframes must agree for an alert to be triggered Both options have an input to select the timeframes to be used for the alert(s). How to Understand the Status: Green/Red square: histogram above/below 0 line Green square + Red bord
The FFx Dashboard MTF alerter will show you on a single chart all the timeframes (M1 to Monthly) with their own status for the indicator. 2 Alert Options: Single timeframe: each selected timeframe alert separately when a signal occurs Multi timeframes: all selected timeframes must agree for an alert to be triggered Both options have an input to select the timeframes to be used for the alert(s). How to understand the status: Green/Red square: RSI above/below 50 line Green square + Red border: R
The FFx Dashboard MTF alerter will show you on a single chart all the timeframes (M1 to Monthly) with their own status for the indicator. 2 Alert Options: Single timeframe: each selected timeframe alert separately when a signal occurs Multi timeframes: all selected timeframes must agree for an alert to be triggered Both options have an input to select the timeframes to be used for the alert(s). How to understand the status: Green/Red square: Stoch above/below 50 line Green square + Red border:
The FFx Dashboard MTF alerter will show you on a single chart all the timeframes (M1 to Monthly) with their own status for the indicator. 2 Alert Options: Single timeframe: each selected timeframe alert separately when a signal occurs Multi timeframes: all selected timeframes must agree for an alert to be triggered Both options have an input to select the timeframes to be used for the alert(s). How to understand the status: Green/Red square: Price above/below Cloud (Kumo) Green square + Red bo
The FFx Dashboard MTF alerter will show you on a single chart all the timeframes (M1 to Monthly) with their own status for the indicator. 2 Alert Options: Single timeframe: each selected timeframe alert separately when a signal occurs Multi timeframes: all selected timeframes must agree for an alert to be triggered Both options have an input to select the timeframes to be used for the alert(s). How to understand the status: Green/Red square: MA pointing Up/Down Green square + Red border: MA po
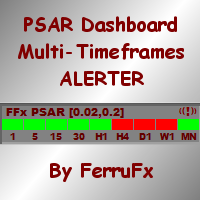
The FFx Dashboard MTF alerter will show you on a single chart all the timeframes (M1 to Monthly) with their own status for the indicator. 2 Alert Options: Single timeframe: each selected timeframe alert separately when a signal occurs. Multi timeframes: all selected timeframes must agree for an alert to be triggered. Both options have an input to select the timeframes to be used for the alert(s). How to understand the status: Green square: Price above PSAR Red square: Price below PSAR Options
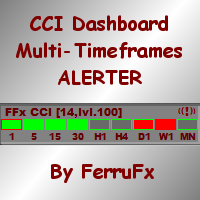
The FFx Dashboard MTF alerter will show you on a single chart all the timeframes (M1 to Monthly) with their own status for the indicator. 2 Alert Options: Single timeframe: each selected timeframe alert separately when a signal occurs Multi timeframes: all selected timeframes must agree for an alert to be triggered Both options have an input to select the timeframes to be used for the alert(s). How to understand the status: Green/Red square: CCI above/below levels (ie. 100/-100) Grey square: C
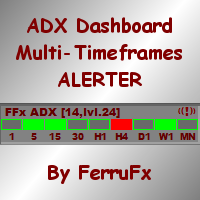
The FFx Dashboard MTF alerter will show you on a single chart all the timeframes (M1 to Monthly) with their own status for the indicator. 2 Alert Options: Single timeframe: each selected timeframe alert separately when a signal occurs Multi timeframes: all selected timeframes must agree for an alert to be triggered Both options have an input to select the timeframes to be used for the alert(s). How to understand the status: Green/Red square: ADX above level Grey square: ADX below level Red bor
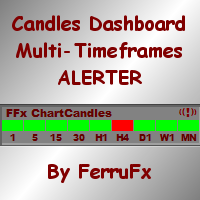
The FFx Dashboard MTF alerter will show you on a single chart all the timeframes (M1 to Monthly) with their own status. 2 Alert Options: Single timeframe: each selected timeframe alert separately when a signal occurs Multi timeframes: all selected timeframes must agree for an alert to be triggered Both options have an input to select the timeframes to be used for the alert(s). How to understand the status: Green/Red square: bullish/bearish candle Options available in the FFx Dashboard Alerter
The indicator of a Professional Trader is an arrow indicator for predicting the direction of price movement. I have been working on this indicator since 2014. You can use this indicator as your main indicator, use its entry signals, and use it as your only indicator to find entry points. About the product: Recommended TF [H4-D1-W1]   . The indicator predicts the direction of the next candle. Fits a variety of tools; Flexibility in settings for different instruments and intervals through the MO
THE GRAFF III
Charles Harper
The [GRAFF] III manual trading system is based on multiple MetaTrader (MT4) indicators. Together, the entire PACK of GRAFF III indicators makes an advanced trading tool. The system consists of over 20 different custom-built indicators which have been carefully selected and tested in the long term to produce strong and efficient trading signals. The particular indicators are based on different mathematical formulas, so the entire system is calibrated to remove false signals from its own indicator
This indicator allows you to see the strength of the trend on all timeframes. It can be used for all currency pairs. The indicator can be displayed in the form of a column (from left to right): status buy / sell / strong buy / strong sell, strength of the trend in percentage, pips last candle, body candle now, remaining time, and the timeframe of M1 to MN. Information contained below (from left to right): total trend percent, sell percent, buy percent.
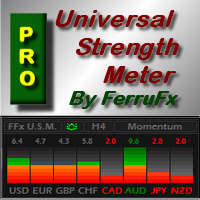
FFx Universal Strength Meter PRO is more than a basic strength meter. Instead of limiting the calculation to price, it can be based on any of the 19 integrated strength modes + 9 timeframes. With the FFx USM, you are able to define any period for any combination of timeframes. For example, you can set the dashboard for the last 10 candles for M15-H1-H4… Full flexibility! Very easy to interpret... It gives a great idea about which currency is weak and which is strong, so you can find the best pai
A simplistic indicator informing a user on RSI divergence by sending messages to mobile device and email. The indicator draws 2 vertical lines, marking two RSI extrema that formed the divergence. You get the alert, open the charts and make a decision. The indicator does not show past divergences, thus when you attach it to a chart for the first time you see nothing. Graphics and alerts will appear as soon as divergences do. Drop it in Tester to see how it works. Parameters: RSIPeriod - number of
ZLevels
Sergio Andres Zuleta Lopez
This indicator is based on Market Profile methodology, which contains the Z-Zone , unlike the latter, allows visualization of multiple time frames on the same graph. This methodology has proven to be very effective for: Reduce the number of windows required to analyze or track a financial asset. Display important resistance areas (ROZ), support (SoZ) and average distribution (PoC) in different periods of time. Define areas to take profits as well locate technical stop loss. Analysis in the devel
作者的更多信息
Titan AstroCycle & Gann Time Utility is a 100% FREE educational and analytical time-cycle tool for MetaTrader 5, inspired by William D. Gann's harmonic time principles and quantitative lunar/solar cycle research. While 95% of technical indicators focus exclusively on PRICE (where the market is), institutional cycle analysis focuses on TIME (when volatility inflection points and trend exhaustion windows are statistically likely to occur). Titan AstroCycle maps both macro Synodic Lunar Phases an
FREE
Titan Prop-Firm Shield & Lot HUD is a 100% FREE institutional risk-management and position-sizing cockpit designed specifically for Prop-Firm traders (FTMO, FundedNext, The5ers, etc.) and disciplined retail traders on MetaTrader 5. Over 90% of prop-firm challenges fail due to accidental Daily Drawdown breaches or miscalculated lot sizes during high volatility. Titan Prop-Firm Shield eliminates human error by tracking your real-time Daily Drawdown, Overall Drawdown, Remaining Loss Buffer ($), a
FREE
Titan Z-Score Pro v3.2 Sürüm Notları: Kurumsal UI/UX Yeniden Tasarımı: Performans kokpitleri ve MTF matrisleri ana harita köşelerine taşındı, böylece tertemiz, dağınıklıktan arındırılmış bir alt pencere görünümü sağlandı. Canlı Kazanma Oranı ve Geri Dönüş Kokpiti: Ortalama geri dönüş başarı oranının ve kazanılan ortalama piplerin gerçek zamanlı takibi eklendi. Çok Zaman Dilimi Z-Puan Matrisi: Ana tabloya doğrudan görsel olarak 5 zaman dilimli (M5'ten D1'e) bir durum ızgarası entegre edildi. Yeni
Titan Oturum Öldürme Bölgeleri Smart Money Concepts (SMC) veya Market Profile yöntemlerini kullanan her profesyonel yatırımcı, zamanlamanın fiyat teslimatında kritik bir unsur olduğunu bilir. Asya birikimi, Londra manipülasyonu ve New York dağılımı algoritmik gün içi fiyat hareketinin temel sütunlarını oluşturur. Titan Session Killzones, bu kritik işlem pencerelerini temiz, profesyonel ve müdahaleci olmayan bir görsel düzen kullanarak doğrudan grafiğinize yansıtır. Temel Özellikler: Gelişmiş Oto

FREE
=== TITAN NADARAYA REVERSION EA — VERSION 3.00 (MAJOR INSTITUTIONAL UPDATE) === Version 3.0 represents a complete architectural overhaul, upgrading the EA to the institutional Titan Pro standard with universal multi-asset scaling, on-chart non-repainting regression channels, and an interactive HUD cockpit. [NEW] Universal Multi-Asset Risk & Target Engine (Gold, Forex, Crypto, Indices): - Added 3 selectable SL/TP calculation modes: Dynamic ATR Multiplier, Fixed Points, and Dynamic Kernel Mean-L
FREE
Titan Mini Bilgi Paneli Temiz bir grafik ortamı sağlamak, yapısal odaklanma ve doğru piyasa analizi için gereklidir. Çoğu ticaret paneli ekranı aşırı ve tekrarlayıcı metriklerle doldurur. Titan Mini Bilgi Paneli, kritik verilerin fiyat hareketi analizinizi engellemeden her zaman erişilebilir olmasını sağlayan son derece optimize edilmiş, hafif ve zarif tasarımlı bir Heads-Up Display (HUD) olup, temel piyasa istatistiklerini doğrudan grafiğinizin seçilen herhangi bir köşesine sunar. Temel Özellik
FREE
Titan NPC Pro v2.0 — Institutional Neural Edition Sürüm Notları: - Sağ Üst-Sağ Sinir Performans Kokpiti: Gerçek zamanlı kurumsal HUD eklendi; geçmişi Kazanma Oranı (%), Kazanılan Ortalama Pip, Smart Shield ADX filtre durumu (GÜVENLI vs. ENGELLENEN) ve kanal uzatma yüzdesi eklendi. - Çok Zaman Çerçevesi (MTF) Sinir Radar Matrisi: Sağ alttaki Sinir Radarı 5 zaman dilimli (M5'ten D1'e) ve seyahat matrisine yükseltildi. - Görsel Ortalama-Geri Dönüş Hedef Takibi: Sinyallerin başarıyla Rasyonel Quadr
[SÜRÜM 2.0 - KURUMSAL SÜRÜMDE YENI] * Çift Sinyal Mantığı (Geri Dönüş vs. Breakout): Ortalama Geri Dönüş modu (üst bant tükenmesini satmak, alt bant tüketimini satın almak) ile Momentum Breakout modu arasında doğrudan giriş menüsünden sorunsuz geçiş yapın. * Gerçek Zamanlı Kazanç Oranı Kokpiti: Grafikinizdeki tarihsel sinyalleri otomatik olarak değerlendirir; canlı Kazanma Oranı yüzdesi, toplam kazanma/toplam sinyaller, işlem başına ortalama pip ve görsel hedef isabet işaretleri gösterir. * Çok
Titan Action HUD Pro v7.1 — Ultimate SMC Kurumsal Sürüm Çıkış Notları: - Genişletilmiş Matris Grid & Sıfır Metin Çarpışması: Ana MTF SMC Matrix panelini optimize edilmiş sütun aralığı ile 465px'e genişletti, metin örtüşmelerini (örneğin [ACTIVE]OPEN etiketleri) ortadan kaldırdı ve volatilite rozetlerinde sağ kenar dolgu taşmalarını düzeltti. - Kalıcı Çok Zaman Dilimli Yapı Motoru: BOS/CHoCH yapısal analiz algoritmasını tek çubuklu tetikleyicilerden kalıcı rejim takibine (örneğin, BULLISH BOS ↑,
Titan SuperTrend AI Standart trend takip göstergeleri, piyasa dalgalanmaları ani değişimler geçirdiğinde genellikle tutarlı performans göstermekte zorlanır. Titan SuperTrend AI, son fiyat hareketlerini sistematik olarak değerlendirmek için tasarlanmış dinamik bir dönem tarama mekanizması kullanarak bu zorluğu ele alıyor. Sabit, statik değişkenlere dayanmak yerine, algoritma grafik başlatma veya sembol değişikliklerinde tarihsel mumları analiz ederek belirli varlığın mevcut volatilite profiline u
Titan Tri-Filter EA Titan Tri-Filter EA, yapılandırılmış trend sömürü ve hassas risk azaltma için tasarlanmış gelişmiş bir algoritmik işlem sistemidir. Makro-yönlü trendleri kısa vadeli momentum sinyalleriyle sistematik olarak hizalayarak, algoritma gün içi piyasa gürültüsünü filtrelemeyi ve çok katmanlı teknik koşullar sağlandığında işlemleri yalnızca gerçekleştirmeyi amaçlar. Çekirdek Mimari (Üç Katmanlı Filtreleme Mantığı): Katman 1: Makro Trend Filtresi (Günlük Temel): Birincil piyasa yanlıl
[SÜRÜM 2.0 - KURUMSAL SÜRÜMDE YENI] * Çift Sinyal Mantığı (Geri Dönüş vs. Breakout): Ortalama Geri Dönüş modu (üst bant tükenmesini satmak, alt bant tüketimini satın almak) ile Momentum Breakout modu arasında doğrudan giriş menüsünden sorunsuz geçiş yapın. * Gerçek Zamanlı Kazanç Oranı Kokpiti: Grafikinizdeki tarihsel sinyalleri otomatik olarak değerlendirir; canlı Kazanma Oranı yüzdesi, toplam kazanma/toplam sinyaller, işlem başına ortalama pip ve görsel hedef isabet işaretleri gösterir. * Çok
Titan SuperTrend Pro (v3.0) is an institutional-grade trend-following and volatility-tracking system engineered for MetaTrader 5. While standard SuperTrend implementations rely on static parameters that often lag or generate whipsaws during regime shifts, Titan SuperTrend Pro integrates an internal AI Auto-Optimizer Engine, live target projections, and a multi-timeframe institutional cockpit to deliver objective, non-repainting trade execution. Built upon a robust Average True Range (ATR) archi
Titan Risk Master Pro Scalperlar ve günlük işlem yapanlar için, yüksek piyasa dalgalanma dönemlerinde uygulama hızı ve risk hassasiyeti kritik öneme sahiptir. Pozisyon büyüklüklerini, risk yüzdelerini ve stop-loss değerlerini manuel olarak hesaplamak, uygulama gecikmelerine ve hesaplama hatalarına yol açabilir. Titan Risk Master Pro, pozisyon boyutlandırma ve işlem yönetimi iş akışlarınızı tamamen otomatikleştirmek için tasarlanmış kapsamlı bir grafik üzerinde risk yönetimi ve işlem uygulama kon
Titan SMC Ultimate Suite v6.5 — Kurumsal Sürüm Çıkış Notları: - 4-Corner Institutional SMC Kokpit & MTF Radar: Kullanıcı tarafından sabitlenebilir (Üst-Sol, Üst-Sağ, Alt-Sol, Alt-Sol, Alt-Sağ) performans HUD eklendi; canlı Gerçek Sıçrama Kazanma Oranı (%), Ortalama Kar (Pips/Puan), İşlem Aralığı Premium/İndirim Oranı ve gömülü 5-Zaman Dilimi (M5-D1) BOS/CHoCH hizalama çubuğu eklendi. - Sıfır Çarpışma Bölgesi ve Likidite Etiketleme: Emir Blokları (BULL/BEAR OB), Adil Değer Boşlukları (FVG) ve BS
Titan Z-Score Pro v3.2 Sürüm Notları: Kurumsal UI/UX Yeniden Tasarımı: Performans kokpitleri ve MTF matrisleri ana harita köşelerine taşındı, böylece tertemiz, dağınıklıktan arındırılmış bir alt pencere görünümü sağlandı. Canlı Kazanma Oranı ve Geri Dönüş Kokpiti: Ortalama geri dönüş başarı oranının ve kazanılan ortalama piplerin gerçek zamanlı takibi eklendi. Çok Zaman Dilimi Z-Puan Matrisi: Ana tabloya doğrudan görsel olarak 5 zaman dilimli (M5'ten D1'e) bir durum ızgarası entegre edildi. Yen
Titan FX Power - Currency Strength Matrix for MetaTrader 5 Standard currency strength tools fill the chart with overlapping lines that are hard to read. Titan FX Power turns 8 major currencies (USD, EUR, GBP, JPY, CHF, AUD, CAD, NZD) into a clean, ranked, real-time leaderboard, so you can see who is strong and who is weak at a glance. FOUR ANALYTIC ENGINES IN ONE INDICATOR Choose the engine that fits your trading style: - RSI: directional momentum and structural trend strength. - Stochastic:
Titan Auto RSI Scalper Standart Göreli Güç Endeksi (RSI) algoritmaları, güçlü yönlü piyasa genişlemeleri sırasında genellikle erken karşı trend sinyalleri üretir. Titan Auto RSI Scalper, bu sınırlamayı kısa vadeli momentum anormalliklerini makro piyasa yönü ile uyumlu hale getirmek için tasarlanmış kurumsal düzeyde bir trend filtreleme modülü ekleyerek gideriyor. Uzman Danışman, yalnızca temel uzun vadeli trende göre işlemler yaparak, sahte kırılmalar ve yüksek volatiliteli piyasa gürültüsüyle i

=== TITAN APEX VOLATILITY PRO — VERSION 5.00 (MAJOR VISUAL & ALGORITHMIC UPGRADE) === [NEW] Multi-Color Dynamic Baseline MA & Volatility Bands: - Upgraded the center Baseline Moving Average to a dynamic color-changing trailing stop line (Green on Bullish Breakout, Red on Bearish Breakout, Gold during Consolidation). - Added high-visibility Upper and Lower Adaptive ATR Breakout envelopes. [YENI] Canlı TP1 / TP2 Hedef Projeksiyonları ve Takip Eden SL Etiketleri: - Gerçek zamanlı Giriş, TP1 (1.5x
Titan Pulse Oscillator Titan Pulse Oscillator is a momentum oscillator built on the WaveTrend calculation. It measures how far price (typical price: high, low, close) has moved from its smoothed average, normalised by recent volatility, and plots the result as two lines with a colour-coded histogram ribbon. Volume is not used in the calculation. On top of the oscillator core, the indicator adds an automatic divergence engine, filtered cross signals, live target lines, a multi-timeframe matrix
Ürün Tanımı Titan Likidite ve Boşluk Avcısı: Grafikinizde Kurumsal Sipariş Akışı Çoğu perakende tüccar fiyatı görür. Kurumlar likiditeyi görür. Titan Liquidity & Gap Hunter, Smart Money Concepts'te önemli olan üç şeyi (piyasa yapısı, Adil Değer Boşlukları ve likidite havuzları) haritalandırıyor ve bunları tek bir temiz, modern gösterge paneline topluyor. Ne yapar Piyasa Yapısı (BOS / CHOCH): Doğrulanmış salınım noktalarından trend devamlarını (Yapı Kırılması) ve tersine dönüşleri (Karakter Deği
Titan Action HUD Pro v7.1 — Ultimate SMC Kurumsal Sürüm Çıkış Notları: - Genişletilmiş Matris Grid & Sıfır Metin Çarpışması: Ana MTF SMC Matrix panelini optimize edilmiş sütun aralığı ile 465px'e genişletti, metin örtüşmelerini (örneğin [ACTIVE]OPEN etiketleri) ortadan kaldırdı ve volatilite rozetlerinde sağ kenar dolgu taşmalarını düzeltti. - Kalıcı Çok Zaman Dilimli Yapı Motoru: BOS/CHoCH yapısal analiz algoritmasını tek çubuklu tetikleyicilerden kalıcı rejim takibine (örneğin, BULLISH BOS ↑,
Titan AI Volume Cluster Sniper v2.1 — Kurumsal Sürüm Sürüm Notları: - Ergonomik Sol Taraf HUD Mimarisi: Kurumsal Performans Kokpiti (Üst-Sol) ve Çoklu Zaman Aralığı Hacim Matrisi (Alt-Sol) çalışma alanının sol tarafına taşındı, böylece sağ taraftaki K-Means ses profili çubuklarıyla görsel örtüşmeler sıfır sağlandı. - POC Keskin Nişancı Zıplama ve Reddetme Sinyalleri: Fiyat yüksek yoğunluklu Kontrol Noktası (POC) küme merkezlerine tepki verdiğinde, canlı Kazanma Oranı (%) ve Ortalama Pip takibi i
Titan Specter Cloud Pro v5.5 — Kurumsal Gradient ve Kokpit Sürüm Notları: - 4 Katmanlı Gradient Bulut Mimarisi: Envelope görsel motoru çift bölgeli (İç ATR200 Bulut + Dinamik Otomatik Çarpan Dış Bant) 4 katmanlı opaklık karışımı gradyan sistemine yükseltildi ve parlayan Retest Elmasları kullanıldı. - Standartlaştırılmış 4-Köşeli Dinamik Kokpit: Kullanıcı tarafından seçilebilen 4 köşeli ankramlama (Üst-Sol, Üst-Sağ, Alt-Sol, Alt-Sağ) ve otomatik harita boyutlandırma adaptasyonu eklendi. - Canlı Y
Titan NPC Pro v2.0 — Institutional Neural Edition Sürüm Notları: - Sağ Üst-Sağ Sinir Performans Kokpiti: Gerçek zamanlı kurumsal HUD eklendi; geçmişi Kazanma Oranı (%), Kazanılan Ortalama Pip, Smart Shield ADX filtre durumu (GÜVENLI vs. ENGELLENEN) ve kanal uzatma yüzdesi eklendi. - Çok Zaman Çerçevesi (MTF) Sinir Radar Matrisi: Sağ alttaki Sinir Radarı 5 zaman dilimli (M5'ten D1'e) ve seyahat matrisine yükseltildi. - Görsel Ortalama-Geri Dönüş Hedef Takibi: Sinyallerin başarıyla Rasyonel Quadr
Titan Score EA v2.0 — Kurumsal Prop-Firması ve Etkileşimli Kokpit Sürüm Notları: - Etkileşimli 4-Köşeli Kurumsal Kokpit: Harita üzerindeki HUD'u çift SAT/SAT Birleşme kartları, katman katman dağılım, canlı Floating PnL ve etkileşimli [TÜM POZISYONLARI KAPAT] ve [DURAKLATMA/DEVAM ET] butonları ile yeniden tasarlandı. - Canlı Grafik Üzerinde SuperTrend ve Uygulama İşatörleri: Artık renk kodlu SuperTrend yapısal çizgisi ve ticaret giriş oklarını doğrudan grafik çalışma alanında otomatik olarak ren
What's new in v3.00 Titan Prop Master has been rebuilt with a full cockpit and stronger prop firm protection. Cockpit (HUD) - Movable panel: drag the header anywhere, or press CORNER to jump between the four chart corners. Position is remembered per symbol. - MTF matrix: EMA and SuperTrend direction on M5, H1, H4 and D1, with a combined BUY / SELL / neutral bias row. - Risk bars: daily, weekly, monthly and overall loss versus your limits, with colour warnings as you approach them. - Performanc
Titan SMT & Correlation Sniper Pro (v2.3) is an institutional-grade multi-asset analysis and trade-timing suite engineered for MetaTrader 5. Built for professional traders and prop-firm managers, this indicator bridges the gap between classic Smart Money Concepts (ICT/SMT Divergence) and quantitative Statistical Arbitrage (Z-Score Mean Reversion). Unlike standard retail indicators that blindly look at a single chart, Titan SMT continuously scans and measures real-time Pearson correlation acros
Titan Kalman Quantum Trend Pro (v2.0) is an institutional-grade, zero-lag state-space trend and velocity tracking system engineered for MetaTrader 5. While traditional moving averages (EMA, SMA, Hull) rely on historical price averaging that inevitably lags behind sudden market movements, Titan Kalman Quantum Pro utilizes a 2-Dimensional Kinematic Kalman Filter to estimate both real-time price trajectory (Position State) and underlying market momentum (Velocity State) simultaneously. Combined w
Titan Reversal is a bottom/top reversal indicator that aggregates multiple independent signals into a single score, rather than relying on a solitary indicator. How does it work? For every candle, the indicator evaluates various components, including Williams %R, Stochastic RSI, buying/selling pressure, 9-13 counts, RSI/MACD/CCI/OBV divergences, Parabolic SAR, volume momentum, liquidity sweeps, and rejection candles. These components are categorized into four "families" (momentum, flow, struct
筛选:
无评论
回复评论