Kmean SuperTrend

  • 指标
  • Chi Sum Poon
    Chi Sum Poon
    This is Gary Poon

    I will first study of trading on demo account then to real account.
    This is my only account on MQL5.com, I will not create another one for now.
    If there are any queries or concerns, please refer to the broker details from my signals.

    Thank you.
  • 版本: 1.0
  • 激活: 5

🚀 KmeanSuperTrend – 進階AI驅動SuperTrend指標

用KmeanSuperTrend釋放適應性交易的力量!

使用全球首個採用AI K-means聚類技術的SuperTrend指標,轉變您的交易。KmeanSuperTrend結合了經過驗證的SuperTrend方法論與尖端機器學習,在趨勢檢測和市場分析方面提供前所未有的準確性。

✨ 革命性功能

🤖 AI K-means ATR聚類:
先進的5聚類演算法分析100+歷史K棒,智慧地適應ATR計算以應對當前市場波動條件。

📈 動態SuperTrend視覺化:
清晰的趨勢信號配以適應性色彩編碼(🔵上升趨勢,🔴下降趨勢),自動調整以適應市場條件。

⚙️ 完全可自定義參數:

  • ATR週期(預設值:10)
  • ATR倍數(預設值:3.0)
  • 回溯期間(預設值:100)
  • 自定義顏色和線條樣式
  • 進階聚類種子控制

⏱️ 即時市場適應:
智慧波動聚類確保指標隨變化的市場條件演進,減少延遲並改善信號品質。

🌐 通用交易應用:
相容於所有時間框架(M1到月線)和所有工具(外匯、股票、商品、指數、加密貨幣)。

📚 如何使用KmeanSuperTrend

配置:

  1. ⚙️ 根據您的交易風格調整參數:
    • 剝頭皮: ATR週期 = 5-8,倍數 = 2.0-2.5
    • 當日交易: ATR週期 = 10-14,倍數 = 3.0-3.5
    • 擺盪交易: ATR週期 = 14-20,倍數 = 3.5-4.0

交易信號:

  1. 🔵 藍線 = 上升趨勢: 尋找做多機會,避免做空
  2. 🔴 紅線 = 下降趨勢: 尋找做空機會,避免做多
  3. 🔄 顏色變化: 線條顏色切換時的強烈趨勢反轉信號
  4. 📈 進場策略: 按趨勢方向進入交易或用作趨勢過濾器
  5. 🛡️ 停損: 使用相反趨勢線作為動態停損水準

專業提示:

  • 💡 與支撐/阻力結合以提高準確性
  • 📊 使用多個時間框架進行匯流
  • ⏰ 在活躍交易時段表現最佳
  • 🎯 作為其他策略的趨勢過濾器效果極佳

💎 為什麼KmeanSuperTrend更優越

🧠 智能噪音削減:
AI聚類相比傳統SuperTrend指標消除60-80%的虛假信號。

🎯 適應性市場分析:
自動調整到高/低波動期間,無需手動干預。

🏆 專業級代碼:
針對速度和可靠性進行優化,具有強大的錯誤處理和記憶體管理。

 閃電般快速執行:
先進演算法確保即時計算而不會造成圖表延遲。

📈 經過驗證的記錄:
在多個市場和時間框架中進行廣泛回測。

🎁 特別發布優惠

🆓 免費試用版

先試用再購買! 下載我們有限功能的試用版,在您喜愛的工具上測試指標性能。

💰 完整版優勢:

✅ 在所有帳戶無限使用
✅ 所有進階參數解鎖
✅ 優先客戶支援
✅ 終身免費更新
✅ 安裝指南和視頻教程
✅ 自定義參數優化指南
✅ 7天退款保證

🛒 準備轉變您的交易?

🎯 下載免費試用版: 今天就無風險試用KmeanSuperTrend!
💎 購買完整版: 僅需$33即可釋放無限潛能!

不要讓另一筆獲利交易溜走。加入已經使用KmeanSuperTrend的數千名成功交易者!

⭐ 客戶評價:
"我用過的最好的SuperTrend指標。AI聚類產生了所有不同!" - 專業交易者

"終於有一個真正適應市場條件的SuperTrend。強烈推薦!" - 外匯專家

📧 有疑問?聯繫我們的支援團隊獲得即時協助!


推荐产品
AuroraV5
Ron Fritzhugh Bryan
I could write a fantastic description with lots of quantitative testing parameters but we have a saying that "taste of a pudding is in the eating " so I will simple put a CHALLENGE :Test this EA on any of the major and minor pairs (AUD,USD,EUR,CHF,NZD )and I guarantee you  50% discount if you can prove in a test on any of the major pairs above  that you have incurred  more than 3 error runs. *NOW HAPPY TESTING* Then you get to write the description unhindered!!!!!!!!!!!!!!!!!!!!!!!!!!!!!!!

Reversal Overlap Bot is an automated trading strategy. No technical indicators are used in the work. At the beginning of trading, the first order is placed in a certain direction (at your option). When you open a new candle, this order is closed if it is in profit. Otherwise, the next order opens in the opposite direction. Orders are closed when profit is reached. If there are unprofitable orders on the chart, the robot will close one of them. When closing loss-making orders, the profit covers t
PTW NON REPAINT TRADING SYSTEM + HISTOGRAM Non-Repainting ,   Non-Redrawing   and   Non-Lagging  Trading System. Does the following: - Gives Accurate Entry and Exit Points - Scalping, Day and Swing Trading  - 95% Accuracy  - Targets, where to take profits. - Shows Trends, Support and resistance levels - Works on All Brokers - Works on All Currencies, CFDs and Stocks - It does not place trades for you, it only shows you what trades to place. - It works on All Timeframes - It is for Trend or ran
Th3 BarPlay Signals Mt4
Nnamdi Kennedy Ifeorah
这是一种基于价格行为的策略,称为 3Bar_Play,它基于 3Bar 烛台形态。在弹出买入/卖出信号箭头之前,添加了额外的指标用于过滤和确认。它可以在上升趋势、下降趋势或横向市场中交易。 添加的指标包括: 随机 - 动量 Fisher - 趋势 ATR - 波动率也明确定义了信号箭头底部的止损位置(使用 ATR 止损方法)。 具有良好风险管理的风险回报比可以从 1:1 到 1:4 不等。 买入 - 当买入信号在 2 个看跌柱和 1 个看涨柱后弹出时。 卖出 - 当卖出信号在 2 个看涨柱和 1 个看跌柱后弹出时。 附加功能 用于在图表上打开/关闭信号但不发出警报的切换按钮。 设置面板上的可调参数(下载时的首选设置)。 启用电子邮件/推送通知,在您离开屏幕时提醒您注意信号。 一个非常简单易用的指标,适用于所有市场。灌输纪律并帮助交易者专注于流程。 适合在止损和获利安置中苦苦挣扎的新手/交易者。专业交易员也不例外。 24 小时支持。 注意事项 如果指标未能出现在您的图表屏幕上,您需要联系我并安装自定义鱼指标。
双顶和双底扫描仪 MT4 是一个强大的指标,专为 MetaTrader 4 设计,帮助交易者通过双顶和双底模式识别潜在的趋势反转。该工具非常适合希望通过实时警报和视觉信号增强交易策略的新手和经验丰富的交易者。 通过利用先进的算法,该指标提供了市场动态的关键洞察,使交易者能够做出明智的决策。它能够扫描多个货币对和时间框架,使其成为任何希望最大化交易潜力的人的多功能选择。 MQL产品安装指南 | 在 MT4/MT5 上更新已购买的MQL产品 | 常规故障排除指南 | 指标设置/指南 主要特点 缓冲区集成:将指标值暴露为可访问的缓冲区,以便与 Expert Advisor 进行自动交易。 视觉箭头信号:在信号蜡烛上直接在图表上显示清晰的买入/卖出箭头,便于视觉阅读。 快速且可回测:基于 MetaTrader 的本地 OnCalculate() 引擎构建,能够快速计算并与策略测试器完全兼容。 弹出警报:在信号事件上触发 MetaTrader 警报弹出窗口,以确保您不会错过任何交易设置。 推送通知:实时推送通知到您的 MetaTrader 移动应用,以便随时监控。 电子邮件警报:在信号事件上发送
Happy Kangaroo
Pui Yan Leung
Overview Happy Kangaroo is a trend-following tool designed to identify market direction and provide high-probability entry signals based on volatility. By combining price action with the Average True Range (ATR), it visualize a dynamic support and resistance level of the price.     Key Features   The indicator's power lies in its customizable parameters and mathematical precision:  Dynamic Trend Detection: Uses the ATR period and factor to calculate the volatility bands. It identifies an Uptrend
Multi‑Timeframe Volatility & Sentiment Scanner (MT4) Advanced Market Strength Dashboard – ATR, Range, Momentum, Volume, Sentiment & Trend Engine The Volatility & Sentiment Scanner is a professional multi‑timeframe market analyzer designed for traders who need fast, accurate, and actionable information. It combines volatility metrics, sentiment analysis, momentum, volume pressure, trend bias, and signal scoring into a clean, lightweight dashboard that updates in real time. This tool gives you an
Accumulated Rsi
Muhammed Emin Ugur
Introducing the Accumulated RSI,  your ultimate tool for precise trend identification and momentum analysis in the world of Forex and financial markets. This cutting-edge MetaTrader 4 (MT4) indicator, designed for traders seeking unparalleled insight and accuracy, empowers you to make well-informed trading decisions like never before. Features Accurate Trend Detection: The Accumulated RSI utilizes the Relative Strength Index (RSI) in an innovative way to pinpoint the prevailing market trends wit
Using multiple timeframes for analysis with Multi Timeframe Bollinger Bands  can provide several significant benefits for traders: Comprehensive Market View: By applying Mtf Bands Standard across different timeframes, traders gain a broader perspective on market dynamics. This allows them to identify trends, patterns, and potential reversal points that might be more apparent or consistent across various scales. Enhanced Pattern Recognition: Multiple timeframes help in identifying repeating patte
FREE
Happy Devil
Pui Yan Leung
Overview Happy Devil  is an Auto-Fibonacci Retracement Indicator designed to eliminate the subjectivity of manual drawing. It identifies market swings automatically   Key Functions 1. Visual Legend Blue Lines (0.0% & 100.0%): Represent the boundaries of the current price swing. Red Line (61.8%): Highlights the "Golden Ratio," a critical level for trend reversals or retracements. White Lines: Represent the secondary retracement levels (23.6%, 38.2%, 50.0%, 78.6%). Auto-Extend Right: All lines aut
TheStrat Patterns
Robert Gerald Wood
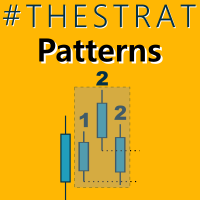
This indicator will draw patterns based on Rob Smith's The Strat as they emerge in real time on your chart. As price evolves, TheStrat offers 18 distinct price action patterns that can help you get good entries in the market. Each pattern involves two or three candles, and this indicator will draw a bounding box around the candles and name the pattern. The indicator also shows when a potential setup is forming, known by stratters as an Actionable signal. Candles Each candle is defined by its
Note : The slow loading of the indicator issue has been addressed . This new version loads fast and does not slow the platform. Version 1.3 : We have updated the indicator to include an historical bar scanning option . So instead of scanning all bars in the history (which can make the indicator slow sometimes ) , you can select the maximum number of bars it can scan which can increase the performance and make the indicator faster. This indicator scans the 1-3 Trendline pattern . The indicato
BinaryIndi
Andrey Kravchenko
This is an arrow indicator for binary options. It does not redraw, arrows do not disappear. The indicator implements an optional tester for visual monitoring of the number of signal and win rate. Does not require adjustment or fitting. Works on all pairs and gold. The signal appears at the close of a candle. Entry is made on the next bar. Optional alert. For trading with robots, there is a setting for the number of bars in history. If 0, the entire history is used. The EA operation time: 24/5 Wo
Super Ichi
Sinan Durkan
What is the Super Ichi Indicator? Super Ichi is an advanced combination of Ichimoku Kinko Hyo and SuperTrend indicators. This powerful technical analysis tool is designed to identify market trends and generate trading signals. What Does It Do? Dual-Level Trend Analysis : Uses customized versions of Tenkan-sen and Kijun-sen lines Automatic Signal Generation : Displays visual markers (arrows) at crossover points Real-Time Alert System : Provides audio and visual alerts when new signals occur Dynam
FREE
Stardust
Evgeniy Zhdan
StarDust searches for divergences in the values of several indicators considering them as signs of flat and enters the market if a relatively steady trend is detected. The Expert Advisor trades "basic" symbols with a low spread. The best results are achieved on М15. The EA automatically adjusts to 4 and 5-digit quote flows. Settings Comment_to_orders – comment to a placed order. The field can be left blank if no comment is required. MM – enable money management with automatic setting of a worki
Engulfing Candle Hunter MT4
Odaine Ramon Mcmillan
1 (1)
The Game-Changing Engulfing Candle Hunter - Your Guide to Profitable Trend Trading Step into the realm of trading possibilities with our revolutionary product - The Engulfing Hunter. Designed by traders for traders, this dynamic indicator combines the potency of engulfing candlestick patterns and the versatility of proprietary trend detection system, offering a trading edge unlike any other. Engulfing candlestick patterns have always been a revered tool in the arsenal of seasoned traders. Acting
为您介绍MQL4的Donchian通道指标,这是一个强大的技术分析工具,旨在提升您的交易成功率。该指标由四条线组成,代表了在指定时期内价格运动的上限和下限。 通过Donchian通道指标,您可以轻松识别市场潜在的突破和反转。上线显示指定时期内的最高点,而下线代表最低点。这两条线之间的空间形成一个通道,为您提供了有关资产交易价格范围的有价值见解。 但这还不是全部 - 我们进一步改进了这个令人难以置信的指标。我们的修改允许您按照一定百分比(表示为'shadowTop'和'shadowBottom')减小通道宽度。通过缩小通道,您可以更敏锐地感知价格波动,并准确定位入场和出场点。 无论您是经验丰富的交易者还是初学者,带有减小通道宽度的Donchian通道指标都是您交易工具箱中必备的工具。它能够让您基于市场波动和价格行为做出明智的决策。 不要错过将您的交易推向新高度的机会。体验带有减小通道宽度的Donchian通道指标的强大功能,释放您的交易潜力吧。
This is a simple PriceTMA bands, non repaint! it can be used for a trend following system or sometimes reversals. as a main signal or a filter for others strategies, it depends on the trader main strategy. calculations for this indicator are a combined Algorithm between moving averages "MA" and average true range"ATR". good luck with your trading! i hope it is helpful Cheers
The brand new trading indicator Trendline Tunnel is presented by KING.Ai. This indicator were built base on the the theory of  Latest Up and Down Trend line . Latest Trend are difficult can by seen by human eye.  Indicator can help to identical the Trend . KING.Ai Forex trader mainly use this strategy to  "See Through" market . We do believe that it is a  powerful method to show the latest trend and do the breakout trade strategy . General speaking, Trendline Tunnel have following using: Method
UGenesys MultiTrend
Odaine Ramon Mcmillan
PURCHASE THIS INDICATOR AND GET OUR SECRET BONUS! Why is TREND Important? This is one of the biggest questions asked by beginner traders.  Trend is important because that is primarily when the market moves the most. When a market has good volume, many banks, hedgefunds and large institutions are participating and driving price up or down in strong trends. THIS IS THE PERFECT TIME TO TRADE. The uGenesys Multi-Trend Indicator was specifically designed to identify when a trend has started in the ma
Alphabet AI MT4
Sergei Pomytkin
Alphabet AI 是一款基于均值回归策略的顾问工具——这意味着它利用市场的自然属性,在出现大幅偏离后回归到平均值。该算法会持续分析资产的当前价格,并将其与计算出的平均水平进行比较。当价格大幅偏离平均值时,顾问工具会将其解读为行动信号:当价格超过上限时,它会开空头仓位,预期价格下跌;当价格跌破下限时,它会开多头仓位,预期价格上涨。我们顾问工具的独特之处在于它采用自适应方法来确定通道边界并过滤错误信号,这使得它即使在温和趋势条件下也能有效运作。该顾问工具在价格通道内波动明显的货币对上表现尤为出色。 该顾问程序已经过 20 多年的数据测试,在此期间它可以承受最不稳定的时期。 如果您没有机会让您的计算机保持 24/5 运行,那么建议使用 VPS 服务器服务。 顾问拥有超过 12 个月的稳定交易且回撤较低。 限时价格仅为 379.99 美元! 每购买 10 次,价格将上涨 50 美元! 最终售价 2999.99 美元 实时信号: https://www.mql5.com/en/users/delmare/seller MT5 版本可在此处获取: https://www.mql5.com/
ReSu mt4
Daniel Opoku
The Wamek Support and Resistant (WSR) Indicator is a remarkable tool that stands out in the world of technical analysis. It sets itself apart by cleverly combining price action and leading indicators to delineate support and resistance levels with a high degree of accuracy. Its unique feature is its adaptability; users can fine-tune the indicator by adjusting input parameters, enabling them to create customized support and resistance levels that suit their trading strategies. Notably, one of WSR
Pound Puppies GBPUSD M30 Everything is already set up for GBPUSD M30 timeframe . Strategy is based on breakout of the HIGHEST channel after some period of consolidation. It uses Stop pending orders with  ATR Stop Loss and FIXED Take Profit .  Strategy uses also   MOVE TO BREAK EVEN and PROFIT TRAILING   functions to lock as much profit as possible. For every candle the pending orders are modified to adapt the market behavior. You need to set only the lotsize depending on the amount of capital in
Mr Tiger Mt4
Taha Saber Ashour Kamel
Mr Tiger mt4 trading bot is so strong bot so rich with different sections in parameters like technical sections , risk management and drawdowns also strategy settings , indicators sections and analysis sections also sessions section you will find so many options you can control also to run on gold or btc  adjust spread according to these pairs also adjust lot sizing minimum and maximum and you have many options for tp and sl in pips and money
This indicator is meant for Harmonic Traders, it helps them in identifying the formed patterns by analyzing the market past data, looking for Harmonic Patterns. The Patterns that this indicator can detect are: AB=CD Butterfly Gartely Crab Bat The indicator shows the following: The completed pattern, with the critical zone highlighted in Gray box The suggested 3 take profit levels (in green) The Suggested Stop Loss level (in Red) The formed pattern ratios can be checked by hovering the mouse on t
Cleopatra EA
Nestor Alejandro Chiariello
5 (1)
交易员您好! EA 拥有 3.5 年低回撤的稳定交易记录: 现场表演 可以在这里找到 MT4 版本 我介绍“Cleopatra EA”策略,Cleopatra 是一个美丽而智能的设计,具有不断适应的恢复形式,其强大之处在于多功能性 它的主要策略是阅读市场的弹性,我们将能够以不同的方式分析进入范围。 这可以是非常动态的,因为在不同的 tf 和不同的范围内,处理对市场新闻的查询。 Cleopatra 有很强的适应市场复苏的能力,她的模式不是固定的,我们也有不同类型的保护,无论是百分比还是浮动,能够在任何 propfirm account 或 mff 等规则下工作。 它针对 EURUSD 进行了优化,但它可以处理整个市场,关键是要使其适应您需要的市场。 支持的货币对:EURUSD,可选所有市场 推荐时间范围:M15 特征: 一张图表设置:您只需要一张图表即可进行交易 多种货币对支持 可靠的回测和现场表现 无需调整 GMT 非常易于使用:只需阅读下面的 3 行说明 比可用的高质量替代品便宜得多 如何安装 EA 必须附加到任何 TF 但 M15 图表,推荐 EURUSD 如果您的
This is a simple and efficient indicator based on market logic. The indicator creates a range chosen by a trader. Trader selects only two parameters. The first one is the number of candles that define the frame. The second one is the number of candles needed for confirmation frame. The indicator shows all situations in history and works with the actual movement of the market. The indicator works on all timeframes . You are not limited by use of different timeframes, the indicator is able to adap
High Low Predict
Thomas Bradley Butler
This indicator is designed to help you forecast the potential high and low prices for the current trading day, based on the high and low of the previous day. It does this by applying a customizable percentage increase or decrease to those levels. How It Works: The idea is simple: It looks at the previous day's high and low prices and then adjusts them by a percentage you choose. Here's what that means: Predicted High: This is calculated by taking the high price of the previous day and adding a p
Implement
Vitalii Zakharuk
5 (1)
Implement analyzes market dynamics for pivot points. If you want to learn how to spot the correct reversals for consistently likely profitable trading, buy this indicator. Shows favorable moments of entering the market in stripes. Ready-made trading system. The principle of operation of the indicator is to automatically determine the current state of the market when placed on a chart, analyze historical data based on historical data and display instructions for further actions on the trader's
introduction: Hello, I present to you the advanced and final version of the "Binary Hedger FV" Expert Advisor. I won't delve into extensive details about the EA's concept, as I've covered all the information in the initial version or what can be referred to as the EA's trial version, accessible through the following link: https://www.mql5.com/en/market/product/93688?source=Site +Market+My+Products+Page In this presented version, you have a comprehensive and complete release that incorporates all
该产品的买家也购买
Gann Made Easy
Oleg Rodin
4.84 (168)
Gann Made Easy 是一个专业且易于使用的外汇交易系统,它基于使用先生理论的最佳交易原则。 W.D.江恩。该指标提供准确的买入和卖出信号,包括止损和获利水平。您甚至可以使用推送通知在旅途中进行交易。 购买后请联系我,即可免费获得交易指导和超棒的额外指标! 您可能已经多次听说过江恩交易方法。通常 Gann 的理论不仅对于新手交易者而且对于那些已经有一定交易经验的人来说都是非常复杂的东西。这是因为江恩的交易方法在理论上并不那么容易应用。我花了几年时间来完善这些知识,并将最好的原则应用到我的外汇指标中。 该指标非常易于应用。您所需要的只是将其附加到您的图表并遵循简单的交易建议。该指标不断进行市场分析工作并寻找交易机会。当它检测到一个好的入口点时,它会为您提供一个箭头信号。该指标还显示止损和获利水平。 换句话说,当您像先生一样进行交易时,该指标会为您提供最佳江恩建议。江恩亲自告诉你此时此刻该做什么。但最好的部分是您不需要了解任何有关江恩交易原则的知识,因为该指标会为您完成整个市场分析工作。
Neuro Poseidon MT4
Daria Rezueva
4.75 (44)
Neuro Poseidon is a new indicator by Daria Rezueva. It combines precise trading signals with adaptive TP/SL levels - creating best possible trades as a result! Message me and get  Neuro Poseidon Assistant  as a gift to automize your trading process! What makes it stand out? 1. Proven profitability on all assets and timeframes 2. Only confirmed BUY and SELL signals present on the chart 3. Adaptive TP & SL levels generated by the software for each trade 4. Easy to understand - suitable for all
Prop Firm Sniper
Mohamed Hassan
5 (5)
Prop Firm Sniper MT4  is a professional market structure indicator that automatically identifies high-probability BUY and SELL opportunities using BOS and CHoCH analysis. Recommended Timeframes: For backtesting, use the indicator on   M5 or M15   for Gold (XAUUSD), and   M15 or H1   for more volatile Forex pairs such as   GBPUSD, USDJPY, EURGBP , and similar markets. CONTACT ME AFTER PURCHASE TO CLAIM YOUR FREE BONUSES! Prop Firm Sniper  is a professional market structure indicator designed t
M1 Arrow
Oleg Rodin
4.81 (21)
M1 Arrow 指标基于市场自然交易原则,包括波动性和成交量分析。该指标适用于任何时间框架和外汇货币对。指标中一个易于使用的参数即可让您根据想要交易的任何外汇货币对和时间框架调整信号。 除了基于买卖信号的主要算法外,该指标还内置了多种额外的策略,您可以在输入参数中选择。这些策略无需任何设置。指标会根据您在指标中使用的策略模式自动选择设置。 该算法基于对成交量和价格波动的分析,并使用额外的过滤器。该指标的智能算法仅在两个市场因素结合为一个时才发出信号。该指标计算特定范围的波动,并使用成交量分析来确认波动。 购买后请联系我,即可免费获得我的交易技巧和超棒的额外指标! 祝您在生活的各个方面都取得巨大成功,万事如意!
Smart Trend Trading System
Issam Kassas
4.67 (6)
本产品已针对 2026 年市场进行更新,并针对最新 MT5 版本进行了优化。 价格更新通知: Smart Trend Trading System 目前价格为 $99 。 接下来的 30 次购买 后,价格将上涨至 $199 。 特别优惠: 购买 Smart Trend Trading System 后,请发送私信给我,即可免费领取 Smart Universal EA ,并将您的 Smart Trend 信号转换为自动交易。 Smart Trend Trading System 是一套完整的交易系统,具备不重绘、不回绘、不延迟的特点,专为希望获得更清晰信号、更准确趋势方向以及更有组织交易方式的交易者打造。 Online course , manual and [download presets] . 它将 10 多种交易工具 整合到一个系统中,包括趋势检测、反转区域、Smart Cloud、移动止损逻辑、支撑与阻力、K线着色、提醒以及多周期分析。 该系统旨在帮助您应对不同的市场环境: 趋势市场: 识别主要趋势,发现回调,跟随动能,并通过止损指导和移动止损选项寻找更清晰的入场机会。
Scalper Inside PRO
Alexey Minkov
4.68 (69)
Scalper Inside PRO Scalper Inside PRO 是一款日内趋势与剥头皮指标,采用独家的内置算法来评估市场方向和关键目标位。该指标会自动计算进场点、出场点以及多个止盈目标位,并显示详细的绩效统计数据,让您能够看到不同品种和策略在历史数据上的表现。这有助于您选择符合当前市场状况的交易品种。您还可以将自己的箭头指标连接到 Scalper Inside PRO,并快速查看它们的统计数据和历史信号。 Scalper Inside PRO 使用手册及参数说明: 点击阅读 该指标适用于任何品种和时间周期(日内交易推荐使用 M5),并包含多种内置策略。它既可作为独立的剥头皮工具使用,也可作为您交易系统的分析组件。 主要功能 基于独家的新一代趋势检测算法 Next-Generation Trend Detection Algorithm (NG TDA) 进行趋势识别。 自动计算进场点和出场点,并提供多级止盈目标(TP1、TP2、TP3)。 三种内置策略和一个优化器,用于将信号适配到当前品种和时间周期(仅在实时模式下可用)。 提供品种和策略在历史数据上的详细绩效统计。 提
PZ Day Trading
PZ TRADING SLU
3.67 (3)
该指标仅使用价格行为分析和donchian渠道以锯齿形检测价格反转。它是专门为短期交易而设计的,根本不需要重新粉刷或补漆。对于精明的交易者来说,这是一个绝佳的工具,旨在增加他们的运作时间。 [ 安装指南 | 更新指南 | 故障排除 | 常见问题 | 所有产品 ] 极易交易 它在每个时间段都提供价值 实施自我分析统计 它实现了电子邮件/声音/视觉警报 基于可变长度的突破和拥挤区域,该指标仅使用价格行为来选择交易并对市场快速做出反应。 显示过去信号的潜在利润 该指标分析其自身的质量和性能 突围的损失突出显示并解决 该指标是不可重涂和不可重涂的 该指标将帮助盘中交易者不要错过单个价格反转。但是,并非所有价格反转都是一样的,也不是具有相同的可行质量。决定要突破哪些突破而忽略哪些取决于交易者的良好判断。 如何解释统计数据 该指标研究其自身信号的质量,并在图表上绘制相关信息。将分析每笔交易,并在图表的左上角显示总体历史结果,这使您可以针对任何给定的工具和时间范围自行优化指标参数。每个乐器和时间表都有其自己的最佳设置,您可以自己找到它们。 最大优惠交易:对于任何给定的交易,MFE都是最好的结
Atomic Analyst
Issam Kassas
5 (9)
本产品已针对 2026 年市场进行更新,并针对最新 MT5 版本进行了优化。 价格更新通知: Atomic Analyst 目前价格为 $99 。 接下来的 30 次购买 后,价格将上涨至 $199 。 特别优惠: 购买 Atomic Analyst 后,请发送私信给我,即可免费领取 Smart Universal EA ,并将您的 Atomic Analyst 信号转换为自动交易。 Atomic Analyst 是一款不重绘、不回绘、不延迟的 Price Action 交易指标,专为手动交易、清晰信号和 EA 自动化而设计。 User manual: settings, inputs and strategy.      &   User Manual PDF . 它分析价格行为、强度、动能、多周期方向和高级过滤器,帮助交易者减少噪音,避免弱势交易机会,并做出更有结构的交易决策。 该指标将复杂的市场计算转换为简单的视觉信号、彩色K线、趋势读数、止损水平和多个止盈区域,使交易者能够快速理解并应用于真实市场环境。 主要交易用途: 剥头皮和日内交易: 专为快速决策、清晰箭头、提醒、K线
Quant Direction
Georgios Kalomoiropoulos
Quant Direction 是一款三维市场分析工具。它通过同时计算多个维度上的精确百分比偏差,提供完全客观的、基于算法的市场分析视角。该算法采用先进的人工智能建模工具开发,并经过全面测试,旨在以独特的精准度解读市场。它可以分析您平台上的任何货币对或金融工具。 无论您是短线 交易者、日内 交易者还是波段交易者,Quant Direction 都是您的理想之选。 交易者的真正优势 Quant Direction 的真正优势在于彻底消除情绪、屏幕疲劳和过度思考。它无需手动点击十几个图表来寻找方向并反复质疑自己的偏好,引擎即可在几毫秒内即时处理 8 个时间周期(从 5 个月到月线)。它能准确告诉你任何时刻谁在掌控市场,确保你始终朝着概率最高的方向进行交易。 市场分析的三个维度 该算法将市场分为三个不同的交易维度,为您提供完整的宏观和微观视角: 超短线交易分析: 捕捉即时、快速的动量变化和较低时间框架的执行点。 日内分析: 识别真实的、潜在的每日方向性偏差。 波动分析: 专注于宏观趋势,确保您不会与大盘机构的走势背道而驰。 独家评分引擎 Quant Direction 的底层采用了一套
M1 Sniper
Oleg Rodin
5 (26)
M1 SNIPER 是一款易于使用的交易指标系统。它是一个专为 M1 时间框架设计的箭头指标。该指标可以作为独立的系统在 M1 时间框架下进行剥头皮交易,也可以作为您现有交易系统的一部分使用。虽然该交易系统专为 M1 时间框架交易而设计,但它也可以用于其他时间框架。我最初设计此方法是为了交易 XAUUSD 和 BTCUSD。但我发现这种方法在其他市场交易中也同样有用。 指标信号既可以顺势交易,也可以逆势交易。我教授一种特殊的交易技巧,帮助您利用指标信号进行双向交易。该方法基于使用特殊的动态支撑位和阻力位区域。 购买后,您可以立即下载 M1 SNIPER 箭头指标。此外,我还为所有 M1 SNIPER 工具用户免费提供下方屏幕截图所示的 Apollo Dynamic SR 指标!这两个指标的组合可以帮助您更轻松、更准确地利用 M1 时间框架进行交易。 购买后请联系我,免费获取交易提示和奖励指标! 祝您交易成功!
Currency Strength Wizard
Oleg Rodin
4.85 (59)
货币强度向导是一个非常强大的指标,为您提供成功交易的一体化解决方案。该指标使用多个时间范围内所有货币的数据来计算这个或那个外汇对的力量。此数据以易于使用的货币指数和货币电力线的形式表示,您可以使用它们来查看这种或那种货币的力量。 您所需要的只是将指标附加到您要交易的图表上,该指标将向您显示您交易的货币的真实强度。该指标还向您显示买卖量压力的极值,您可以在顺势交易时利用这些压力。该指标还显示了基于斐波那契的可能目标。该指标可用于各种交易时间范围。该指标支持各种货币对的交易。 该指标为您提供所有类型的警报,包括推送通知。 购买后请联系我。我将与您分享我的交易技巧,并免费为您提供丰厚的红利指标! 祝您交易愉快,获利丰厚!
Super Signal – Skyblade Edition 專業級無重繪 / 無延遲趨勢信號系統,擁有卓越勝率 | 適用於 MT4 / MT5 在較低的時間週期上效果最佳,例如 1 分鐘、5 分鐘與 15 分鐘圖表。 核心特色: Super Signal – Skyblade Edition 是一套專為趨勢交易設計的智能信號系統。 其採用多重濾波邏輯,僅篩選出具有明確方向性、動能強勁且波動結構健康的走勢進場點。 本系統 不預測高點或低點 ,只有在同時滿足以下三項條件時才會觸發交易信號: 趨勢方向明確 動能持續增強 波動率結構穩定 此外,系統還結合市場流動性分析,以進一步提升信號的準確性與觸發時機。 信號特性: 所有箭頭信號皆為 100% 無重繪,無延遲 信號一旦出現即固定於圖表,不會閃爍或消失 提供圖表箭頭、資訊面板、彈出通知、聲音提示及推播訊息 支援 EA 呼叫(Buffer 輸出),可整合至自動化交易或信號跟單系統 提供預設參數模板,免調整即可使用,適合新手快速上手 總結: Super Signal – Skyblade Edition 是一款邏輯清晰、穩定高效的專業趨勢型
Cycle Sniper
Elmira Memish
4.39 (36)
Please contact us after your purchase and we will send you the complimentary indicators to complete the system Cycle Sniper is not a holy grail but when you use it in a system which is explained in the videos, you will feel the difference. If you are not willing to focus on the charts designed with Cycle Sniper and other free tools we provide, we recommend not buying this indicator. We recommend watching the videos about the indiactor and system before purchasing. Videos, settings  and descri
CRT Candle Range Theory HTF MT4.   Ultimate CRT Indicator: Advanced ICT Concepts and Malaysian SnR Trading System Master the Market Maker's Footprints with the Most Advanced Candle Range Theory Indicator Discounted   Price   $50  !!     Secure your lifetime access   now   before it switches to   subscription-only ! Unlock the true power of  Smart Money Concepts (SMC)  and trade precisely like the institutions with the  Ultimate CRT Indicator . Built exclusively for serious traders, this indicat
A. 什么是 A2SR ?   * 这是一个领先的技术指标(没有重绘,没有滞后)。  -  指导 : -- 在  https://www.mql5.com/en/blogs/post/734748/page4#comment_16532516 -- 和  https://www.mql5.com/en/users/yohana/blog A2SR 在确定支撑(需求)和阻力(供应)水平方面有一种特殊的技术。 与我们在网上看到的普通方式不同,A2SR 在确定实际 SR 级别时有一个独创的概念。 原技术不是从网上拿来的,也没有在网上公开过。 A2SR 将根据您的交易风格自动选择 SR 级别。 即使您正在更改时间范围,但 SR 级别仍将保留在其位置上。 因为实际的 SR 不是从你使用的时间范围内获得的。 A2SR 拥有完整的交易工具 。 实际支持(需求)和阻力(供应)的真正概念。 新闻事件和央行讲话的市场情绪。 新闻事件和趋势的主要货币强度 (MCS) 的真正概念。 今天的当前趋势,包括放置位置的建议。 SR、Breakout 和 Breakdown 的自动水平趋势线。 您会发现分析图表
Trend Lines PRO
Roman Podpora
5 (1)
TREND LINES PRO 帮助您了解市场真正的方向转变点。该指标显示真实的趋势反转点以及主要参与者重新入场的时机。 您可以看到 BOS线、 趋势变化和更高时间框架的关键水平——无需复杂的设置或不必要的干扰。信号不会重绘,并在K线收盘后仍然保留在图表上。 VERSION MT 5    -   与……搭配使用时,可发挥其最大潜力   RFI LEVELS PRO 指示器 该指标显示的内容: 实际变化 趋势(BOS 线) 一旦信号出现,它就始终有效!这与会重绘的指标有着重要的区别,后者可能会发出信号后又改变信号,从而导致资金损失。现在,您可以更精准、更准确地进入市场。此外,还有一个功能,会在箭头出现后为K线着色,直到达到目标价位(止盈)或出现反转信号为止。 重复条目   以及主要玩家的充值 为了提高寻找入场点时的视觉清晰度,我们创建了一个模块,该模块首先显示买入/卖出区域,并在该区域内寻找最佳入场点。此外,我们还加入了智能逻辑来管理止损位,该逻辑会随着时间的推移逐步降低止损位的大小,从而降低入场交易时的初始风险(移动止损位)。 信号强度水平(BOS) 该指标采用三个显著性等级来衡量
PZ Divergence Trading
PZ TRADING SLU
5 (2)
棘手的发现和频率稀缺是最可靠的交易方案之一。该指标使用您喜欢的振荡器自动查找并扫描常规和隐藏的发散。 [ 安装指南 | 更新指南 | 故障排除 | 常见问题 | 所有产品 ] 容易交易 发现常规和隐藏的分歧 支持许多知名的振荡器 根据突破实现交易信号 显示适当的止损和获利水平 可配置的振荡器参数 可自定义的颜色和尺寸 按条形过滤大小差异 实现绩效统计 它实现了电子邮件/声音/视觉警报 为了提供广阔的市场前景,可以使用不同的振荡器在同一张图表中多次加载该指标,而不会产生干扰。该指标支持以下振荡器: RSI CCI MACD OSMA 随机 动量 很棒的振荡器 加速器振荡器 威廉姆斯百分比范围 相对活力指数 由于差异可能会扩大很多,尤其是在外汇市场中,因此该指标产生了转折:它在等待交易突破之前等待donchian突破确认差异。最终结果是带有非常可靠的交易信号的重新粉刷指示器。 输入参数 幅度:用于寻找差异的之字形周期 振荡器-选择要加载到图表的振荡器。 突破期-交易信号的突破期,以柱为单位。 发散类型-启用或禁用发散类型:隐藏,常规或两者。 最小散度单位为条形-最小散度单位为条形
RFI levels PRO
Roman Podpora
5 (1)
该指标能够准确显示反转点和价格回落区域。     行业领军人物 。您能洞察新趋势的形成,并以最高的精准度做出决策,掌控每一笔交易。 与……结合时,展现其最大潜力     趋势线专业版   指标  VERSION MT5 该指标显示的内容: 新趋势开始时的反转结构和反转水平及其激活。 显示屏   获利了结   和   止损   风险回报比最低的水平     RR 1:2       。 具有智能减值逻辑的止损。 显示指定指标中两种趋势类型的反转形态。 指标: 根据     趋势线     (全球趋势变化) 潮流专业版     (趋势快速变化) 简单有效   扫描器   实时趋势(新增)。 多时间框架工具筛选。 展示   利润   在 LOGIC AI 信号之后。 以下列出今日走势积极的金融工具。(RB键) 能够为终端启用通知(警报)功能,并向移动设备推送通知。 逻辑人工智能     — 利用人工智能寻找最佳切入点。 只有在启用 MTF(多时间框架分析)模式时,该功能才可用。 兼容性。 当与趋势线指标结合使用时,该指标能发挥其最大潜力。 这     RFI LEVELS PRO    
KURAMA GOLD SIGNAL PRO(MT4)— 7层过滤 · 自动止盈止损 · 质量评分 · 信号历史保存 | 完整的XAUUSD交易系统 实时不重绘。信号出现的瞬间,箭头、入场、止盈、止损当场锁定,之后绝不移动。你交易的就是这个实时信号。而且在v7.20中,每一个真正发出的信号都会自动保存,并在重启后精确还原。 购买者专属赠品 购买永久授权,即可免费获得 AI Zone Radar(价值$59)+ 完整PDF手册。在产品价格之外,额外附赠价值$59的赠品。购买后在MQL5上给我留言即可。 AI Zone Radar: https://www.mql5.com/en/market/product/175834 在黄金交易者社区中被实际使用,因精度与易用性而广受好评。 你的难题 —— 以及解决方案 黄金一天波动$30–$50。你知道机会就在那里。但这些情况是否似曾相识: - 入场太早,价格逆行$10后才朝你的方
Legacy of Gann
Pavel Zamoshnikov
4.83 (12)
The indicator very accurately determines the levels of the possible end of the trend and profit fixing. The method of determining levels is based on the ideas of W.D.Gann, using an algorithm developed by his follower Kirill Borovsky. Extremely high reliability of reaching levels (according to K. Borovsky  - 80-90%) Indispensable for any trading strategy – every trader needs to determine the exit point from the market! Precisely determines targets on any timeframes and any instruments (forex, met
Advanced Supply Demand
Bernhard Schweigert
4.91 (302)
现在优惠 30%! 任何新手或专业交易者的最佳解决方案! 该指标是一款独特、高质量、且价格合理的交易工具,因为我们已经整合了许多专有功能和新公式。 依据此更新,您将能够显示双重时间帧区域。 您不仅可以显示一个较高的时间帧,还可以同时显示图表时间帧,加上更高的时间帧:显示嵌套时区。 供需双方所有交易者都会喜欢它。 :) 重要信息披露 高级供需的最大潜力,请访问 https://www.mql5.com/zh/blogs/post/720245   想象您的交易如何得以改善,是因为您能够精准定位入场或目标位吗? 构建于新的底层算法,它可以更轻松地识别出买卖双方之间的潜在失衡。 这是因为它以图形方式展示供需最强劲区域,及其过去的表现(显示旧区域)。 这些功能旨在帮助您更轻松地发现最佳入场区域和价位。 现在您可以针对您的交易品种和时间帧来优化和编辑区域强度! 高级供需指标适用于所有产品和时间帧。 它是一个新的公式,非常新的功能是两个区域强度函数可由用户输入进行调整! 这在交易中是一大优势。 当您学习如何使用专有功能,例如带有价格游离最小 X 因子的区域强度时,您能够判断该区域强劲与否。 供需
Artemis Gold M1 Scalper Artemis Gold M1 Scalper 是一款高级 MT4 指标,专为 XAUUSD 交易者打造,适合希望在 M1 时间周期上以更清晰、更结构化的方式进行黄金剥头皮交易的用户。 它不是普通的箭头信号指标。Artemis 将动态支撑与阻力、趋势确认、动量过滤、基于 ATR 的交易水平、信号质量评分、市场状态分析、交易时段强度、活跃交易保护以及清晰的仪表盘整合到一个专注的剥头皮交易框架中,专门围绕黄金快速波动的特性而设计。 为什么 Gold M1 需要不同的方法 黄金的波动速度和幅度通常比标准外汇货币对更快、更剧烈。在 M1 时间周期上,这种波动性很容易迅速变成噪音信号、滞后入场和低质量交易机会。许多剥头皮指标要么让图表充满箭头,要么只显示信号,却不解释信号背后的市场背景。 Artemis 的理念正好相反:先过滤噪音,再显示带有背景信息的结构化机会。 信号由趋势方向、回调行为、动态支撑与阻力、RSI 动量、ATR 波动率、更高时间周期确认、点差条件、交易时段强度、市场状态和信号质量评分共同支持。这为交易者提供了一个更清晰的框架来解读
Neo Wave PRO
Nikolay Raykov
5 (1)
Price & Time Market Structure Indicator A professional market structure tool that analyzes waves through both price and time — not price alone. Main Description NeoWave PRO is a professional market structure indicator for MetaTrader 4 designed for traders who want to move beyond traditional one-dimensional wave tools such as ZigZag, swing indicators, and basic high/low systems. Most wave indicators analyze only one thing: Price. But a real market wave is not only a price movement. A true wave de
PRO Renko System
Oleg Rodin
5 (31)
PRO Renko Arrow Based System for trading renko charts.  准确的信号交易任何外汇工具. 另外,我将免费提供系统的附加模块! PRO Renko系统是RENKO图表上高度准确的交易系统。该系统是通用的。 该交易系统可应用于各种交易工具。 该系统有效地中和了所谓的市场噪音,打开了获得准确反转信号的通道。 该指标易于使用,只有一个参数负责产生信号。 您可以很容易地使算法适应您感兴趣的交易工具和renko酒吧的大小。 我很乐意通过提供任何咨询支持来帮助所有客户有效地使用该指标。 祝您交易成功!购买后,立即写信给我! 我将与您分享我的建议和我的renko发电机。 另外,我将免费提供系统的附加模块!
本指标是实践实战交易完善的波浪自动分析的指标 !  案例... 注: 波浪分级用西方叫法不习惯,因受到缠论(缠中说禅)命名方式习惯的影响,我是将基础波浪命名为 笔 ,将二级波段命名为 段 ,同时具有趋势方向的段命名为 主趋段 (以后笔记中都是这种命名方式,先告知大家),但是算法上和缠论关系不大切勿混淆.反映的是本人分析盘面总结的 千变万化纷繁复杂的运行规律 . 对波段进行了标准化定义,不再是不同人不同的浪  ,    对人为干扰的画法进行了排除,在严格分析进场起到了关键的作用 . 使用这个指标,等于将交易界面提升美感,抛弃最原始的K线交易带你进入新的交易层次.如果不是为了交易,在宣传上也将使客户观感提升层次. 指标内容: 1. 基础波浪 (笔) : 首先我们找出了价格波动过程中的基础波动拐点,当然他的有序性低,为下一步的计算提供基础. 2. 二级波段( 段 ) :在基础波浪的基础上,通过算法分析得到层级更明显的二级波段,二级波段为波浪提供了分析基础 3. 波浪( 浪 ): 有着更清晰的趋势,更清晰直观的方向.分析一个波浪是否延续,需要看二级波段的形态,分析二级的构成,可以得出波浪
Non Repaint Trend Bands
Ravshan Chuliev
5 (1)
Channel Trend Bands  MTF – A Comprehensive Indicator for Market Analysis MetaTrader 5 Version Simple to Use, Effective in Application User-Friendly and Suitable for All Traders This indicator stands out due to its straightforward functionality. Whether you're a beginner exploring the market or an experienced trader refining your strategy, this tool offers valuable insights. Using a Triangular Moving Average (TMA) with additional ATR-based bands , it provides structured market data to support w
M W Pattern Pro
Noiros Tech
4.14 (7)
M & W Pattern Pro is an advanced scanner for M and W patters , it uses extra filters to ensure scanned patterns are profitable. The indicator can be used with all symbols and time frames. The indicator is a non repaint indicator with accurate statistics calculations. To use , simply scan the most profitable pair using the statistics dashboard accuracy , then enter trades on signal arrow and exit at the TP and SL levels. STATISTICS : Accuracy 1 : This is the percentage of the times price hits TP
Extreme Value Sniper is a detrended price indicator  Indicator finds the potential reversal levels by checking value ranges and price cycles. MT5 Version of the product :  https://www.mql5.com/en/market/product/114550 It shows the overbought and oversold levels using the average range. Overbought Levels are between 4 and 10 Oversold levels are bewtween -4 and -10 Those levels can be used as a reversal levels. Extreme Value Sniper look for some special divergence and convergence patterns to c
TrendMaestro
Stefano Frisetti
4 (4)
Attention: beware of SCAMS, TRENDMAESTRO is only ditributed throught MQL5.com market place. note: this indicator is for METATRADER4, if you want the version for METATRADER5 this is the link:  https://www.mql5.com/it/market/product/108106 TRENDMAESTRO ver 2.5 TRENDMAESTRO recognizes a new TREND from the start, he never makes mistakes. The certainty of identifying a new TREND is priceless. DESCRIPTION TRENDMAESTRO identifies a new TREND in the bud, this indicator examines the volatility, volumes a
Smart Price Action Concepts
Issam Kassas
4.79 (14)
本产品已针对 2026 年市场进行更新,并针对最新 MT5 版本进行了优化。 价格更新通知: Smart Price Action Concepts 目前价格为 $200 。 接下来的 30 次购买 后,价格将上涨至 $299 。 特别优惠: 购买后,请发送私信给我,即可领取 免费赠品 + 礼物 。 首先需要强调的是,这款交易工具是不重绘、不回绘、不延迟的指标,因此非常适合专业交易使用。 Online course , and manual Smart Price Action Concepts 指标是一款非常强大的工具,适合新手和有经验的交易者使用。它将 20 多个实用指标整合到一个系统中,结合了 Inner Circle Trader Analysis 和 Smart Money Concepts Trading Strategies 等高级交易理念。该指标专注于 Smart Money Concepts,帮助交易者理解大型机构如何交易,并辅助预测其市场行为。 它特别擅长流动性分析,使交易者更容易理解机构交易逻辑。它也非常适合预测市场趋势并仔细分析价格走势。通过让交易与机构策略保
作者的更多信息
OrderFlow Absorption – 專業級MT5買賣差與吸收訊號指標 釋放真正訂單流分析的力量,OrderFlow Absorption 是MetaTrader 5上最強大的買賣差(Delta)直方圖與吸收訊號指標。專為想看清每一個價格波動背後真相的交易者設計,這個工具揭示了隱藏的買賣壓力與推動市場的吸收事件。 功能特色 買賣差直方圖視覺化:   以清晰的色彩直方圖即時顯示買方與賣方壓力。 吸收訊號偵測:   先進邏輯自動辨識多空吸收事件,及早預警潛在反轉。 圖表標記:   吸收訊號直接標示於主圖表,方便視覺辨識。 彈出式警報:   新吸收訊號出現時即時通知。 自訂門檻:   過濾弱訊號,專注高勝率機會。 資源管理:   高效運算,適用於大型圖表也能流暢運行。 全品種兼容:   適用於任何商品與週期,包括外匯、指數、商品等。 簡易整合:   參數簡單,快速上手與調整。 OrderFlow Absorption 的邏輯說明 OrderFlow Absorption 採用專利演算法,能在沒有完整Tick數據的情況下,估算每根K棒的買賣壓力(Delta)。它分析成交量、價格行為、K
Key Zone
Chi Sum Poon
Please refer to full version: https://www.mql5.com/en/market/product/140908 Key Zone Detector Key Level Supply & Demand Zone Detector   Overview A sophisticated supply and demand zone detection indicator that identifies and rates key price levels where significant market activity occurs. The indicator uses fractal analysis and multiple validation methods to detect and classify trading zones. Key Features Zone Detection Auto-detects support and resistance zones Uses dual fractal system (fast and
FREE
Flat Reminder
Chi Sum Poon
Flat Reminder Overview Flat Reminder is a powerful technical analysis tool that identifies and highlights price consolidation zones on your chart. It detects when price action slows down and moves sideways, indicating potential reversal points, continuation setups, or key decision zones in the market. Key Features Consolidation Detection : Automatically identifies flat price zones where market momentum decreases Range Measurement : Calculates and displays the exact range of each consolidation in
FREE
MA Reminder
Chi Sum Poon
MA Reminder Overview MA Reminder is a versatile moving average indicator that provides visual cues and background coloring to help traders identify trend direction and potential trading opportunities based on MA crossovers. Key Features Multiple Moving Averages : Displays up to 4 configurable moving averages on the chart Background Coloring : Highlights chart background based on MA1 and MA2 crossovers Timeframe Flexibility : Choose between dynamic (follows chart timeframe) or fixed timeframe mod
FREE
大家睇住冬令夏令時間呀~ 附上自己用緊的 Setting, 不代表是最好的, 還需大家反饋 附上真倉紀錄, 全部EA入市, 但出市我成日手動, 但手動的效果欠佳, 應該信EA的... 附上今日2024/2/23的Cap圖, 16727.44追升, 16819.28手動平左, 高位~16895,  有進步空間的 --------------------- Min distance 係咩 ? Check time同Ordertime相距的距離 原意係, 兩個價差唔多即係冇方向, 就唔開單 用呢個最少距離可以只做大單邊 Checktime恆指16000 最少距離10000 <- 100點 Ordertime 16100以上/15900以下先會開 其他都當佢橫行唔玩 --------------------- -Check time means record the reference hsi index where recorded it's reference start index point, am i correct? Yes, the price at that refere
MTF Parabolic SAR S11
Chi Sum Poon
5 (1)
附上20240307市況, 順勢加單真開心 附上20240306市況, 順勢加單真開心 ※   ※   ※ 此設定極暴力, 極大風險, 請自行Backteset並更改至合適風險水平 ※   ※   ※ 還有請分享設定和EA更改需求給我 ※   ※   ※ 此EA跟據 multi time frame Parabolic SAR指標作出交易; 如M15 SAR買入信號中, M1的SAR買入信號便會BUY, M1的SAR賣出信號不會SELL; 可以用SAR信號入市和出市 可以反轉SAR的信號入市和出市 可以順勢/馬丁加單 此EA適用於所有市場, 黃金, 指數, 外匯...... Entry Signal SL: use the SAR signal dot as the SL level take buy order as example, use the dot below to SL 1 means at the dot 0.5 means the half of the open price and the SAR dot Please do backtest to
市場上的交易程式中, 很多時候也是在每支 Bar 一開始時交易, 所謂 "Per Bar" 我們可以在每支 Bar 的頭幾秒推斷之後的走勢, 讓子彈飛吧~ 此 EA 比較 Bar Open 價和 "幾秒後" 的價作出交易 此 EA 適用於所有市場, 黃金, 指數, 外匯...... 請大家發掘不同市場不同時段玩法, 可以試炒新聞? 非農? 如果各位朋友在任何市場找到有效的交易時段,請與我分享,謝謝! 可能 每分鐘頭幾秒 每第5分鐘嘅頭幾秒 每半個鐘嘅頭幾秒 每一個鐘嘅頭幾秒 都會有啲啟示 ====== ---Bar Open Time Trading--- Most of the EA in the market, it is often the case that trades are executed at the beginning of each bar, known as "Per Bar." We can infer the future trend in the first few seconds of each bar. Let the bullets fly! T
物極必反、否極泰來 此 EA 捕捉連續陰(陽)燭創新低(高)時的技術性反彈(Technical Rally) 在 連續陰 燭 低位 回調開始時反手買升 在 連續 陽 燭 高位 回調開始時反手買跌 === What goes to the extreme must reverse; what goes to the negative will bring prosperity. This EA captures technical rallies when there are consecutive bearish (bullish) candles making new lows (highs). It buys on the upward reversal when a consecutive bearish candle starts to retrace from a low position. It sells on the downward reversal when a consecutive bullish candle starts to retrace from a
Raging Daemon
Chi Sum Poon
瞬獄殺 此 EA 可在新聞發佈最遲前 1 秒兩邊掛單 自己拉落 demo live 行下睇下發生咩事先 自行 BT 睇風險, 不建議大家賭博 Screenshots 是 美國非農就業數據的真倉結果, 全盡全實 我試左 3 次先敢放上黎 是可以輸的 但贏一次可以輸4-5次 可以炒星期五 8:30 的大新聞 我炒過 CPI, ISMPPMI, PMI, 議息, ADP, 原油果個唔知咩 輕拳輕拳前輕腳重拳 希望大家岀左兩次輕拳先 如果 Stop Distance 較近, 排隊會早少少, 滑價應該會少D, 岩邊既話會賺多D 但係較容易震盪時錯邊/ SO 如果 Stop Distance 較遠, 排隊會後少少, 滑價有機會會多D, 會賺少D 但係易D岩邊 ------------------------------ Raging Demon This EA can place stop orders on both sides up to 1 second before the news release. Please try the demo live version you
BallBallG
Chi Sum Poon
波波金 波波金   智能交易系統 (EA) 利用多種技術指標來進行交易決策。它主要使用平均方向指數 (ADX) 及其上升/下降趨勢、DI+ 和 DI- 差異、相對強弱指數 (RSI) 和拋物線轉向指標 (Parabolic SAR) 進行交易策略。此策略應用於六個不同的時間框架,以提高穩健性和準確性。 主要特點: 基於指標的策略 :交易基於來自 ADX、DI+ 和 DI- 差異、RSI 和拋物線轉向指標的信號。 多時間框架分析 :利用六個不同的時間框架來優化進出點。 靈活的交易風格 :支持單一投注交易和馬丁格爾策略。 多市場適用性 :適用於包括黃金、指數、外匯等多種市場。 波波金   為尋求精密且適應性強的交易工具的交易者設計,能夠在不同的市場條件下導航。 ====== 請 PM 我取得 set files,或者依照 BT report 輸入。 Pls PM me for the set file, or follow the BT report to input. BallBallG The BallBallG Expert Advisor (EA) leverages
Mad Max T
Chi Sum Poon
瘋狂麥斯 此EA跟據 ADX, ADX 升緊/跌緊, Di+ 和 Di- Difference, RSI, 5 個 TimeFrame 6 條 MA 指標共30條MA, 和它們的相差 作出交易; 可玩單注, 可玩馬丁 此EA適用於所有市場, 黃金, 指數, 外匯...... ====== Mad Max This EA trades based on the ADX, ADX rising/falling, Di+ and Di- difference, RSI, 5-timeframe 6-MA, total 30 MAs indicators, and their difference. Can trade single bets, can trade Martingale. This EA is suitable for all markets, including gold, indices, forex, and more.
一齊一齊一齊沽 此EA跟據 ADX, ADX 升緊/跌緊, Di+ 和 Di- Difference, RSI, 5 個 TimeFrame 2 條 ichimoku conversion, base line 指標共10條MA, 作出交易; 可玩單注, 可玩馬丁 此EA適用於所有市場, 黃金, 指數, 外匯...... ====== Ichiichiichiku This EA trades based on the ADX, ADX rising/falling, Di+ and Di- difference, RSI, 5-timeframe 2-ichimoku conversion, base line, total 10 MAs indicators. Can trade single bets, can trade Martingale. This EA is suitable for all markets, including gold, indices, forex, and more.
YinYang Marty
Chi Sum Poon
陰陽馬丁 此EA跟據 2 個 TimeFrame ADX, ADX 升緊/跌緊, Di+ 和 Di- Difference, RSI, 作出交易; 馬丁單限制: 上支陽燭才可開Buy單;   上支陰燭才可開Sell單 可玩單注, 可玩馬丁 此EA適用於所有市場, 黃金, 指數, 外匯...... ====== YinYang Marty This EA trades based on 2-timeframe ADX, ADX rising/falling, Di+ and Di- difference, RSI indicators. Martin Rule: Only open a Buy order when the previous candlestick is bullish; Only open a Sell order when the   previous   candlestick is bearish. Can trade single bets, can trade Martingale. This EA is suitable for all markets,
DarkGhost
Chi Sum Poon
DarkGhost DarkGhost 是一個突破形單注的 EA(智能交易系統),利用多種技術指標進行交易決策。它主要使用以下指標來確定動能: 平均真實範圍指標(ATR)的數值 平均方向指數(ADX)的數值以及判斷ADX是上升還是下降中 DI+ 和 DI- 之間的差異 此策略應用於六個不同的時間框架,以提高穩健性和準確性。 交易信號: 利用 DI+、DI-、RSI 和拋物線轉向指標的信號(Parabolic SAR)。 動能指標: 利用 ATR 的數值、ADX 的數值以及判斷ADX是否上升或下降中,以及 DI+ 和 DI- 之間的差異來確定動能。 進出點: 入市:在足夠動能時突破開單 出市:設定利潤目標(tp)、損失止損(sl)、移動止損(trailing stop) 多時間框架分析: 利用六個不同的時間框架來優化進出點。 多市場適用性: 適用於包括黃金、指數、外匯等多種市場。 DarkGhost 設計為尋求精密且適應性強的交易工具的交易者,能夠在不同的市場條件下導航。
關鍵區域偵測器 關鍵支撐與需求區域偵測工具 概述 一款先進的供需區域偵測指標,能識別並評級市場關鍵價格水平。該指標運用分形分析與多重驗證機制,精準標記並分類交易熱區。 核心功能 區域偵測 • 自動標記支撐位與阻力位 • 採用快慢雙分形系統雙重驗證 • 根據平均真實波幅(ATR)動態調整區域厚度 • 智能合併重疊區域保持界面簡潔 區域分級 • 成熟區域:經4次以上測試,可靠性最高 • 驗證區域:經1-3次測試,具良好參考性 • 待測區域:尚未經價格測試的新生區域 • 變節區域:支撐/阻力屬性發生轉換的區域 • 脆弱區域:較可能失效的薄弱地帶 強度評分系統 • 量化區域強度百分比(0-100%) • 綜合加權計算: 區域存續時間(30%權重) 測試次數(40%權重) 近期測試活躍度(30%權重) 視覺化設計 • 依強度與類型分色標記 • 顯示價格測試區域的接觸點標記 • 可自訂區域樣式(實心/框線/寬度) • 支持延伸區域至當前價位 • 可選顯示分形觸發點 預警系統 • 價格觸及區域時觸發警報 • 彈窗與音效通知自訂 • 可調整警報冷卻時間 自訂選項 • 歷史回
Energy X
Chi Sum Poon
EnergyX Indicator EnergyX is a unique tool that visualizes the "energy" of the market in a separate window. It helps you quickly see when energy is rising or falling, making it easier to spot potential trading opportunities. Yellow bars  show when energy is increasing. Red bars  show when energy is decreasing. How to Use: When price is approaching a  resistance  level: If energy is high and increasing (yellow), there is a higher chance the price will break the resistance. You may consider a  buy
OrderFlow Absorption – 專業級MT4買賣差與吸收訊號指標 釋放真正訂單流分析的力量,OrderFlow Absorption 是MetaTrader 4上最強大的買賣差(Delta)直方圖與吸收訊號指標。專為想看清每一個價格波動背後真相的交易者設計,這個工具揭示了隱藏的買賣壓力與推動市場的吸收事件。 功能特色 買賣差直方圖視覺化:   以清晰的色彩直方圖即時顯示買方與賣方壓力。 吸收訊號偵測:   先進邏輯自動辨識多空吸收事件,及早預警潛在反轉。 圖表標記:   吸收訊號直接標示於主圖表,方便視覺辨識。 彈出式警報:   新吸收訊號出現時即時通知。 自訂門檻:   過濾弱訊號,專注高勝率機會。 資源管理:   高效運算,適用於大型圖表也能流暢運行。 全品種兼容:   適用於任何商品與週期,包括外匯、指數、商品等。 簡易整合:   參數簡單,快速上手與調整。 OrderFlow Absorption 的邏輯說明 OrderFlow Absorption 採用專利演算法,能在沒有完整Tick數據的情況下,估算每根K棒的買賣壓力(Delta)。它分析成交量、價格行為、K
Breakout Detector —— 進階波動率突破偵測工具 描述 Breakout Detector 是一款先進的技術指標,能夠偵測低波動率階段,這些階段通常預示著即將出現的重大價格突破。該指標結合帕金森波動率計算與 RSI 分析,協助交易者在突破發生前發現潛在機會。 你面臨的問題 錯過突破 :等你發現突破時,最佳進場點已經錯過 假突破 :在高波動時進場,價格卻很快反轉 時機難以掌握 :難以判斷市場何時「蓄勢待發」 波動率混淆 :難以分辨正常波動與真正的低波動壓縮區 進場延遲 :突破型態出現時,價格已大幅波動 本指標如何解決這些問題 提前預警 :在突破發生前,偵測低波動階段(數值低於30) 視覺化準備區 :以金色矩形高亮壓縮區域,方便辨識 智慧提醒 :當指標數值跌破15時發出通知,提示極低波動 客觀量化 :提供0-100的波動率讀數,減少主觀判斷 多週期支援 :適用於所有時間週期,靈活分析 指標邏輯 帕金森波動率計算 : 利用最高價與最低價的關係,而非僅收盤價 更精確反映日內波動 公式: √((hlc3 / ((length × 4) × ln(2))) × Σ(ln(high
TrendBoard
Chi Sum Poon
# TrendBoard - 終極多時間框架技術分析儀表板 **用市場上最全面的趨勢分析工具改變您的交易!** ## **提供免費試用版 - 立即下載測試!** 體驗專業級技術分析的強大功能。下載試用版,了解為什麼交易者稱這是他們交易策略的"遊戲規則改變者"。 ## **TrendBoard 的獨特之處** TrendBoard 將 **8 個強大的技術指標** 跨 **7 個時間框架** 整合到一個清潔、視覺化的儀表板中。無需再在圖表間切換或手動計算訊號 - 一次獲得所有時間框架的即時趨勢方向! ### **主要特色** - ** 8 個專業指標** - 完整的技術分析套件 - ** 7 個時間框架** - 涵蓋 M1、M5、M15、M30、H1、H4、D1 - ** 視覺訊號網格** - 趨勢方向的顏色編碼(綠色↑/紅色↓/橙色→) - ** 智能邏輯** - 進階多層次閾值分析 - **️ 完全可自定義** - 根據您的策略調整所有參數 - ** 即時更新** - 即時市場狀況監控 ## **8 個指標說明** ###
CVD背離偵測 - 先進成交量能差分析   我們解決的問題 大多數交易者僅依賴價格走勢,錯過了揭示真實市場情緒的關鍵成交量流向信息。傳統指標滯後於價格變動,導致進場過晚和風險管理不佳。 CVD背離偵測 通過分析價格與成交量差動量之間的關係來解決這個問題,在重大市場變動之前為您提供早期預警信號。   CVD背離分析的優勢   早期市場逆轉偵測   - 在價格圖表出現之前發現動量轉變   智能資金追蹤   - 觀察機構何時累積或分配   減少虛假信號   - 成交量確認價格走勢,提供更高概率設置   多時間框架優勢   - 適用於所有時間框架,從剝頭皮到波段交易   通用應用   - 兼容外匯、股票、商品和加密貨幣   4個市場階段 - 真實交易故事 設想EUR/USD接近重要支撐位...   階段1:初始下跌(CVD在零線上方下跌) 價格從阻力位開始下跌 CVD信號下跌但保持在零線上方 解讀:   賣壓增強,但買方仍然存在   階段2:加速賣出(CVD跌破零線以下) 價格繼續向支撐位下跌 CVD信號跌破零線 解讀:   賣方佔主導,動量
筛选:
无评论
回复评论