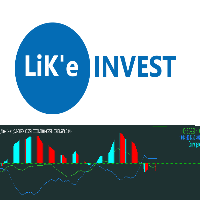
MACDAdaptive

MACD Adaptive is a MACD that adjusts its periods to the market and never repaints.

Every bar is calculated only with the data available up to that bar. If you reload the chart or restart the terminal, the history looks exactly the same as it did live. What you see in the past is what you would have seen in real time.

MAIN FEATURES

  • Adaptive periods: shorter in a clean trend, longer in choppy noise. Can be switched off for a classic MACD.
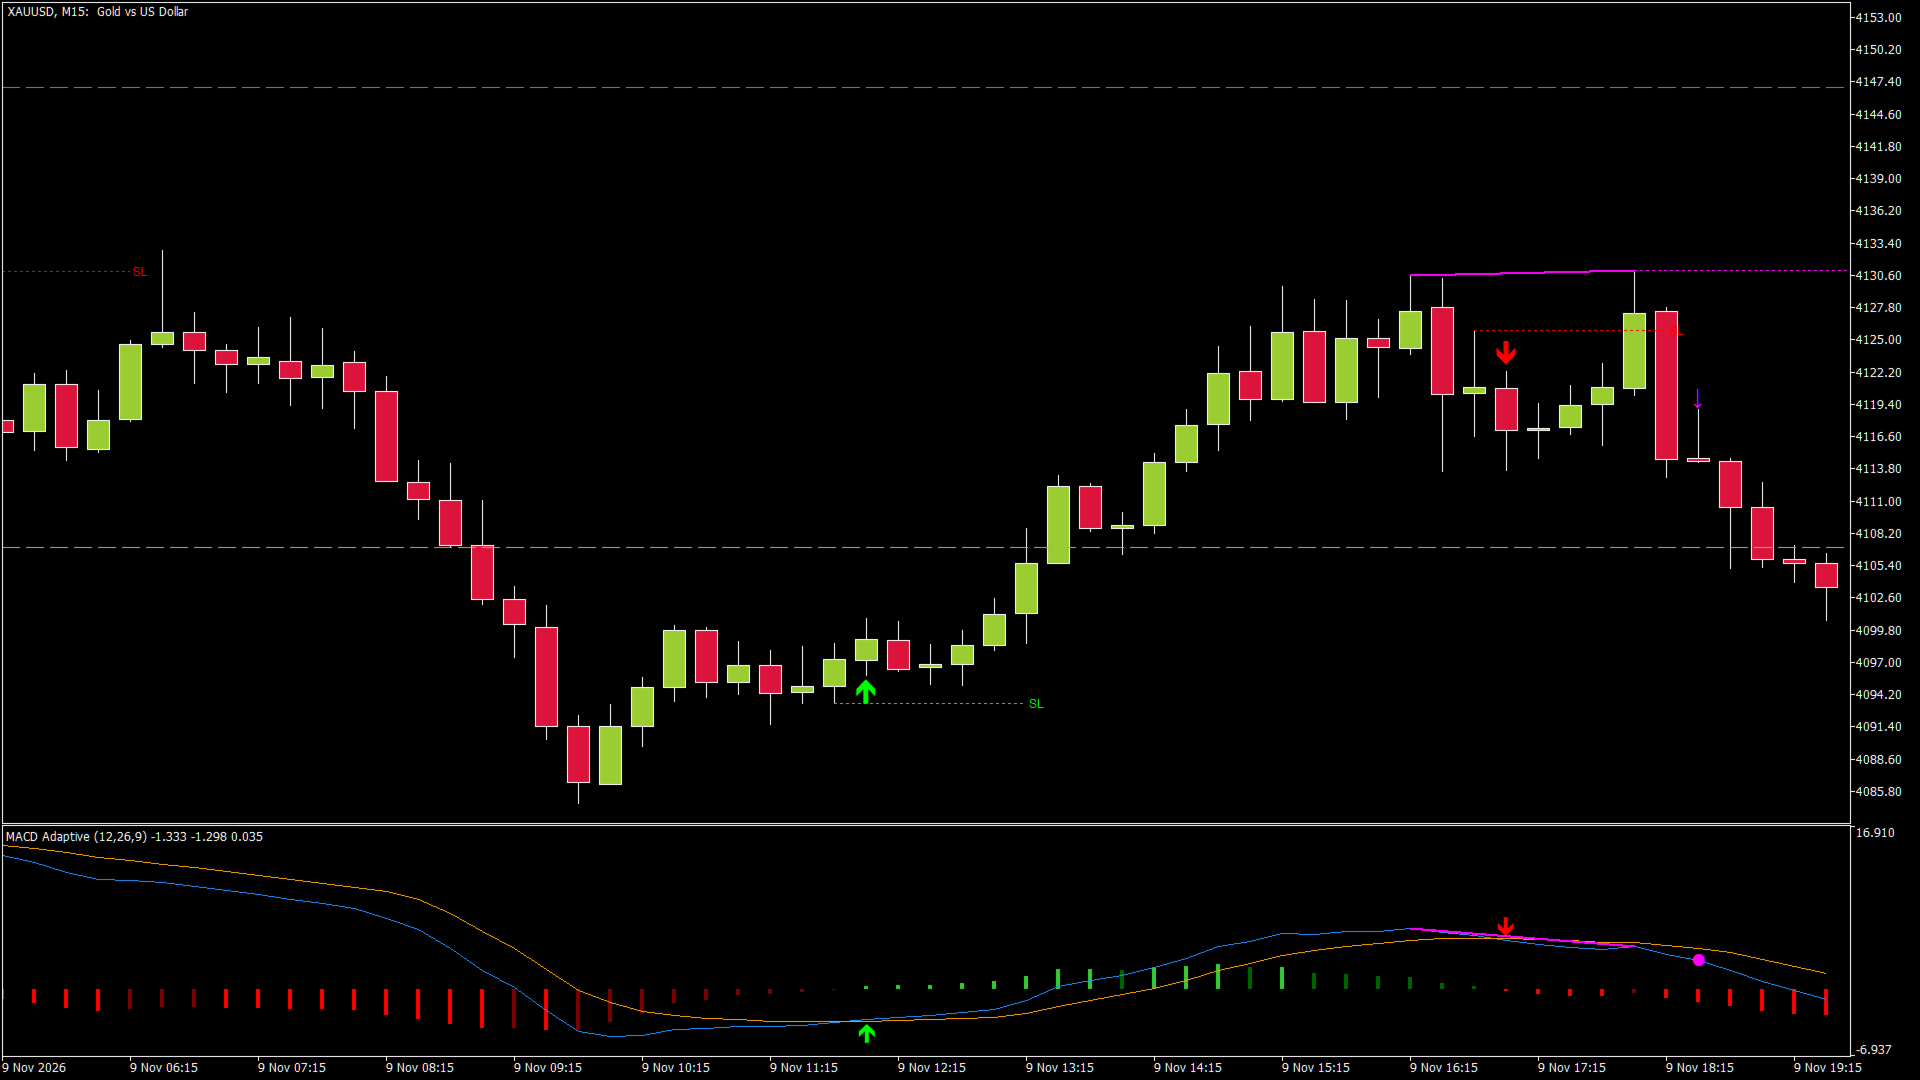
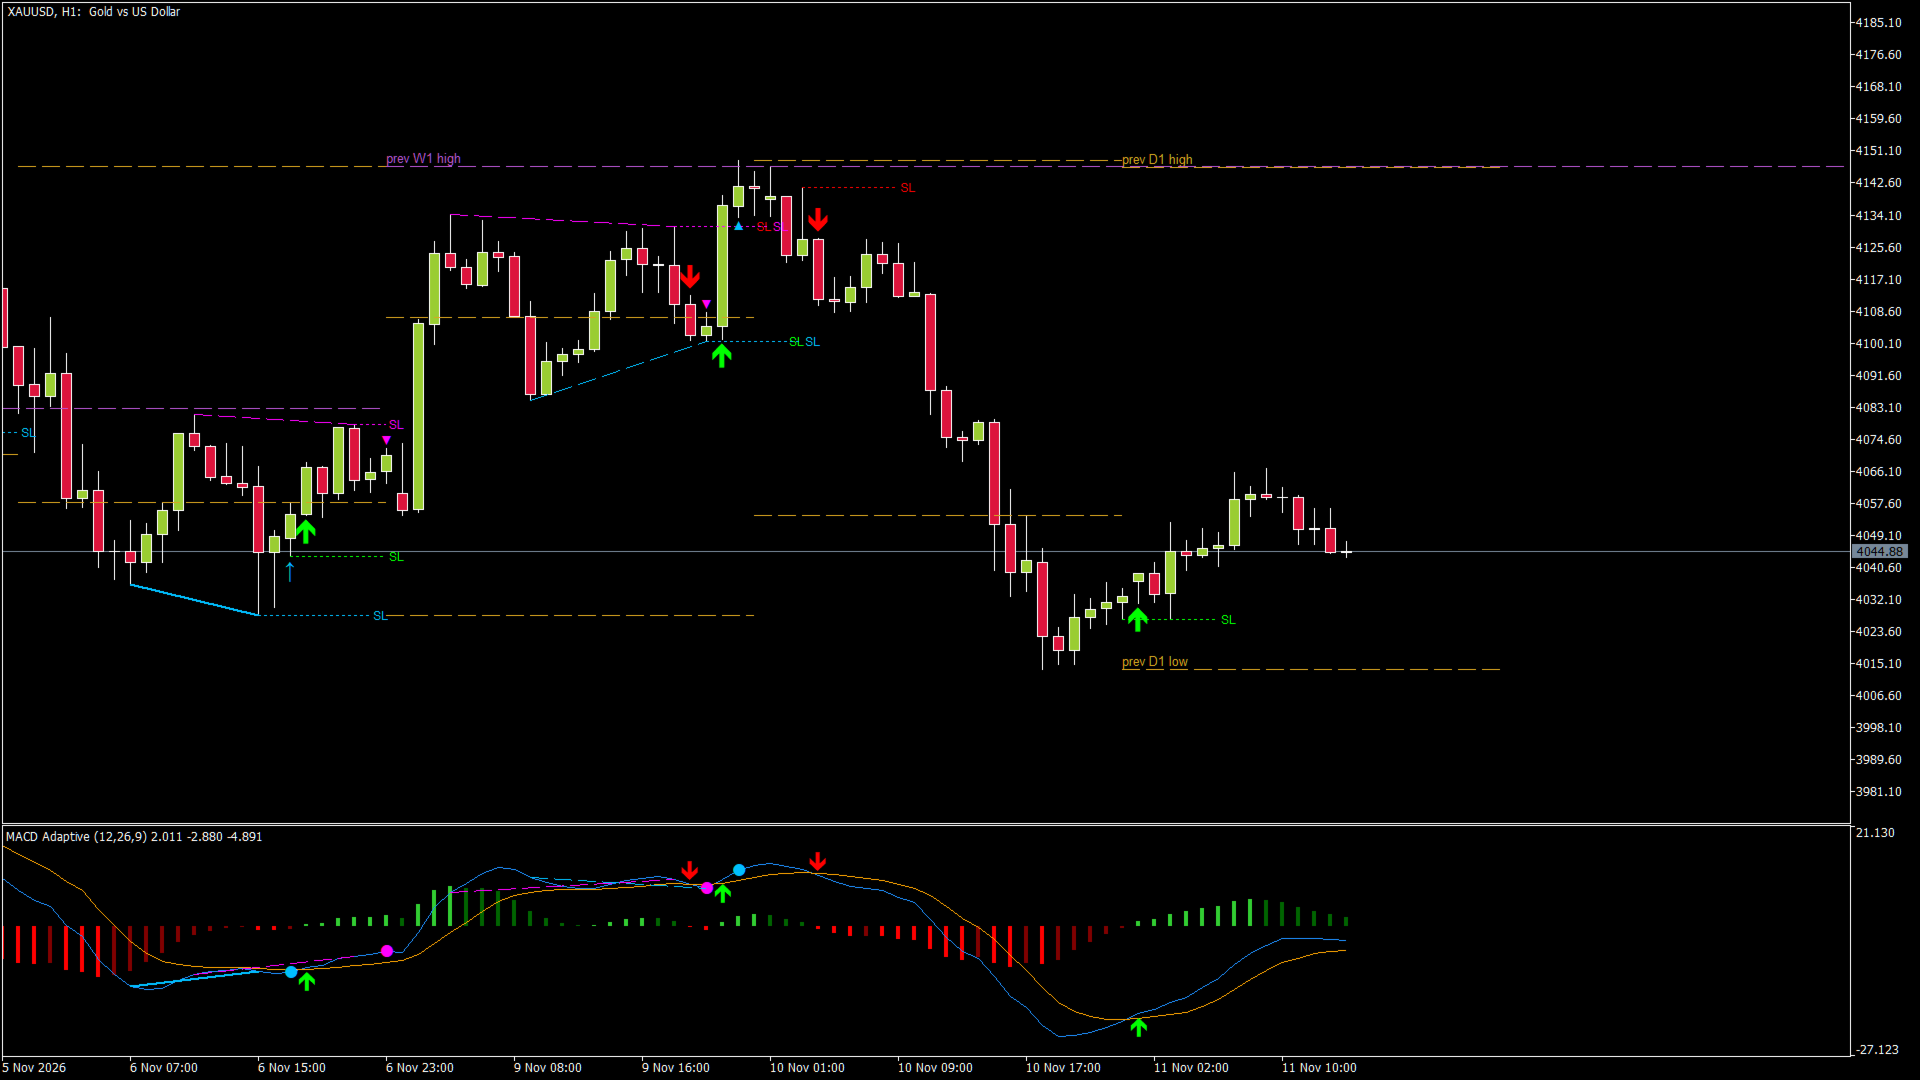
  • Buy / Sell arrows on a CLOSED bar (final, never disappear) and a hollow "possible" arrow on the open bar.
  • Regular and hidden divergences, confirmed only after the pivot is closed.
  • Optional short SL lines for the signals (3 modes: 2 bars, structure / swing, signal bar) and at the divergence pivot.
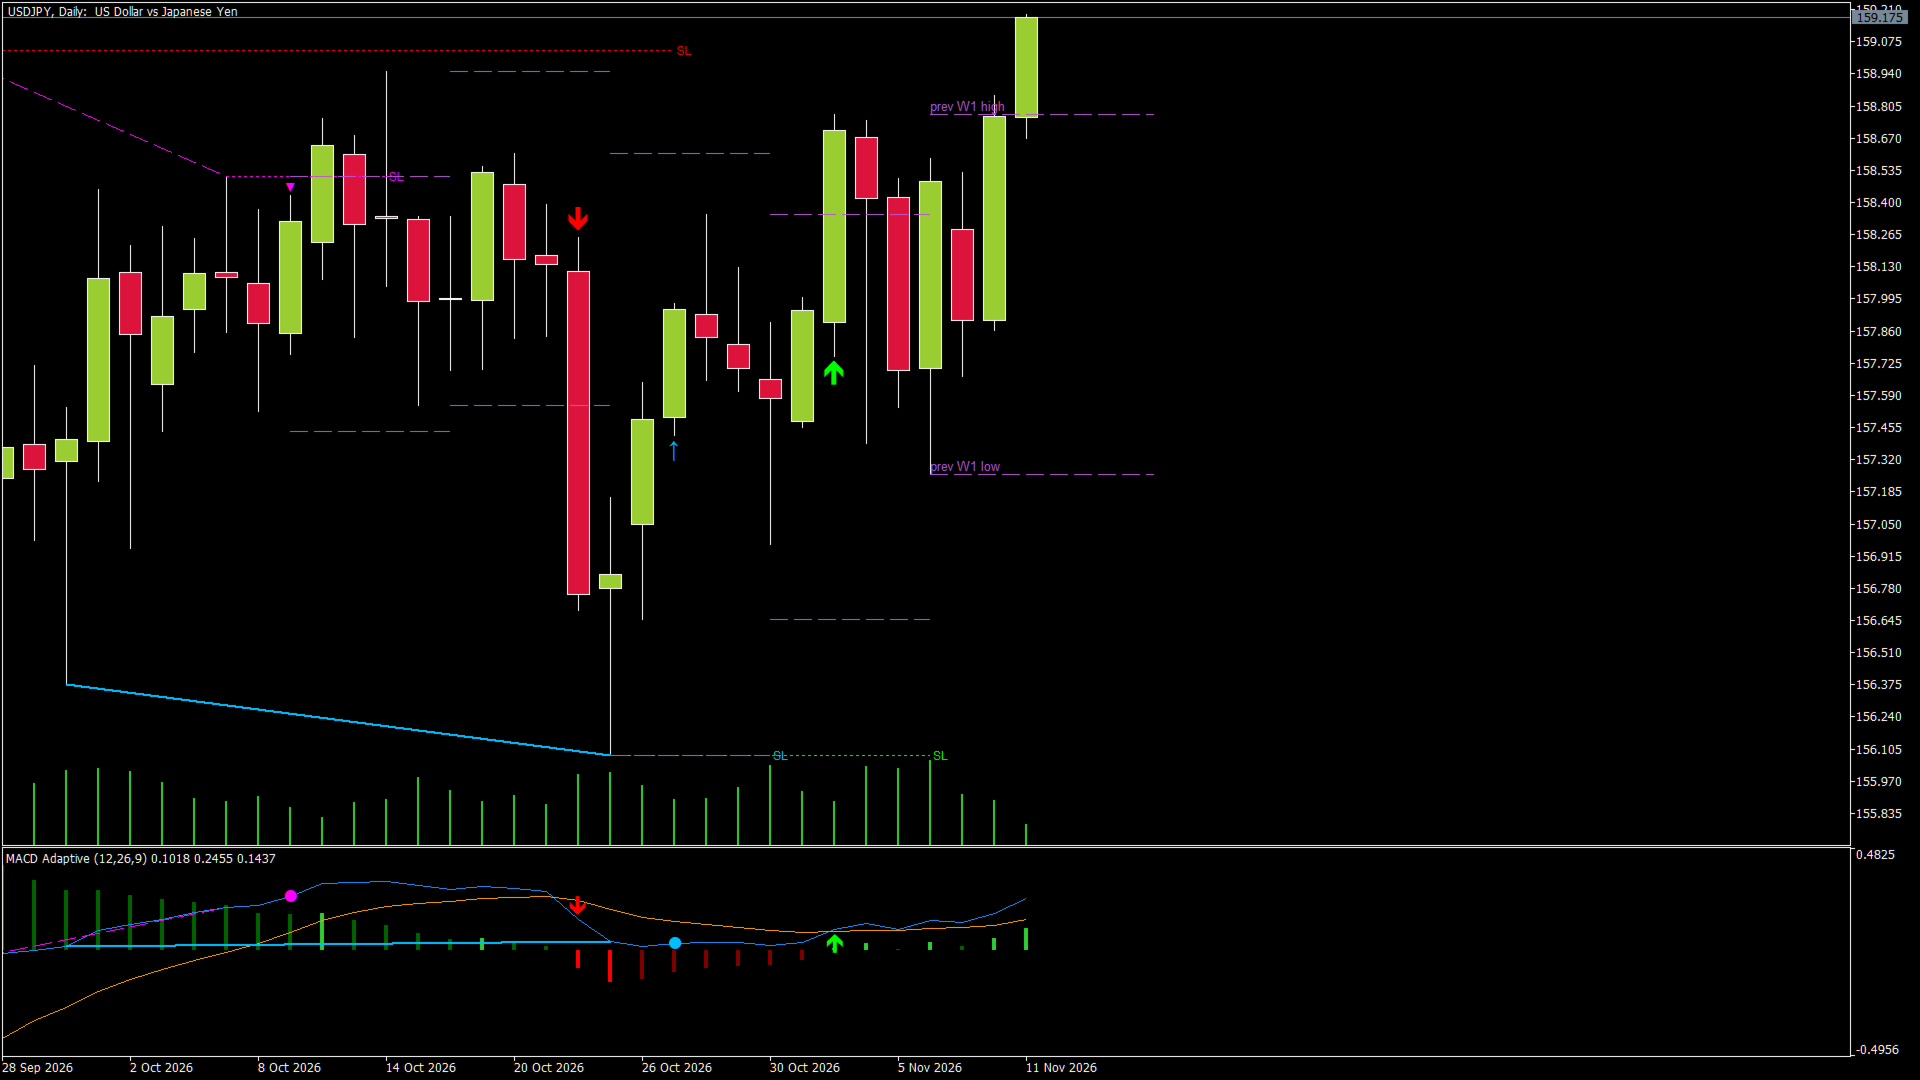
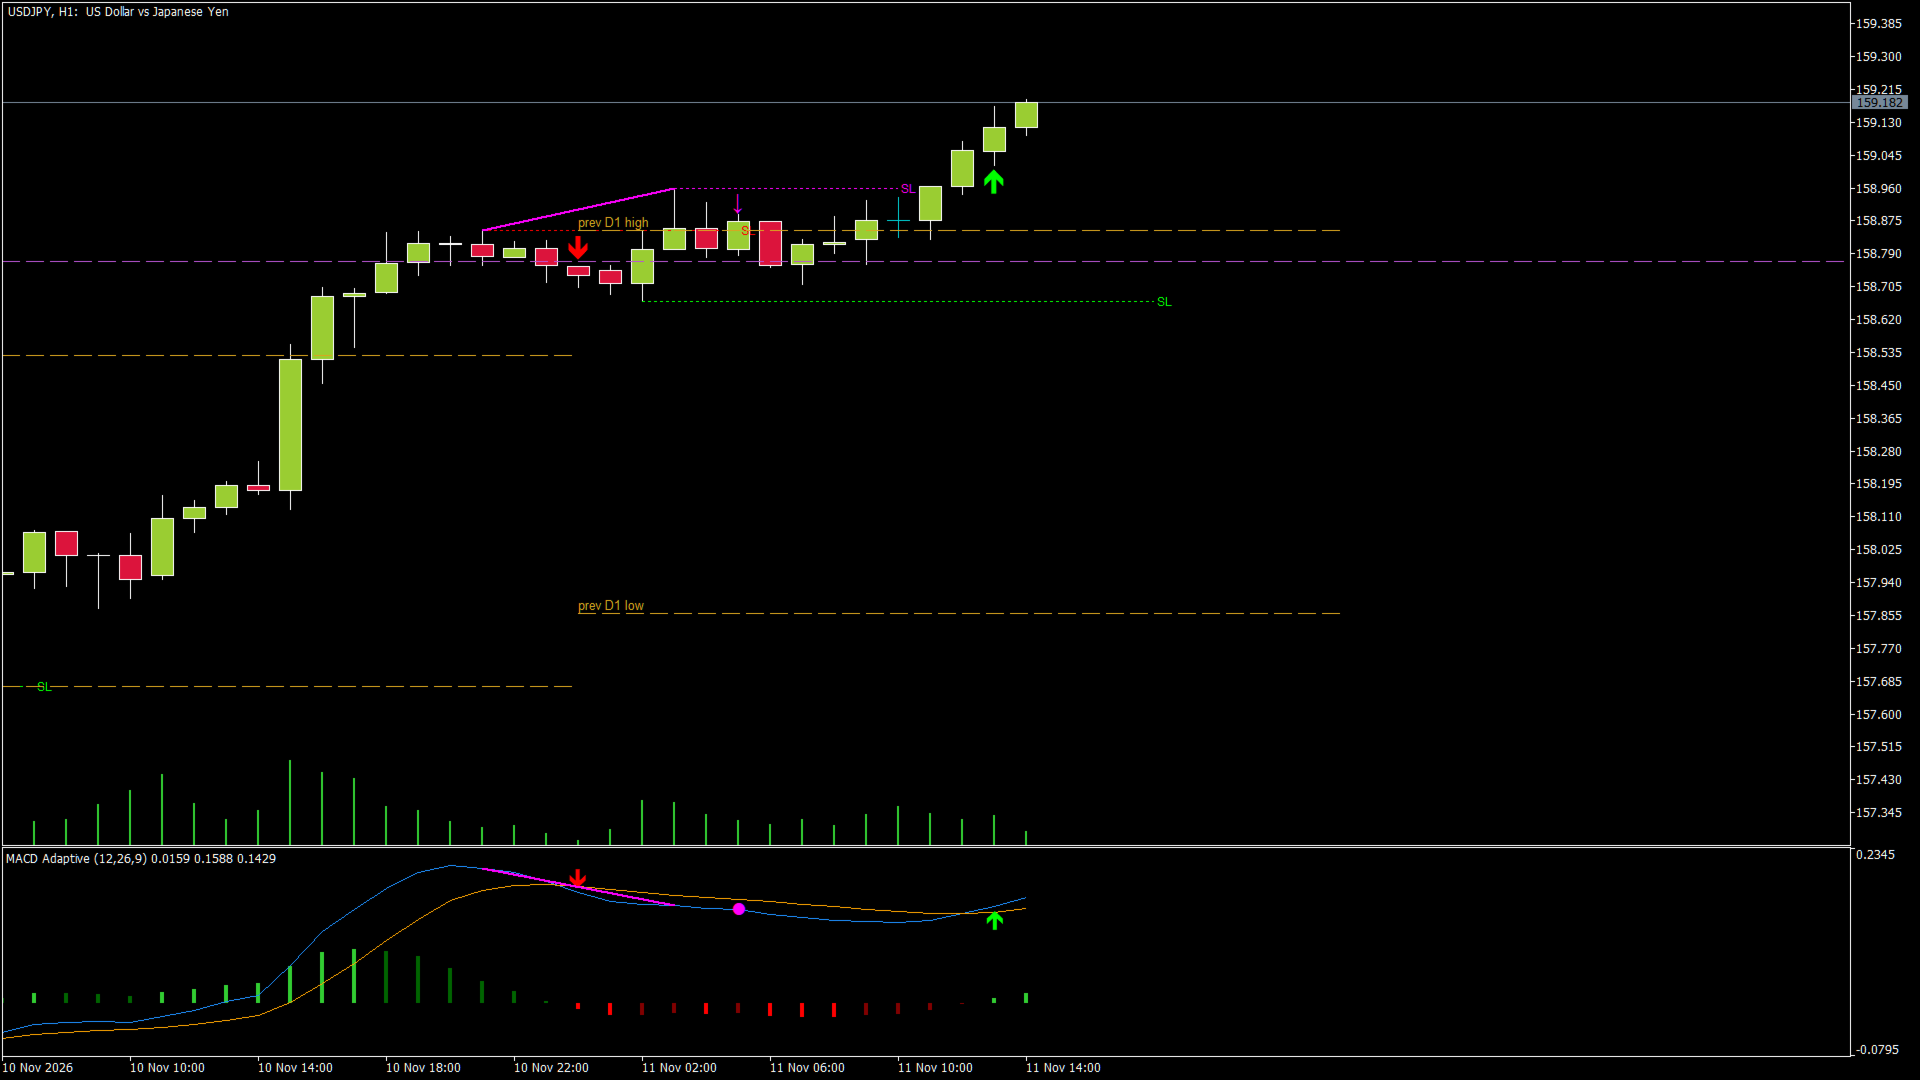
  • High / low of the previous candle of two higher timeframes (default D1 and W1) on the price chart.
  • Popup and push alerts for signals and divergences. No alerts for history.
  • Hover the mouse over any arrow, SL line, divergence or level: a tooltip explains what it is, the prices and the suggested SL.
  • Works on any symbol and any timeframe. Buffers can be read by an Expert Advisor.

USER GUIDE

1. QUICK START

1) Attach MACD Adaptive to a chart. The default settings work on any symbol.
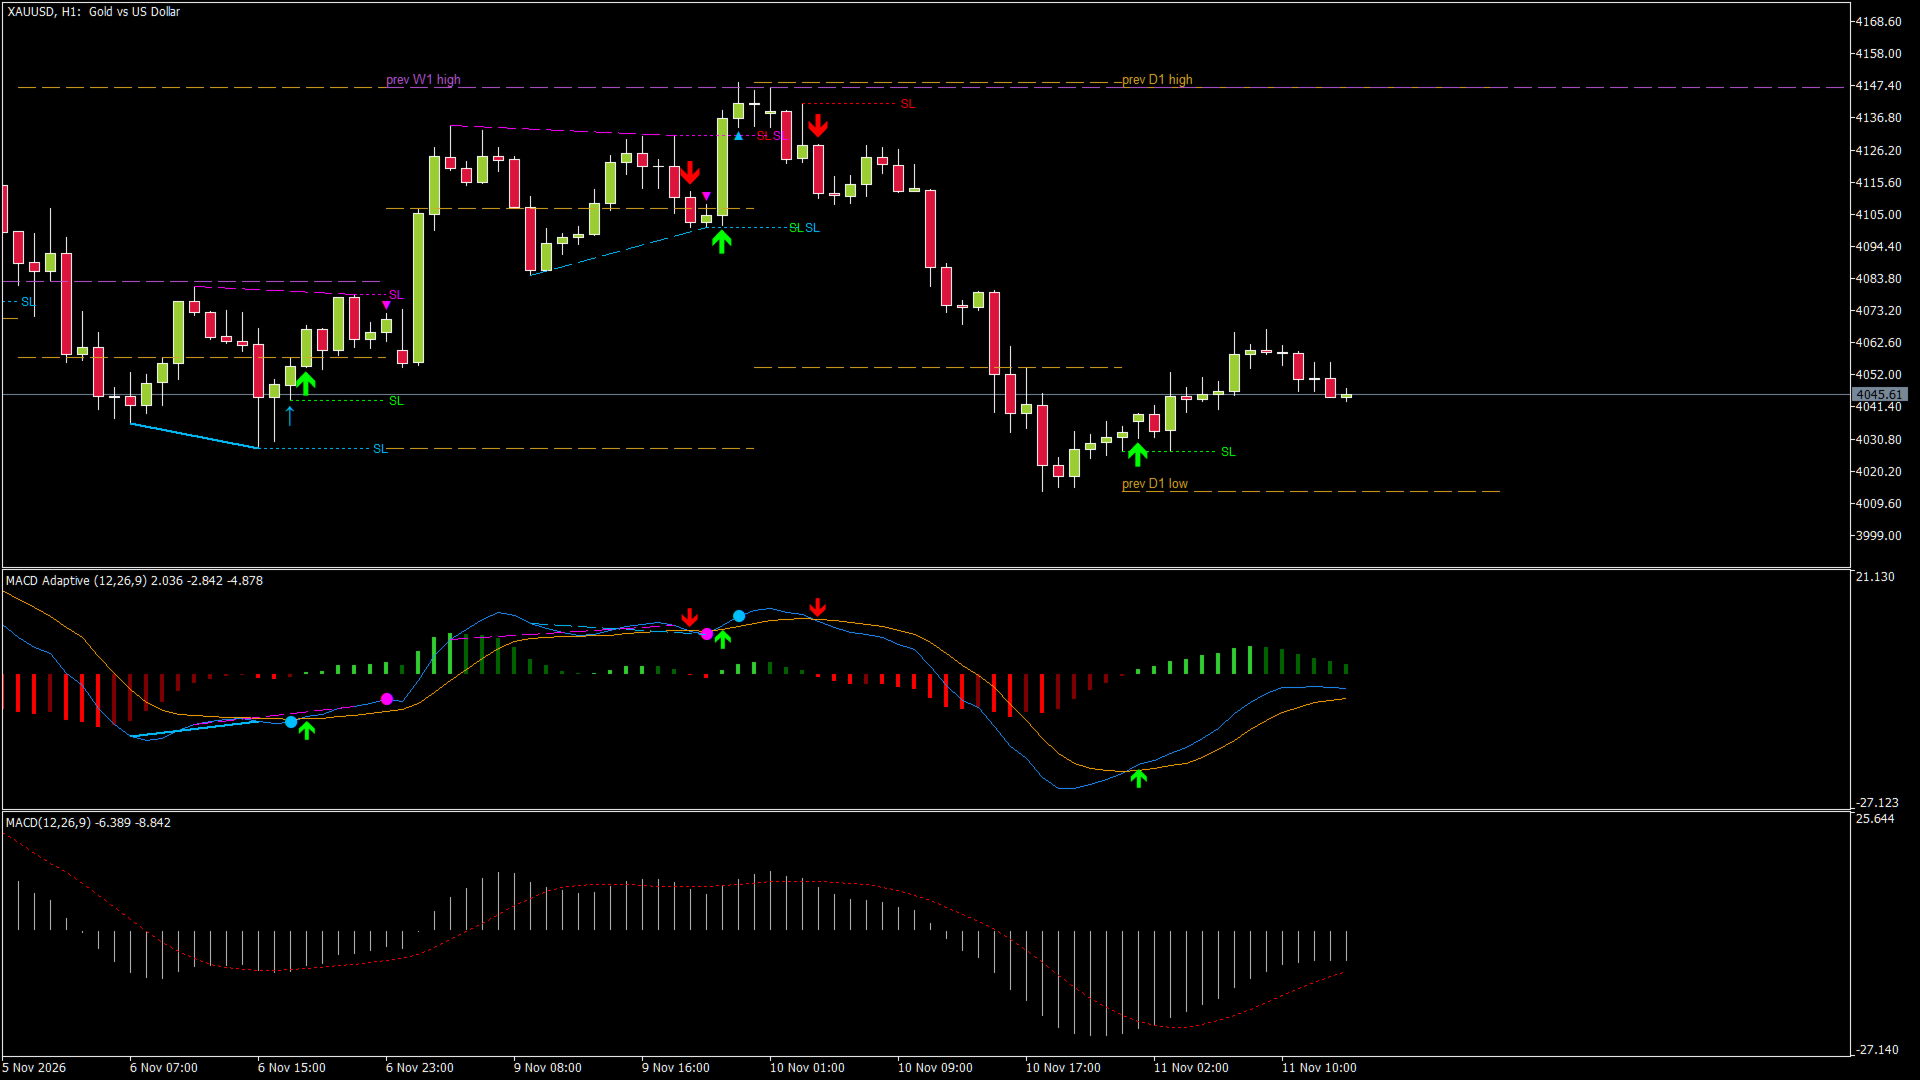
2) The MACD opens in its own window below the price chart. Arrows, divergence marks and higher timeframe levels are drawn on the price chart.
3) For push notifications on your phone: in MetaTrader 5 open Tools > Options > Notifications, enter your MetaQuotes ID (from the MetaTrader 5 mobile app, Settings > Messages) and enable push notifications.
4) Hover the mouse over any arrow, line or level to see a short explanation with the prices.
5) Everything that is drawn can be switched off in the inputs, so you can keep the chart as clean as you like.

2. READING THE MACD WINDOW

  • Blue line = MACD (fast EMA minus slow EMA).
  • Orange line = signal line (EMA of the MACD).
  • Histogram = MACD minus signal line, in four colors:
    bright green = above zero and growing (bullish momentum increasing),
    dark green = above zero and shrinking (bullish momentum fading),
    bright red = below zero and growing in size (bearish momentum increasing),
    dark red = below zero and shrinking (bearish momentum fading).
  • A change from bright to dark color is often the first sign that a move is losing strength, before the lines cross.
  • MACD above zero = the fast average is above the slow one (upward bias); below zero = downward bias.

3. ADAPTIVE PERIODS

The indicator measures how efficient the recent movement is over ERPeriod bars (efficiency ratio):
1 = price moved in a straight line, 0 = price went up and down and ended where it started.

  • When the market moves cleanly, the periods become shorter (down to 0.5x of the base with AdaptRange = 0.5), so the MACD reacts earlier.
  • When the market is choppy, the periods become longer (up to 1.5x of the base), so small swings do not produce crosses.
  • ERCenter is the efficiency value where the periods equal the base periods (12 / 26 / 9). 0.3 is a typical value for gold and most FX pairs.
  • Adaptive = false gives a classic MACD with the fixed base periods.

In practice: in a sideways market you get fewer crosses than with a normal MACD, and in a strong trend the crosses come earlier.

4. SIGNALS

  • Buy = the MACD line crosses above the signal line. Sell = it crosses below.
  • A full arrow is drawn only when the bar is CLOSED. It is final and does not repaint.
  • Hollow arrow ("possible signal"): while the bar is still open, the lines are crossing right now. It can disappear before the close if the lines separate again. It is only a heads-up to look at the chart, not a signal.
  • The alert for a confirmed signal comes when the bar closes. The alert for the possible signal is off by default (AlertPossible).
  • SL line (ShowSignalSL): a short dotted line that shows a reference stop. SignalSLMode sets where it is:
    Signal bar + previous bar (default): the lower low of the two bars for a buy, the higher high for a sell.
    Structure (swing): the lowest low (buy) / highest high (sell) since the previous opposite cross, i.e. the swing the signal comes from. Wider stop, behind the structure.
    Signal bar only: the low / high of the signal bar. The tightest stop.
    The line starts at the bar where the stop level is and runs a few bars to the right. Note: the arrow is drawn below the buy bar (above the sell bar) so it does not cover the candle, so it is always a little further away than the SL line. The arrow marks the bar, not a price.
    You can of course use your own stop.

5. DIVERGENCES

A pivot low is a bar with higher lows on both sides (PivotLeft bars on the left, PivotRight bars on the right). A pivot high is the mirror case. The indicator compares the last two pivots (between DivMinBars and DivMaxBars apart) in price and in the MACD.

  • Regular bullish divergence (possible reversal up): price makes a LOWER low, the MACD makes a HIGHER low. Selling pressure is weakening.
  • Regular bearish divergence (possible reversal down): price makes a HIGHER high, the MACD makes a LOWER high.
  • Hidden bullish divergence (possible continuation up): price makes a HIGHER low, the MACD makes a LOWER low. Typical for a pullback in an uptrend.
  • Hidden bearish divergence (possible continuation down): price makes a LOWER high, the MACD makes a HIGHER high.

On the chart:

  • Solid line = regular divergence, dashed line = hidden divergence, drawn on the price chart and in the MACD window.
  • Mark on the price chart: arrow = regular, small triangle = hidden.
  • Optional dotted SL line at the pivot low / high.

Why the divergence appears a few bars later: a pivot is only certain when PivotRight bars after it have closed. The mark is drawn on the bar that confirms it (default 2 bars after the pivot). This is the price of no repainting: the divergence never moves or disappears afterwards.
A smaller PivotRight = earlier but more divergences; a larger one = later but fewer and cleaner.

6. HIGHER TIMEFRAME LEVELS

  • The high and low of the previous candle of LevelsTF1 (default D1) and LevelsTF2 (default W1) are drawn as dashed lines across the current period. The most recent ones are labeled "prev D1 high", "prev D1 low" and so on.
  • Optional: open and close (LevelsOpenClose) and the middle 50% (LevelsMid) of that candle.
  • LevelsBack sets how many past periods are drawn.
  • Levels are drawn only for timeframes higher than the chart. On a D1 chart the D1 levels are not shown; set LevelsTF1 = Current to switch a level set off.
  • These levels are where many traders place orders: price often reacts there, stops are often placed behind them, and breakouts through them are watched.

7. A PRACTICAL WAY TO USE IT

The indicator shows where momentum changes. It does not tell you on its own which signal will work, so use it together with the trend and the levels:
1) Direction: check the trend on a higher timeframe (for example H4 or D1 for an H1 chart). Prefer signals in that direction.
2) Location: signals near a previous D1 / W1 high or low, or after a pullback to such a level, are more meaningful than signals in the middle of the range.
3) Trigger: a closed-bar arrow, or a hidden divergence in the direction of the trend (pullback ends), or a regular divergence at a strong level (possible reversal).
4) Stop: at the SL line (2 bars or structure) or behind the divergence pivot. If the stop is too large for your account, skip the trade or reduce the lot.
5) Exit: at the next level, at a fixed risk:reward, or when an opposite signal appears.
When to stay out:

  • Arrows alternate Buy / Sell / Buy within a few bars: the market is sideways. Wait.
  • The histogram is flat around zero: no momentum.
  • A signal right before high-impact news.

Always test your own way of using it in the Strategy Tester (visual mode) or on a demo account first.

8. SUGGESTED STARTING SETTINGS

These are starting points, not optimized values:

  • M1-M15 (intraday): defaults. If there are too many crosses, increase AdaptRange to 0.7 or the base periods (for example 16 / 34 / 9). Levels: D1 and W1.
  • H1-H4: defaults. Levels: D1 and W1.
  • D1: defaults. Levels: W1 and MN1.
  • Very volatile symbols: try ERCenter 0.25. Calm symbols: try 0.35.

9. ALERTS

  • AlertPopup: popup window with sound.
  • AlertPush: push notification to the MetaTrader 5 mobile app (MetaQuotes ID required, see Quick start).
  • AlertPossible: also alert the possible signal on the open bar (off by default, it can disappear).
  • AlertDivergence: alert confirmed divergences.

Signal alerts contain the symbol, the timeframe, the direction and the close price of the signal bar. Divergence alerts contain the symbol, the timeframe, the direction and the type (regular or hidden).

10. USING THE INDICATOR IN AN EXPERT ADVISOR

Call iCustom with the indicator name and read the buffers (index: content):
0: histogram, 1: histogram color index, 2: MACD, 3: signal line,
4: Buy (MACD value on a buy bar, EMPTY_VALUE otherwise), 5: Sell,
6: possible Buy (open bar only), 7: possible Sell,
8: bullish divergence (on the confirming bar), 9: bearish divergence.
Read closed bars (shift 1 and older) for final values.

11. FAQ

  • Does it repaint? No. Each bar uses only data up to that bar. Only the hollow arrow on the open bar can change, and it is marked as "possible".
  • Why did an arrow disappear? It was the hollow "possible" arrow; the lines separated again before the bar closed.
  • Why does the divergence appear later than the pivot? It needs PivotRight closed bars to confirm the pivot (see section 5).
  • Why don't I see the D1 levels? You are on a D1 or higher chart, or the D1 history is still loading. It appears after the next tick.
  • Is it different from the standard MACD? With Adaptive = false it is a classic EMA MACD (note: the signal line is an EMA, while the built-in MetaTrader 5 MACD uses an SMA for the signal line). With Adaptive = true the periods change bar by bar.

INPUT PARAMETERS

MACD

  • FastPeriod, SlowPeriod, SignalPeriod: base periods (12 / 26 / 9).
  • PriceType: price used (Close by default).

Adaptive

  • Adaptive: turn the adaptive periods on or off.
  • ERPeriod: bars used to measure trend vs noise (10).
  • AdaptRange: how much the periods can change. 0.5 = from 0.5x (clean trend) to 1.5x (pure noise) of the base periods.
  • ERCenter: trend/noise value where the periods equal the base periods (0.3).

Signals

  • ShowPossible: hollow arrow on the open bar.
  • ArrowsOnPrice: also draw the arrows on the price chart.
  • BuyColor, SellColor: arrow colors.
  • ShowSignalSL: dotted SL line for the signals.
  • SignalSLMode: Signal bar + previous bar / Structure (swing since the previous opposite cross) / Signal bar only.
  • HistoryBars: chart objects only for the last N bars (3000).

Divergences

  • ShowRegular, ShowHidden: which divergences to show.
  • PivotLeft, PivotRight: bars on each side of a pivot. PivotRight is also the confirmation delay.
  • DivMinBars, DivMaxBars: allowed distance between the two pivots.
  • DivArrows: marks on the price chart.
  • ShowDivSL: dotted SL line at the pivot.
  • BullDivColor, BearDivColor: colors.
  • SLLineBars: length of the SL lines in bars.

Higher timeframe levels

  • LevelsTF1, LevelsTF2: timeframes of the levels (Current = off).
  • LevelsBack: how many past periods to draw.
  • LevelsOpenClose, LevelsMid: also the open / close and the middle of the candle.
  • LevelsColor1, LevelsColor2: colors.

Alerts

  • AlertPopup, AlertPush, AlertPossible, AlertDivergence.

IMPORTANT

This is a tool for analysis and manual trading. It does not open trades. No indicator guarantees profit: the signals show where momentum changes, and the decision, the stop and the position size are yours. Test it in the Strategy Tester or on a demo account first.
Prodotti consigliati
=================================================================================== PRODUCT DESCRIPTION: KRYPTON TREND KINETIC PRO BY VERITASALGO =================================================================================== Krypton Trend Kinetic Pro (KTK) is a high-performance mathematical model and trend-following system designed exclusively for the MetaTrader 5 platform. Engineered specifically to meet the strict listing requirements of the MQL5 Market, this premium analytical tool offe
USA Indexes Quant Indicator
Thunder Investment Group Limited
Property of Vertical Capital Edition:  Gugol_Quants   About USA INDEXES QUANT_INDICATOR: This is a indicator created by math modulation to be used as a trading tool, which was developed in MQL. (MT5) This indicator is for use only with US500(S&P500), NAS100(Nasdaq Composite) and US30(Dow Jones). Signals are activated on "Open" Candle. It’s based on Intraday/Swing Trades whose main timeframe is H1, H2, H3 and H4. However you can use it with other assets by testing with the appropriate settings. *
FREE
DLMACD
Roman Sukhorukov
DLMACD - Divergence Local (Wave) MACD . The indicator displays divergences by changing the color of the MACD histogram. The indicator is easy to use and configure. It was created as an addition to the previously published DWMACD . For the calculation, a signal line or the values ​​of the standard MACD histogram can be used. You can change the calculation using the UsedLine parameter. It is advisable to use a signal line for calculation if the histogram often changes directions and has small val
FREE
Grafico Multi-Timeframe in Secondi (v3.0)  è un indicatore per MetaTrader 5 che visualizza l'andamento dei prezzi basato su timeframe personalizzati in secondi, minuti o ore direttamente sul grafico attivo. Ora include anche un pannello di controllo interattivo sul grafico per gestire contemporaneamente più grafici con timeframe personalizzati. Caratteristiche principali 1. Calcolo dei timeframe personalizzati Aggrega i dati di prezzo in timeframe personalizzati basati su secondi, minuti o ore
FREE
Astrolabe Geometry Pro – ML-Powered Price & Time Mapping is a highly advanced quantitative tool that adapts the ancient principles of the astrolabe into a modern, multidimensional price-time mapping system. Powered by a built-in k-Nearest Neighbors (k-NN) Machine Learning engine, it reads market geometry in real-time, predicts trend continuations, and spots high-probability reversals before they happen. Available in 13 languages ​​integrated into the indicator. As an introduction to how to reco
FREE
Ind2tompson
Vasilii Luchnikov
NewTest https://backoffice.aurum.foundation/u/DHXP1U The 2indtompson indicator is an indicator for comparing two instruments for determining volumes, for balancing in pair trading or arbitrage trading, prepared from an analog version for the MT4 terminal. So if you need to compare how much two instruments will weigh and you don't know how to do it, then put an indicator on the chart and it will automatically calculate the volumes needed for balancing. Additionally, the indicator shows the stat
FREE
iK Trendz Trading: The Ultimate Multi-Asset Trend Intelligence iK Trendz Trading is a professional-grade trend following indicator designed to provide traders with a crystal-clear view of market direction across multiple symbols and timeframes simultaneously. By combining advanced volatility-based logic with an intuitive Multi-Timeframe (MTF) dashboard, it eliminates the noise and identifies high-probability trading zones. Whether you are a scalper, day trader, or swing trader, this tool is desi
FREE
Crystal Quantum Flow
Muhammad Jawad Shabir
4.86 (7)
Crystal Quantum Flow Indicatore avanzato di intelligenza di mercato Crystal Quantum Flow è un indicatore di trading professionale di nuova generazione, progettato per trader che richiedono chiarezza, precisione e una visione del mercato di livello istituzionale. Questo indicatore è stato sviluppato come un sistema completo di supporto alle decisioni, combinando analisi multidimensionale del flusso di mercato, intelligenza sincronizzata multi-timeframe e interpretazione visiva avanzata in un uni
FREE
Trend Teller
Ian Nganga Comba
Trend Teller è uno strumento dashboard potente e intuitivo, progettato per offrirti una panoramica completa della tendenza del mercato su tutte le principali coppie di valute e su tutti i timeframe — da M1 a MN1. Creato da trader per trader, questo strumento elimina le congetture dall'analisi del trend e ti aiuta a rimanere allineato con la direzione generale del mercato. Molti trader principianti faticano a identificare la direzione del mercato — e, sorprendentemente, anche i trader esperti a v
FREE
Superwave MT5
Lasse Mathias Baagoe S Christensen
How to Read SUPERWAVE SUPERWAVE is designed to make the current trend state easy to understand at a glance. During bullish conditions: The adaptive trend line is displayed in blue The line follows underneath price The dashboard shows a bullish market bias A BUY signal is displayed when the detected trend changes into bullish conditions During bearish conditions: The adaptive trend line is displayed in red The line follows above price The dashboard shows a bearish market bias A SELL signal is dis
FREE
TDI MTF: Comprehensive Market Sentiment & Trend Framework The TDI MTF  is a multi-layered (captures Trend, Channels, Oscillates, levels, multi-timeframe) technical indicator designed to provide a clear view of market structure. By combining RSI momentum with volatility analysis, it helps traders identify where price is relative to its "mean" and whether current momentum is sustainable. This tool is good for traders who want an  all-in-one separate window to filter out market noise and focus on h
FREE
Quel segnale dell'RSI che i professionisti prendono davvero: non l'attraversamento di un livello, ma l'uscita dalla zona. RSI Dashboard MTF dà un acquisto quando l'RSI lascia l'ipervenduto verso l'alto e una vendita quando lascia l'ipercomprato verso il basso, assegna al segnale un grado a seconda che sia partito dal livello più profondo e disegna l'RSI, la sua media e la distanza tra i due. Qualsiasi timeframe superiore su qualsiasi grafico, solo candele superiori chiuse. È gratuito: nessun per
FREE
Ultimate EMA
Quang Huy Quach
Multi-Period EMA is a convenient indicator that displays multiple Exponential Moving Averages (EMAs) on a single chart. It is designed to help traders easily identify market trends and key crossover points without the need to add multiple individual EMA indicators. Key Features: Multiple EMAs in one: Simplifies chart analysis by combining several EMA lines into one indicator. Fully customizable: Easily change the period (default 20, 50, 100, 200), color, and thickness of each EMA line. Clean in
FREE
Kinetic Compression Ratio (KCR) – The Next-Generation Predictive Momentum Engine Welcome to a new era of market analysis. The Kinetic Compression Ratio (KCR) is a cutting-edge, institutional-grade momentum oscillator designed to measure the structural tension and kinetic energy of price movements. Rather than relying on basic price changes, KCR analyzes Kinetic Deviation (KD) —the raw distance between the current price and its core moving average. By running this detrended data through an advanc
FREE
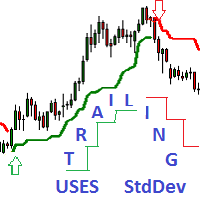
Trailing Uses Standard Deviation.   A daptive_Trailing_uses_StdDev_Indicator is an indicator of directional movement that allows you to identify a trend at the time of its inception and set the levels of a protective stop. Unlike trailing with a constant distance, the indicator uses the distance to the price proportional to the current standard deviation of StdDev. The distance is equal to the product of the standard deviation and the constant coefficient set by the user. Thus, the trailing
OVERVIEW Sierra Capital Multi-Timeframe EMA draws the moving averages of the timeframes you choose as horizontal levels on your chart. Each timeframe gets two lines in one color, a fast one (solid) and a slow one (dashed), 55 and 200 by default. On an M15 chart you can see at a glance where the H4, daily, weekly and monthly averages sit. It is a display tool. It gives no signals or alerts and does not open or manage trades. WHAT YOU SEE Two horizontal lines per timeframe, in the same color: fas
FREE
Anchored VWAP indicator
Ahmad Kazbar
4.82 (22)
Indicatore Anchored VWAP MT5 — Prezzo Medio Ponderato per Volume Istituzionale Sblocca l'analisi di mercato di livello istituzionale con l' Indicatore Anchored VWAP per MetaTrader 5 . Mentre gli indicatori VWAP standard forzano un rigido reset giornaliero, questo strumento professionale ti offre un'assoluta libertà: ancora il Prezzo Medio Ponderato per Volume a qualsiasi candela specifica, massimo/minimo, evento macroeconomico o cambio di sessione . Tracciando esattamente dove si concentra il pe
FREE
BTMM Session StopHunt Reversal Reentry Indicator (Demo) This is a fully functional demo version of the BTMM Session StopHunt Reversal Reentry Indicator for MetaTrader 5. The demo allows traders to experience the complete indicator logic in real market conditions before purchasing the full version. What the Demo Includes Full session visualization (Asian, Brinks, New York) Automatic Asian range (High / Low) and range size (R) Stop-hunt (liquidity sweep) reversal detection Entry, Sto
FREE
Vwap RSJ
JETINVEST
4.82 (11)
VWAP RSJ traccia le linee del VWAP orario, giornaliero, settimanale e mensile sullo stesso grafico. I grandi acquirenti istituzionali e i fondi usano il VWAP per entrare e uscire dalle posizioni con il minor impatto possibile sul mercato. Di solito cercano di comprare sotto il VWAP e vendere sopra, e questo tende a riportare il prezzo verso la media. Questo indicatore combina i quattro periodi di VWAP così puoi vedere dove si trova il prezzo rispetto a ciascuno di essi. Come leggerlo Ogni linea
FREE
This system is good at identifying short term reversals in the market. It is based on a machine learning study on market structure, and can be a great tool to scan the market or direct trades. With everything, there isn't a 100% win-rate, but this indicator is sometimes always accurate.   When it thinks a reversal will happen, it will color the candle a specific color, draw an arrow and then alert you on whether to buy or sell the upcoming candle.   Simple Setup Drag and drop onto any chart, at
Trend Fishing Indicator
Harish Balasubramani
4 (1)
The "Trend Fishing Indicator" is a powerful custom indicator designed to help traders identify potential trend reversal points and capitalize on market momentum. This indicator uses multiple moving averages of varying periods to evaluate short-term and long-term market trends. By comparing the short-term moving averages against the long-term ones, it generates clear buy and sell signals that can guide traders in making informed trading decisions. Key Features: Multiple Moving Averages : Incorpor
FREE
TrendStrengthDeviationSub TrendStrengthDeviationSub is a visual indicator package for MetaTrader 5. It summarizes recent price movement into a trend strength reading between -1 and +1, together with a confirmed trend state. The package contains two indicators that can be used together or on their own: a main-chart candle coloring indicator and a separate-window oscillator. It is an indicator only and does not open, manage or close orders. What is included The main-chart indicator colors each can
FREE
TrendStrengthDeviationMain TrendStrengthDeviationMain   is a visual indicator package for MetaTrader 5. It summarizes recent price movement into a trend strength reading between -1 and +1, together with a confirmed trend state. The package contains two indicators that can be used together or on their own: a main-chart candle coloring indicator and a separate-window oscillator. It is an indicator only and does not open, manage or close orders. What is included The main-chart indicator colors each
FREE
Daily VWAP plus Bands MT5
Cesar Sebastian Rosales Ibarra
VWAP - Prezzo Medio Ponderato per il Volume Smetti di indovinare il giusto prezzo del giorno. Guardalo. VWAP per periodo con bande di deviazione e proiezione forward — per i trader che hanno bisogno di livelli di riferimento istituzionali su ogni timeframe. Il VWAP è il singolo livello più osservato da istituzioni, prop desk e trader algoritmici. Non perché sia magia — perché è il prezzo che il mercato ha effettivamente pagato. Questo indicatore mette 5 modalità di periodo VWAP (Giornaliero /
MDL5 Martin Automated Trading EA 1. Overall Introduction The program running name is Martin Trading Configuration - RSI , which is currently the complete version. There is also a RSI minimalist version with the same logic: Martin Trading Configuration - RSI - Lite   The main logic is to automatically monitor RSI indicators. When the configuration threshold is reached, it will automatically trigger order opening, replenishment, stop profit, and stop loss operations. I have found that the market
The Momentum Waves Oscillator is an indicator designed for traders who want to declutter their charts. It does not generate "magic" signals; instead, it structures market data to provide an immediate, noise-free reading of momentum and volatility. This tool transforms price action into an organized visual grid, facilitating rapid and confident decision-making. Key Features: "Snap-to-Grid" Points: Prices are normalized on a scale of -100 to +100 with a step of 5. This eliminates chart "jitter" an
WHAT IS HTF CANDLES PRO? HTF Candles Pro is an advanced Multi-Timeframe indicator that constructs custom higher-timeframe candles directly from H1 bars, combining this visualization with a complete system of internal Fibonacci levels and projections. Unlike other HTF indicators that only display standard MetaTrader timeframes, this indicator allows you to create completely customized timeframes (24H, 48H, 72H, 96H, etc.) by aggregating 1-hour bars. KEY FEATURES 1. CUSTOM CANDLE CONSTRUCTION Cust
Smart Band Classic An adaptive multi-layer trading indicator combining dynamic price zones, intelligent BUY and SELL signals, and professional chart visualization in one streamlined MetaTrader 5 workspace. Smart Band Classic is a technical analysis indicator designed to help traders navigate market movements, recognize potential trading opportunities, and evaluate price behavior through a clean and coordinated visual environment. The indicator brings together an adaptive band system and a propr
FREE
Multi Timeframe Currency Strength Panel
Narayanan Mohanan Mohanan Krishnan
MTF Currency Strength Panel for MetaTrader 5 Indicatore di forza delle valute multi-timeframe: tutte le 28 coppie principali su un solo grafico. Questo pannello di forza delle valute mostra dove si trovano ora le otto valute principali e come si è mossa ciascuna delle 28 coppie principali su nove timeframe contemporaneamente, da M1 a MN1. Entrambe le letture stanno su un solo grafico e si aggiornano tramite un timer. Classificare le coppie da sole è fuorviante. Quando una singola valuta si muove
FREE
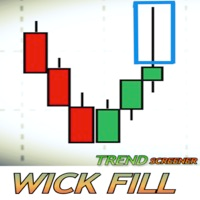
Che cos'è uno stoppino nel trading? Come funziona questo Screener? Un wick in una candela riflette un rifiuto del prezzo. Questo Screener cerca di identificare gli stoppini con un grande potenziale per essere riempiti. Questo Screener si concentra sugli stoppini che si verificano nel mercato di tendenza.  Lo Screener visualizza un cruscotto che offre una visione complessiva dei potenziali wick scambiati in diretta. Mostra TUTTE le coppie/strumenti organizzati per timeframe. Le opportunità di a
Gli utenti di questo prodotto hanno anche acquistato
Trend Sniper X
Sarvarbek Abduvoxobov
4.87 (46)
Trend Sniper X è un indicatore trend-following multi-timeframe per MetaTrader 5 che aiuta i trader a identificare la direzione del trend e i potenziali punti di inversione con chiarezza e precisione. per MT4: https://www.mql5.com/en/market/product/193245 Informazioni sul prezzo: Il prezzo attuale è promozionale ed è soggetto a modifiche con il rilascio di futuri aggiornamenti e nuove funzionalità. Offerta Bonus: Per ricevere GRATIS l'Auto-Trade Assistant EA per questo indicatore, invia un messa
Un nuovo Re in città - Indicatore + Gestione ordini (TP1 + TP2 + TP3) + Invio opzionale di segnali Telegram INCLUSO (GRATIS) (SISTEMA COMPLETO DI TRADING e SEGNALI) Il nostro miglior EA per l’Oro: Gold Slayer Questo indicatore include una strategia avanzata, un sistema di trading con gestione ordini personalizzabile e un sistema mean reversion che combina estensioni di envelope, supportato da molteplici filtri intelligenti di conferma come RSI per individuare ingressi di inversione ad alta proba
Smart Trend Trading System — MetaTrader 5 Dopo l'acquisto, inviami un messaggio su MQL5 per ricevere GRATUITAMENTE Smart Universal Expert Advisor, insieme al corso online, al manuale PDF e all'accesso al gruppo privato. STTS riunisce la direzione del trend, i segnali di entrata e uscita, le zone di inversione e i livelli di prezzo importanti direttamente sul grafico. Segui il sistema manualmente oppure collega un EA compatibile separato per eseguire le operazioni automaticamente con le impostazi
Entry Points Pro vi mostra dove entrare, dove mettere lo stop e con quale lotto operare — prima di piazzare l'ordine. PREZZO Ora 199 USD: 4 copie a questo prezzo, poi 249 USD. Il prezzo finale è di 349 USD. Guadagno facendo trading sui mercati e lo dimostro, quindi non ho bisogno di vendere questo indicatore a tutti. È uno strumento per trader che ragionano con la propria testa, non un pulsante magico. Nessuna rottura, nessun trade. Una freccia grigia è un segnale annullato: il prezzo non ha ro
M5 Sniper
MeanFX
5 (4)
Porta il tuo vantaggio nel trading sotto i riflettori! M5 Sniper è un nuovo indicatore di MeanFX. Combina segnali di trading precisi con livelli TP/SL adattivi , creando così le migliori operazioni statistiche possibili! Il prezzo aumenta ogni 5 acquisti, il prossimo prezzo è di 69$ Scrivimi dopo l'acquisto per ricevere consigli/guida e un EA bonus Cosa lo rende diverso? Performance statistica comprovata su Gold XAUUSD ( funziona su quasi ogni asset , concentrandosi sulla padronanza di un singol
Gann Made Easy è un sistema di trading Forex professionale e facile da usare che si basa sui migliori principi del trading utilizzando la teoria di mr. WD Gann. L'indicatore fornisce segnali ACQUISTA e VENDI accurati, inclusi i livelli di Stop Loss e Take Profit. Puoi fare trading anche in movimento utilizzando le notifiche PUSH. CONTATTAMI DOPO L'ACQUISTO PER RICEVERE GRATUITAMENTE LE ISTRUZIONI DI TRADING E OTTIMI INDICATORI EXTRA! Probabilmente hai già sentito parlare molte volte dei metodi d
Ultra Indicator
Ihor Otkydach
5 (1)
ULTRA è un indicatore tecnico che funziona secondo un approccio “tutto in uno”: analizza autonomamente il mercato, genera segnali di trading, visualizza i livelli per l’impostazione degli ordini stop-loss e suggerisce quando chiudere le operazioni per realizzare profitti o ridurre al minimo le perdite. In altre parole, non importa se non sai come analizzare il mercato, determinare i livelli — dove impostare lo stop-loss — o se hai difficoltà con la gestione del capitale. ULTRA farà tutto questo
Zoryk Gold
Reda El Koutbane
4.65 (20)
ZORYK — Sistema avanzato di segnali XAUUSD per MetaTrader 5 Conosci sicuramente questa sensazione. Passi molto tempo ad analizzare l’oro. Aspetti il punto d’ingresso corretto. Finalmente apri l’operazione e il prezzo inizia immediatamente a muoversi contro di te. Chiudi troppo presto, sposti lo Stop Loss o esiti per alcuni secondi. Successivamente il mercato raggiunge esattamente l’obiettivo che avevi previsto inizialmente, ma senza di te nella posizione. Il problema non era sempre la direzione.
SuperScalp Pro
Van Minh Nguyen
4.54 (37)
SuperScalp Pro - Professional Multi-Layer Confluence Scalping System SuperScalp Pro è un indicatore di scalping avanzato che potenzia il Supertrend classico con diversi filtri intelligenti di conferma. Aiuta a individuare opportunità di trading Buy/Sell con una maggiore probabilità di successo, riducendo significativamente i falsi segnali. Le frecce Buy e Sell vengono visualizzate chiaramente direttamente sul grafico, insieme ai livelli di Stop Loss e Take Profit basati sull’ATR, calcolati autom
SMC Intraday Formula
VividMind Digital Solutions
5 (26)
Cominciamo con la verità. Nessun indicatore da solo ti renderà profittevole. Se qualcuno ti dice il contrario, ti sta vendendo un sogno. Qualsiasi indicatore che mostra frecce perfette di acquisto/vendita può essere reso impeccabile — basta ingrandire la giusta sezione della storia e catturare solo i trade vincenti. Noi non lo facciamo.  SMC Intraday Formula è uno strumento. Legge la struttura del mercato per te, identifica le zone a più alta probabilità e ti mostra esattamente come appare la t
GoldenX Entry MT5
VividMind Digital Solutions
5 (17)
GoldenX Entry è un indicatore per MT5 con un algoritmo adattivo Smart Entry Trend, un sistema di scoring dei segnali, un rilevatore del regime di mercato e un filtro di volatilità. Ogni segnale include un livello di ingresso calcolato, tre livelli di Take-Profit (TP1, TP2, TP3) e un livello di Stop-Loss. È costruito su più livelli analitici progettati per adattarsi a diverse condizioni di mercato, combinando un sistema analitico multilivello con un ottimizzatore integrato e un sistema di traccia
Gold Trend Coach MT5
Cristhian Alexander Gaibor Cuasquer
4.27 (11)
Segnali di acquisto e vendita senza repaint sull'oro (XAUUSD) per MetaTrader 5. Ogni segnale arriva con stop loss e tre take profit. Un filtro Smart Money Concepts con BOS e CHoCH, così operi a favore della struttura, non contro. Un Mentor live sul pannello che ti guida passo dopo passo dall'ingresso fino al TP3. E alert direttamente sul tuo telefono e sul tuo canale Telegram. Questo è Gold Trend Coach. Mai più da solo davanti al grafico. KIT ACQUIRENTE GRATIS con il tuo acquisto: 1. Telegram A
Azimuth Pro
Ottaviano De Cicco
5 (7)
Azimuth Pro V2: Synthetic Fractal Structure and Confirmed Entries for MT5 Overview Azimuth Pro is a multi-level swing structure indicator by Merkava Labs . Four nested swing layers, swing-anchored VWAP, ABC pattern detection, three-timeframe structural filtering, and closed-bar confirmed entries — one chart, one workflow from micro-swings to macro-cycles. This is not a blind signal product. It is a structure-first workflow for traders who care about location, context, and timing. 1. What Change
FX Power MT5 NG
Daniel Stein
5 (33)
FX Power: Analizza la Forza delle Valute per Decisioni di Trading Più Intelligenti Panoramica FX Power è lo strumento essenziale per comprendere la reale forza delle principali valute e dell'oro in qualsiasi condizione di mercato. Identificando le valute forti da comprare e quelle deboli da vendere, FX Power semplifica le decisioni di trading e rivela opportunità ad alta probabilità. Che tu segua le tendenze o anticipi inversioni utilizzando valori estremi di Delta, questo strumento si adatta
FiboSniper Pro
Van Minh Nguyen
5 (4)
FiboSniper Pro – Multi-Filter Fibonacci System with Auto SL/TP and Control Panel FiboSniper Pro è un indicatore tecnico che combina Fibonacci Envelopes dinamici con diversi filtri di conferma per generare segnali Buy e Sell selezionati. I livelli di Fibonacci vengono calcolati sulla base di Moving Average e ATR e successivamente filtrati tramite ADX, EMA, RSI, ATR, Volume, Time e struttura delle candele. L’indicatore visualizza direttamente sul grafico i livelli automatici di Stop Loss e Take Pr
Power Candles MT5
Daniel Stein
4.58 (12)
Power Candles V3 - Indicatore di forza ad ottimizzazione automatica Power Candles V3 trasforma la forza delle valute e degli strumenti in un piano di trading attuabile su ogni grafico a cui è collegato. Invece di limitarsi a colorare le candele, esegue un'auto-ottimizzazione in tempo reale in background e ti fornisce i migliori valori di Stop Loss, Take Profit e soglia di segnale per il simbolo che hai davanti. Basta un clic per adottarlo nel trading live: i raggi di ingresso, Stop Loss e Take P
M1 Sniper MT5
Oleg Rodin
5 (7)
M1 SNIPER   è un sistema di indicatori di trading facile da usare. Si tratta di un indicatore a freccia progettato per l'intervallo temporale M1. L'indicatore può essere utilizzato come sistema autonomo per lo scalping sull'intervallo temporale M1 e come parte del tuo sistema di trading esistente. Sebbene questo sistema di trading sia stato progettato specificamente per il trading sull'intervallo temporale M1, può comunque essere utilizzato anche con altri intervalli temporali. Inizialmente ho p
Gold Entry Sniper
Tahir Mehmood
5 (23)
Gold Entry Sniper – Dashboard ATR Multi-Timeframe per Scalping e Swing Trading sull’Oro Gold Entry Sniper è un indicatore avanzato per MetaTrader 5 che offre segnali di acquisto/vendita precisi per XAUUSD e altri strumenti, basato sulla logica ATR Trailing Stop e l' analisi multi-timeframe . Caratteristiche e Vantaggi Analisi Multi-Timeframe – Visualizza trend su M1, M5, M15 in un'unica dashboard. Trailing Stop Basato su ATR – Stop dinamici che si adattano alla volatilità. Dashboard Professional
Atomic Analyst MT5
Issam Kassas
4.51 (65)
Atomic Analyst — MetaTrader 5 Dopo l'acquisto, inviami un messaggio su MQL5 per ricevere GRATUITAMENTE Smart Universal Expert Advisor, insieme al corso online, al manuale PDF e all'accesso al gruppo privato. Atomic Analyst riunisce l’azione del prezzo, la direzione del trend, i segnali di entrata e uscita, lo Stop Loss e diversi livelli di Take Profit direttamente sul grafico. INDIVIDUA IL SEGNALE. COMPRENDI IL CONTESTO OPERATIVO. Atomic Analyst organizza la sua analisi in informazioni visive ch
SQN Max indicator for MT5 by ITC
Renaud Herve Francois Candel
Sqn Max Indicator Sqn Max is an exclusive indicator to trade the market with high effectiveness. The indicator is based on price action, volatility and trend. This indicator is as simple as possible but not too simple. The indicator can generate alerts to ease the trading process. You don't have to stay all day in front of your screen. The indicator can be used with any class of assets and with any time frame. It is possible to achieve better results trading our list of selected assets. We achi
Auto Optimized SpeedAngle è un sistema di vettorizzazione del momento di livello istituzionale che elimina l'overfitting ( curve-fitting ) attraverso l'ottimizzazione continua Walk-Forward (WFO). Invece di affidarsi a input statici che si degradano quando i regimi di mercato cambiano, l'indicatore recalibra dinamicamente i suoi parametri utilizzando la validazione Out-of-Sample (OOS), assicurando che i segnali visualizzati rappresentino reali vantaggi statistici anziché anomalie storiche. Quadro
Apex Patterns PRO Acquista l'indicatore - Ottieni GRATUITAMENTE l'Expert Advisor basato su di esso. Intelligenza auto-ottimizzante per pattern grafici e breakout Gli scanner di pattern tradizionali si basano su input fissi, registrando spesso prestazioni inferiori quando la volatilità e le strutture del mercato cambiano. Apex Patterns PRO è progettato per adattarsi alle mutevoli condizioni di mercato combinando il riconoscimento dei pattern grafici strutturali, il filtraggio del momentum e l'au
Divergence Bomber
Ihor Otkydach
4.89 (94)
Ogni acquirente dell’indicatore riceverà inoltre gratuitamente: L’utilità esclusiva “Bomber Utility”, che gestisce automaticamente ogni operazione, imposta i livelli di Stop Loss e Take Profit e chiude le posizioni secondo le regole della strategia I file di configurazione (set file) per adattare l’indicatore a diversi asset I set file per configurare il Bomber Utility in tre modalità: “Rischio Minimo”, “Rischio Bilanciato” e “Strategia di Attesa” Una guida video passo-passo per installare, con
Prossimo aggiornamento — Versione 2.52 in arrivo! [NOVITÀ] Preparati a 4 nuove funzionalità principali progettate per migliorare la tua analisi di mercato e il tuo flusso di lavoro nel trading Portiamo l’analisi di mercato a un livello superiore con 4 nuove funzionalità progettate per soddisfare le tue esigenze di trading. Ecco le novità: 1. TRADE OVERVIEW DASHBOARD 2. CONFLUENCE AT ZONE 3. STRONG & WEAK HIGH/LOW 4. OTE 1. TRADE OVERVIEW DASHBOARD Una dashboard che ti aiuta a comprendere più fa
Adaptive Price Action Engine Acquista un indicatore, ricevi l'EA gratis Analisi Auto-Ottimizzata del Trend e dei Pattern Candlestick Multi-Timeframe I mercati cambiano continuamente e non tutti i pattern di Price Action hanno lo stesso valore in ogni condizione di mercato. Adaptive Price Action Engine è progettato per adattarsi alle condizioni di mercato in continua evoluzione, combinando struttura del trend, analisi Multi-Timeframe, pattern Candlestick e ottimizzazione statistica in un unico fr
Currency Strength Wizard   è un indicatore molto potente che ti fornisce una soluzione all-in-one per un trading di successo. L'indicatore calcola la potenza di questa o quella coppia forex utilizzando i dati di tutte le valute su più intervalli di tempo. Questi dati sono rappresentati in una forma di indice di valuta facile da usare e linee elettriche di valuta che puoi utilizzare per vedere il potere di questa o quella valuta. Tutto ciò di cui hai bisogno è collegare l'indicatore al grafico ch
Naked Forex Tweezer Pro Indicator Tweezer Pro Indicator is a pattern recognition indicator for Forex, Stocks, Indices, Futures, Commodities and Cryptos. The standard Tweezer is a two bar pattern. Our enhanced version is a multi-bar pattern. We filter the patterns for you so that you only get the     best and most effective patterns   and ignore the noise. The Tweezer pattern is a simple and effective pattern to trade. The strategy that comes with the Tweezer is based on price action. The Twe
Unix Scalper
Issam Kassas
4 (4)
Unix Scalper — MetaTrader 5 Dopo l'acquisto, inviami un messaggio su MQL5 per ricevere GRATUITAMENTE Smart Universal Expert Advisor, insieme al corso online, al manuale PDF e all'accesso al gruppo privato. Individua il setup. Esamina il piano. Scegli come operare. UNIX Scalper riunisce analisi di mercato, indicazioni BUY/SELL/WAIT e livelli Entry, Stop Loss, TP1 e TP2 in un unico pannello organizzato. VISUALIZZA IL SEGNALE E IL PIANO • Indicazioni chiare: BUY, SELL o WAIT. • Livelli definiti: E
Fx Levels Premium Indicator Support and Resistance are important concepts in trading. Fx Levels Premium was created to easily draw important levels of support and resistance for the active trader. The indicator will give you all important levels (support/resistance) to watch for a wide range of assets. Trading without these levels on your chart is like driving a car for a long journey without a roadmap. You would be confused and blind. Support and resistance levels should be used as guideline
Smc Pro ToolKit
Talal N Z Aljarusha
5 (13)
SMC PRO TOOLKIT — SMART MONEY ANALYSIS & STRUCTURED TRADE PLANNING SMC Pro ToolKit is a professional Smart Money Concepts analysis workspace for MetaTrader 5. It combines market structure, multi-timeframe analysis, institutional price zones, setup evaluation, confirmation tools, volume context, alerts, and risk planning inside one organized chart environment. One workspace. Multiple layers of confirmation. One structured trading plan. OPEN COMPLETE USER GUIDE MULTI-CONDITION SETUP ENGINE At
Altri dall’autore
A free chart-pattern indicator for MetaTrader 5 that tells you the truth about each pattern: how often it really reached 1R and 2R on your symbol and timeframe, next to what a random entry with the same stop did. Most pattern indicators only draw arrows. This one measures them. Every signal shows its historical win % and the "random %" for the same direction and stop size, so you can see at once whether a pattern has an edge on the chart you trade - or not. The indicator does not open or close t
FREE
A free long / short position tool for MetaTrader 5: click where the entry should be, drag the stop loss and the take profit, and see the risk and the reward in money, the R:R and the lot for your risk % of the balance. No more counting points and pip values before every trade: the tool shows the lot that keeps your risk at the % you choose, with the commission included. The indicator does not open or close trades. It is a planning tool, the decision is yours. MAIN FEATURES Click to place: press
FREE
Smart Order Blocks puts the main Smart Money Concepts on one clean chart: order blocks, fair value gaps (FVG), range order blocks, market structure (BOS / CHoCH) and liquidity (BSL / SSL, equal highs / lows, liquidity taken). It gives a signal when price touches a zone and rejects it, and shows how often that type of signal worked in the past ON YOUR CHART. Nothing is drawn before it happened and nothing repaints: a zone appears only after the candle that confirms it has closed, and a signal onl
Plan, test and track your trades directly on the MT5 chart: a long / short position tool with partial take profits, a moving stop loss, a trading journal, statistics and alerts. Click LONG or SHORT, click on the chart where the entry should be, drag the SL and TP - and you see the risk and the reward in money, the R:R and the lot for your risk %. Press SAVE and the tool stays on the chart: it is tracked candle by candle on the history and live, and every saved trade goes into the statistics and
Filtro:
Nessuna recensione
Rispondi alla recensione