AI Trend Breakout Radar

AI趋势突破雷达 - 智能跟随机构资金流向

指标简介
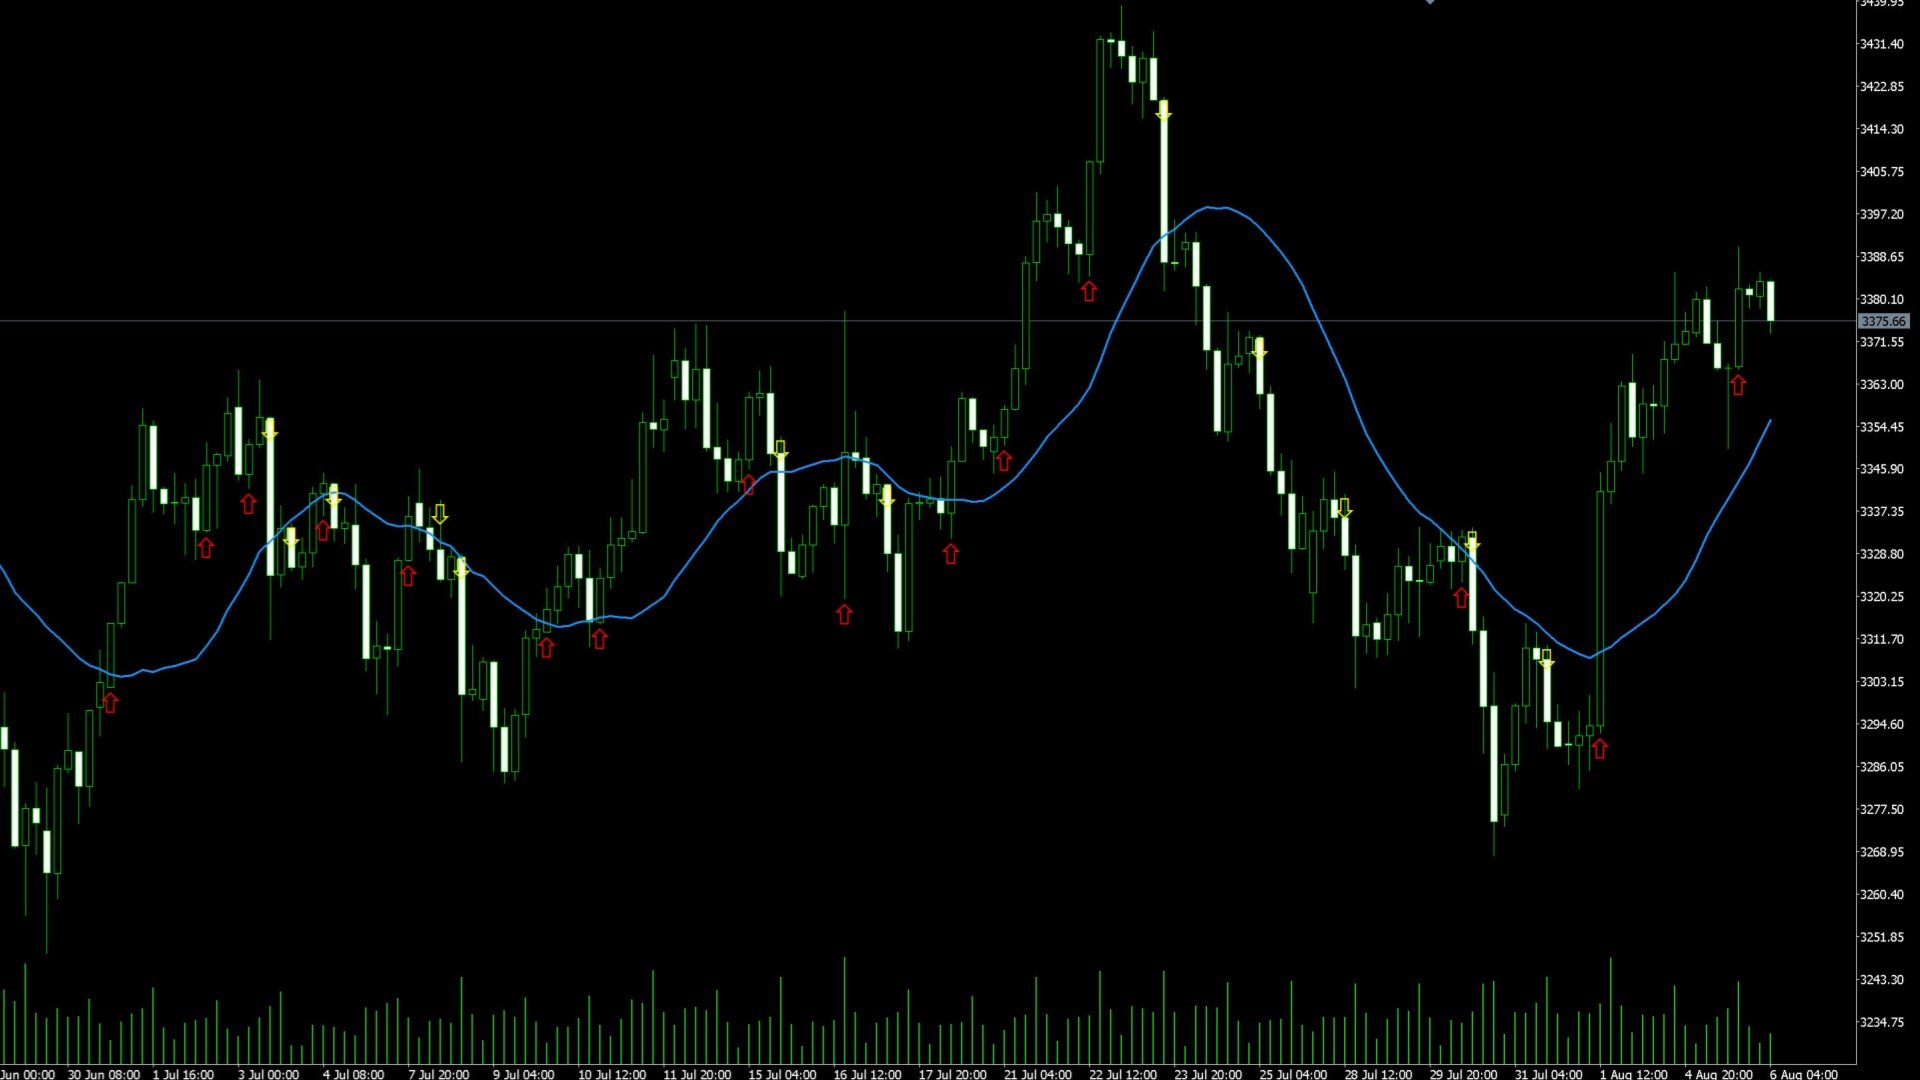
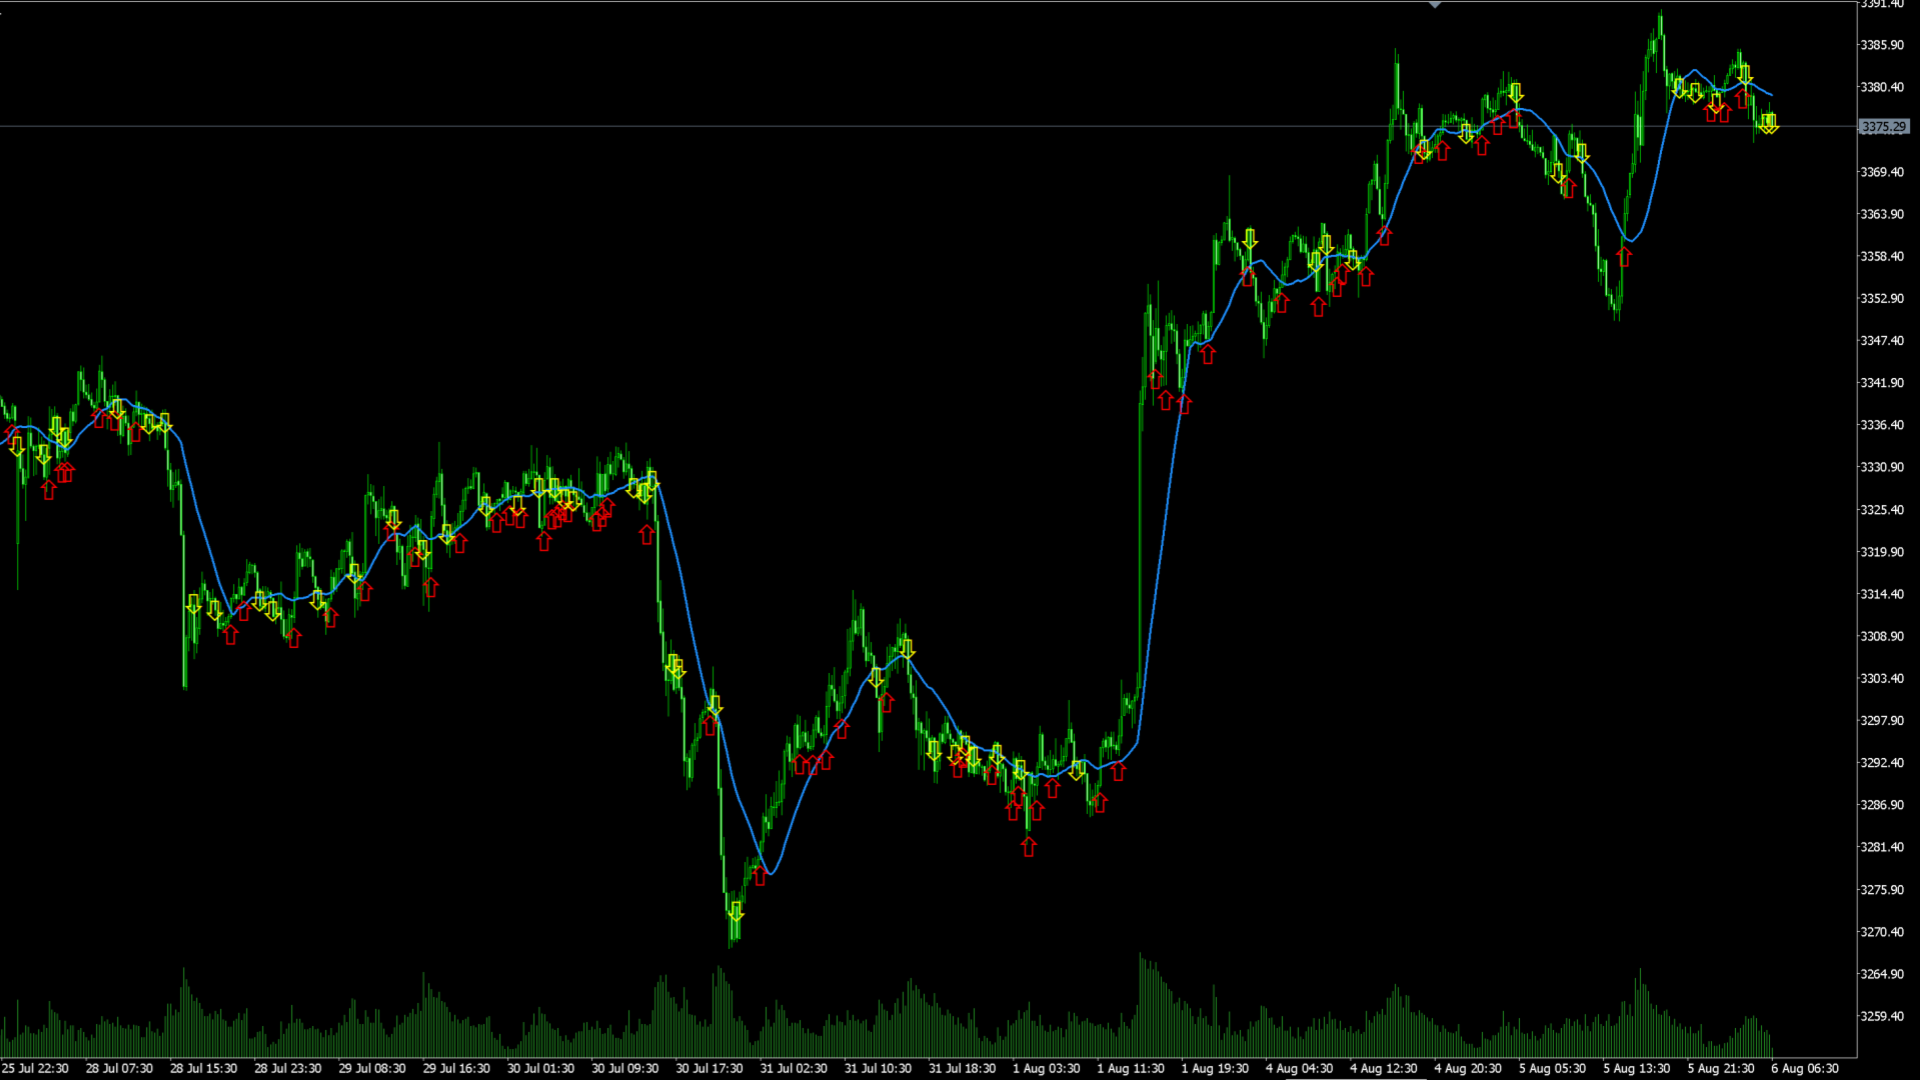
本指标是一款基于AI大数据分析的实时趋势突破探测工具,通过机器学习算法识别主力资金动向,帮助交易者在伦敦/纽约等核心交易时段精准捕捉趋势转折点。系统智能过滤市场噪音,在关键突破位置提供清晰的箭头信号,助您与机构资金同步布局。

核心功能
▶ 智能箭头信号

  • 红色向上箭头:检测到多头突破(默认颜色可调)

  • 绿色向下箭头:发现空头突破(默认颜色可调)

  • 基于K线收盘价确认机制,避免盘中假突破

专业使用指南

  1. 时段过滤
    最佳信号出现在:

    • 伦敦时段(08:00-16:00 GMT)

    • 纽约时段(13:00-21:00 GMT)
      亚洲时段信号建议结合额外确认

  2. 量价配合
    在15分钟图表中,当出现以下组合时信号最强:

    • 箭头信号 + 成交量放大 + 波动率提升

  3. 趋势验证系统
    推荐与MA20构建交易规则:

    • 多头信号仅当价格>MA20时有效

    • 空头信号仅当价格<MA20时有效
      (均线参数可自定义调整)

高级技巧

  • 日线级别趋势方向与箭头信号同向时,盈亏比更佳

  • 纽约时段尾盘(20:00 GMT附近)的信号需谨慎对待

  • 配合ATR指标可动态评估止损幅度



推荐产品
了解价格可能寻找流动性的位置 Liquidity Reaction Map MT5是一款基于图表的市场分析指标。它根据已确认的价格结构识别潜在的买方流动性区域和卖方流动性区域。 该指标将摆动高低点、等高点和等低点、前一日和前一周高低点、交易时段极值以及心理整数价格整合到一个清晰的流动性地图中。相互接近的价位可以合并,并根据强度、与当前价格的距离以及多个来源的一致程度进行排序。 该指标帮助交易者分析价格可能接近、扫过、拒绝或突破流动性区域的位置。它不会开仓或管理交易。 流动性来源 流动性地图可以从以下来源识别流动性: 已确认的摆动高点和低点 等高点和等低点 前一日高点和低点 前一周高点和低点 已完成交易时段的高点和低点 心理整数价格水平 多个可配置时间周期 买方流动性显示在相关高点上方,卖方流动性显示在相关低点下方。 这些区域是根据历史价格结构计算的估计值。该指标不会访问经纪商订单簿或真实的止损持仓数据。 排序后的流动性区域 检测到的价位会根据以下多个因素进行评估: 支持该价位的枢轴点数量 等高点或等低点的聚集程度 多个来源的一致性 时间周期的重要性 与当前价格的距离 价位的新鲜度 相互
Gold Confluence Pro v2.14 – 终极 XAUUSD 交易架构系统 Gold Confluence Pro 不仅仅是一个指标,它是一个结合了 机构级聪明钱概念 (SMC) 逻辑、多时间框架 (MTF) 分析和实时市场数据的综合交易框架。该系统专为黄金 (XAUUSD) 交易者优化,将复杂的市场结构集成到单一的专业仪表盘 (Dashboard) 中。 为什么选择 Gold Confluence Pro? 市场上成千上万的“买入/卖出”指标。然而,专业人士不依赖单一信号,他们信任的是**“共振” (Confluence)**。GCP v2.14 从 5 个不同的维度分析市场,只有当所有条件完美匹配时才会发出警报。 核心功能 1. 智能订单块 (Order Block) 检测与评分 拒绝平庸的方框!我们的算法自动识别包含 位移 (Displacement)、FVG (失衡区) 和 流动性扫荡 (Liquidity Sweep) 的强力机构区域。 动态邻近值 (Dynamic Proximity): 基于 ATR 的接近算法,根据当前市场波动性实时计算价格与区
Manyal trading system, CovEchoTrend Robot, focuses on reliability and flexibility. By employing statistical analysis methods to study the relationships between the base indicator and market patterns, the system enables a deeper understanding of market processes. Intelligent pattern analysis: The application of statistical data processing helps identify key trend reversal points more accurately, signaling significant market shifts. Informed decision-making is based on the intersection of indicato
Introduction This indicator detects volume spread patterns for buy and sell opportunity. The patterns include demand and supply patterns. You might use each pattern for trading. However, these patterns are best used to detect the demand zone (=accumulation area) and supply zone (=distribution area). Demand pattern indicates generally potential buying opportunity. Supply pattern indicates generally potential selling opportunity. These are the underlying patterns rather than direct price action. T
DYNAMIC TARGET AND SL MATRIX REAL-TIME FOREX DISTANCE ENGINE Stop guessing your SL and TP distance. Start measuring it. Dynamic Target and SL Matrix is a professional Forex analytical tool designed to calculate and display a dynamic distance framework for SL and TP planning directly from live market conditions. The engine continuously analyzes the current BID and converts the market state into a dynamic pip-distance reference, which is then expanded through a configurable multiplier matr
Market Steps MT5
Mahdi Ebrahimzadeh
市场步骤指标是基于江恩时间/价格相关性设计和建立的,并通过外汇市场的价格行动特定规则进行优化。它使用市场订单流的概念来预测潜在的高订单量的价格区域。 指标水平可用于交易本身,或作为一个组合来过滤其他策略/指标的错误信号。每个交易者都需要这样一个强大的工具,在图表上拥有多时间框架(TF)区域和价格运动的潜力。你可以在测试器模式下测试它的力量,看看它的水平如何支配图表上的价格。 指标的优势。 用两个不同的区域来标示图表,为不同的TFs指定趋势和范围市场。 价格行动交易者可以使用它来识别不同TFs/价格区的订单流,或验证FTR(失败返回)/FTC(失败继续)。 市场的波动区和流动区将出现在图表上,以便于未来的价格变动。 通过该指标,可以很容易地决定SL/TP、追踪、平衡和利润保存。 价格反转或延续可以很容易地被验证。 该指标的水平可以作为马丁格尔或网格水平使用,概率更高。
Gold Scalper pro Nova
Emmanuel Eliud Kaguangi Mwaura
The fully automated Expert Advisor built exclusively for XAU/USD (Gold). This EA combines a high-probability, three-EMA trend-following strategy with a professional two-stage risk management system to secure profits quickly and efficiently. Optimized for the M1/M5 timeframes. ​ The Strategy: Filtered 3-EMA Crossover ​Our system utilizes three Exponential Moving Averages to confirm both momentum and trend direction, dramatically reducing false signals common in basic crossover EAs. ​Fast EMA (
该指标提供了一种基于'回归通道工具'概念的强大市场分析方法。通过利用此工具,交易员可以在图表上对回归通道获得出色的控制,从而使他们能够做出更明智的交易决策。 '回归通道工具'是交易员工具箱中的一个强大工具。它旨在为价格趋势和潜在支撑和阻力水平提供有价值的见解。该工具特别适用于在趋势内部可视化修正波动,提供了对价格动态的综合视图。 以下是更详细地了解使用此指标的关键功能和优势: 通道水平和支撑/阻力:   该指标的主要优势之一是其能够生成作为动态支撑和阻力区域的通道水平。这些水平在确定潜在的入场和出场点方面至关重要,增强了交易策略的精确性。 修正波动水平:   通过启用修正波动水平,交易员可以在更大的趋势内识别潜在的修正。这个功能有助于识别回撤,并帮助交易员利用有利的价格波动。 直接控制:   该指标的控制面板允许无缝地操纵回归通道。交易员可以微调填充和射线选项等设置,提供符合其分析风格的通道定制视图。 更高时间框架分析:   为了获得更广泛的视角,该指标具有从更高时间框架加载数据的功能。这个功能可以帮助交易员评估不同时间尺度上的趋势和通道,促进对市场动态的更全面了解。 如何使用: 设置
**Semenov S Indicator — market structure without subjectivity** A professional indicator based on Smart Money Concept. It doesn’t give random signals — it shows real market structure and key areas where institutional activity is likely present. ---  What the indicator does * Identifies trend direction (including multi-timeframe context) * Automatically builds supply and demand zones (Order Blocks) * Detects key structural shifts:   * BOS (Break of Structure)   * CHOCH (Change of Character)
Overview TriParity AfterShock PRO Scanner 是一款用于 MetaTrader 5 的自主判断型仪表盘指标。在本说明中,triad 指三组货币对或三种交易品种之间的关系。Scanner 可在一个面板中查看多个 triad 和多个时间周期,并帮助交易者以更有条理的方式整理观察列表。其目的是减少图表过载、并排比较候选机会,并突出显示值得进一步关注的市场状态。 本产品并不执行三角套利。真正的三角套利需要几乎同时完成三条腿的执行、极低的延迟以及极低的交易成本。Scanner 旨在用于自主判断临时性偏离状态,这些偏离可能会在平价调整之后暂时保留下来。 Functions Scanner 会在多个时间周期上分析所选 triad,并通过 NOWCAST 显示当前状态。NOWCAST 会将形态评级为 A、B、C 或 NG。在这里,NG 表示当前状态并不适合。这些评级表示关注优先级,而不是最终的买入或卖出决定。最终确认应在 Catcher 或执行图表中进行。 7.0 版本为 MTF 单元格增加了更多信息。除评级外,面板还可以显示方向偏向、已接受信号标记、如 MR、T
The Bitcoin Reaper
Profalgo Limited
3.71 (34)
推出促销: 按当前价格仅提供数量极少的副本! 最终价格:999美元 新品(349 美元起)-->免费获得 1 个(适用于 2 个交易账户号码)。 终极组合优惠   ->   点击此处 加入公共群组: 点击此处   LIVE SIGNAL LIVE SIGNAL V2.0 UPDATE 2.0 INFO 欢迎来到比特币收割者!   在黄金收割者取得巨大成功之后,我决定是时候将同样的成功原则应用到比特币市场了,而且,它看起来很有希望!   我开发交易系统已有二十多年了,到目前为止,我的专长是突破策略。 这种简单有效的策略一直以来都位居最佳交易策略之列,并且几乎适用于任何市场。     对于像比特币这样波动剧烈的市场来说,它更是锦上添花!   那么该策略如何发挥作用? 突破策略将交易突破重要支撑位和阻力位的走势。     该策略将为每笔交易设置止损、止盈和各种追踪止损功能。 对于比特币收割者,我在 H1 时间范围内实现了这一点,这使得它交易频繁,但仍然非常有效。   此外,我还确保了 EA 能够自动适应比特币未来的价格变化。     所以,如果比特币交易价格在 10 万左右、1 万左右或
Xelox
Yvans Tetua Li Cheng
XELOX — 黄金哨兵 XAUUSD 日内智能交易系统 · 结构突破 · 无网格、无马丁格尔 当前价格:399 美元。每售出 10 份价格上调 50 美元,直至最终价格 999 美元。 传说 在任何一座大金库里,真正重要的黄金从来不是陈列出来的那些,而是在无人注视时、在时辰之间悄然移动的黄金。 XELOX 之名,正取自这种移动。 传说从不把黄金托付给唯一的守望者。守护那道宏大边界的卫士——那条黄金整整守持一个月、每季才越过一次的边界——与另一种哨兵相呼应:当卫士等待季节更替时,哨兵则在时辰之间的走廊里巡行。他守望重大的行情,她则注视白昼本身。她学到了每个日内交易者最终都要吃亏才明白的道理——黄金不断地说谎。它突破一个价位来引诱急躁者,随后又急速回撤,把他们抛在错误的一侧。 于是她不再相信第一波行情。她守在黄金所守持的每一道边界之后,等待证据。不是意图——而是证据。当突破为真时,她果断入场,一次,毫不犹豫。而她从不交还已经占据的阵地。 这就是这款智能交易系统的全部理念。它不预测。它不逆势加仓摊平。它不会为了拯救一笔亏损单而开第二笔。它等待黄金证明其突破,然后守护它所夺得的一切。 XEL
TVM Chitumwa
YIVANI KUNDAI CHITUMWA
TVM Chitumwa:噪声与动量的几何学 面向 MetaTrader 5 的机构级全变差分析 全变差最小化是应用数学中的一项成熟技术,广泛用于医学影像、地震勘探数据和卫星图像的降噪处理,在去除噪声的同时保留原始信号。TVM Chitumwa 将这一数学血统引入价格行为分析:这是一款市场状态识别引擎,通过比较市场净结构位移与其实际运行的总路径长度,从高频噪声的几何阴影中分离出真正的方向意图。 标准平滑类指标存在滞后性,传统震荡指标则迫使你在强趋势中逆势操作。TVM Chitumwa 彻底摒弃了这些散户化的概念。 该指标出现的极端峰值并非衰竭信号,而是趋势处于无摩擦运行状态的数学证明。 双核架构 同时为极速手动操作和严谨的算法回测而设计: 面向人工操盘手(Full-Flush 界面): 零视觉负担的执行体验。指标严格运行在 0.0 至 1.0 的幅值区间内,单一固定的黄金阈值决定资金的释放时机。一旦结构效率发生转变,整条指标线会瞬间统一切换为唯一的绝对状态:Steel Blue 钢蓝色(看涨顺风区)、Coral Red 珊瑚红色(看跌真空区),或 Obsidian Gray 黑曜灰
PrimeTrend bot
Andrei Moldovan
PrimeTrend EURUSD EA: Intelligence at the Service of Your Trading! Have you ever wanted a trading system capable of working 24/5, making precise decisions, and minimizing risk? PrimeTrend EURUSD EA is the solution you've been searching for! Designed to dominate the EUR/USD market with advanced trend-based strategies and technical analysis, this Expert Advisor is here to revolutionize the way you trade. Why Choose PrimeTrend EURUSD EA? 1. Excellent Performance Based on a proven strategy that le
CChart
Rong Bin Su
在外汇和金融市场中,快速反应和精准的决策至关重要。然而,常规的 MetaTrader 5 终端最低只支持 1 分钟图表,限制了交易者对市场波动的敏感度。为了解决这一问题,我们推出了全新的 秒级图表 K 线指标 ,让您在副图中轻松查看和分析 1 秒至 30 秒的市场动态。 主要功能 支持多种秒级周期 :该指标允许您选择以下周期,满足不同交易策略的需求: S1 : 1 秒 S2 : 2 秒 S3 : 3 秒 S4 : 4 秒 S5 : 5 秒 S10 : 10 秒 S15 : 15 秒 S20 : 20 秒 S30 : 30 秒 实时更新 :秒级图表将实时更新,确保您在每一刻都能获取到最新的市场信息,帮助您做出及时的交易决策。 用户友好的界面 :该指标在副图中显示,直观易用,您可以轻松切换不同的时间周期,快速分析市场走势。 适用人群 短线交易者 :适合高频交易和短线策略的交易者,通过秒级图表捕捉瞬息万变的市场机会。 技术分析师 :为技术分析提供更细致的数据支持,帮助您识别潜在的买入和卖出信号。 如何使用 将指标添加到您的图表上。 选择您希望观察的秒级时间周期。 实时监控市场动向,利用丰富
Quantumcoremt5
Dayanand Pandey
Product Name:   Quantum Core MT5 - Swing Trading EA for XAUUSD Description:   A swing trading expert advisor designed to execute 15-30 trades per month with built-in risk management parameters. Key Features: Algorithmic Strategy: Combines technical algorithms with market analysis for trade execution. Auto-Lot Sizing: Adjusts position sizes based on account equity (configurable). Risk Control: Options for manual SL/TP or dynamic risk parameters. Equity Limits: Built-in safety stop feature allows
One Man Army
Ihor Otkydach
4.75 (24)
每位買家皆可享專屬好禮: 購買此機器人的買家將獲贈 GRABBER BOT :本活動限時優惠,請把握機會! 無炒作,無魯莽風險。以最小回撤進行交易:One Man Army 是一個為個人交易與資金公司交易而設計的多貨幣交易系統。它採用短期和中期市場修正與反轉的剝頭皮策略,通過掛單限價單進行交易。這個交易機器人不會猜測方向,而是在最佳價格區域以高精度進場。正如你所喜歡的那樣,現在讓我們詳細說明。 測試時請使用貨幣對 EURCAD,時間框架 M15.  One Man Army 是基於在多個資產與市場階段的廣泛測試而開發的。該系統的行為穩定、可預測且易於分析。它專為重視控制、安全和系統化方法的交易者設計。 LIVE SIGNAL "Double shot" -   Click here Installation and setup guide – HERE This trading bot is part of the   Intaradaysoft CORE INDEX ecosystem 主要特點 無馬丁格爾,無加倉平均 每筆交易都受到止損保護 適用於資金公司與個人交易 交易時間週
Mayari MT5
Jose Lagayan
Introducing the MAYARI MT5: The Trend Indicator Expert Advisor *Set Files for EURUSD available on the Comments Section *RESULTS SHOWN HERE ARE NOT OVER OPTIMIZED UNLIKE OTHER BOTS THE IS FOR SALE! ONLY REALISTIC RESULTS! *The default settings of MAYARI MT5 are optimized for EURUSD, based on rigorous back-testing over a 4-year period. For safe and effective operation, it's recommended to use the default settings with an account balance of at least $1,000 USD. Embark on a journey where technology
Introduction to Fractal Pattern Scanner Fractal Indicator refers to the technical indicator that makes use of the fractal geometry found in the financial market. Fractal Pattern Scanner is the advanced Fractal Indicator that brings the latest trading technology after the extensive research and development work in the fractal geometry in the financial market. The most important feature in Fractal Pattern Scanner is the ability to measure the turning point probability as well as the trend probabil
This indicator is a unique, high quality and affordable trading tool because we have incorporated a number of proprietary features and a new formula. With this update, you will be able to show double timeframe zones. You will not only be able to show a higher TF but to show both, the chart TF, PLUS the higher TF: SHOWING NESTED ZONES. All Supply Demand traders beautifully integrated with Moving Average Clouds. I am sure you will love it. Tips User Manual Use my template  Optimize Zone Strength f
CISD Levels Pro automatically draws CISD Buy and Sell levels directly on your chart. It highlights pending levels while they are forming, then marks confirmed levels after the confirmation candle closes. Optional confirmation arrows help you spot the signal quickly. This tool is designed for traders who want clean, simple CISD level visualization without extra indicators or clutter. Key Features Draws Bullish (BUY) CISD levels and Bearish (SELL) CISD levels Shows Pending levels (dashed) and
Favero Buy and Hold
Alexandre Favero
Indicator Description Opportunity Identification Indicator — Smart Money This indicator was developed to assist in identifying moments when prices may be reaching areas of greater interest , seeking possible signals in market behavior associated with the concept of “smart money” (Smart Money) , widely discussed in financial literature and market studies. The proposal is to create a bridge between technical analysis and fundamental analysis . The indicator uses technical analysis and price behavi
SLTrailingATR
Motohiro Umehara
SLTrailingATR — User Guide Overview SLTrailingATR is a professional risk management Expert Advisor that automatically manages Stop Loss for your existing positions using M1 timeframe ATR . It will: Set an initial Stop Loss automatically Trail Stop Loss as the trade moves in your favor Never move Stop Loss against your position This EA does NOT open trades . It works perfectly with manual trading, signal services, and any other Expert Advisor. ️ Key Features Feature Description Initial S
FREE
Trade Summary Pro
Fatsani M Nkhono
Trade Summary is a professional on-chart dashboard for MetaTrader 4 & 5 that provides a clear, real-time overview of your open trades. Monitor floating profit/loss, entry price, lot size, account risk, distance to stop loss, stop loss and take profit values, balance, and equity—all from one compact panel. Designed for traders who value speed and effective risk management, Trade Summary eliminates manual calculations and keeps essential information visible at a glance. It also includes a privacy
Cleetah EA MT5
Guo Shan Zhao
Cleetah EA MT5 是一款专为 XAUUSD(黄金)M15 时间框架开发的趋势跟踪全自动交易系统。它是一个完整的交易闭环。自动判断潜在趋势,自动计算仓位,自动进场,自动出场,并且具备完美的风险控制。随着每一波趋势行情的结束,曲线完美地上升一个台阶。当然,台阶的高低取决于趋势的大小。 要求和建议 交易品种: XAUUSD (黄金) 时间周期::M15 (15 分钟) 推荐经纪商: 提供低点差交易的经纪商 黄金价格限额为小数点后两位。与提供黄金价格限额为小数点后三位的经纪商不兼容。 建议初始存款:≥1000 美元(杠杆比例为 1:100)。 让 EA 全天候运行。 我——只为长期、稳定获利存在。 我的代码运行速度很快并且稳定。 我的电脑配置要求很低。 我的逻辑经受住了实战考验。 我的表现得到了验证,在真实市场中而不仅仅是回测。 无论您是新手还是经验丰富的交易员,我都能为您带来轻松而自由的交易体验。 你只需要加载我并启动,让我自动完成工作,然后坐等结果。 风险提示 历史表现不代表未来收益。 任何交易系统都无法避免回撤与亏损,Cleetah EA MT5 也不例外。 上线实盘前,请先
Old School Reversal Zones
Kavita Krishnakumar Ojha
I'll keep it Short and to the point.  Let Your Backtest Results Speak for Themselves. After much deliberation, we’ve decided to release the foundational logic behind our process for public use. This isn’t about changing the way you trade—because we know that’s unique to you. The best ways to enter a position? Those have always been confidential ! What we can share is the first of three essential steps we use before entering any trade. This tool is designed to keep you on the right side of the m
多时间周期RSI指标 使用我们直观的RSI指标,释放多时间周期分析的强大功能! 在一个图表上全面了解不同时间周期的市场动量。我们的多时间周期RSI指标允许您在五个可自定义的时间周期中以一致的周期跟踪相对强弱指数(RSI),使您能够做出更明智的交易决策。 主要特点: 同步多时间周期视图: 在一个图表上同时监控多达五个不同时间周期的RSI,无需在窗口之间切换。 可自定义时间周期: 定义您喜欢的时间周期以适应您的交易策略,从M1到MN。 统一的RSI周期: 在所有选定的时间周期中保持一致的RSI计算周期,以便进行直接比较。 清晰的视觉表示: 轻松识别超买/超卖情况以及多个市场周期中的动量变化。 增强的决策制定: 发现时间周期之间的背离和趋同,提供对市场趋势的更深入洞察。 用户友好的界面: 简单直观的设置,可立即使用。 为什么选择我们的多时间周期RSI? 该指标是寻求改善市场分析的交易者不可或缺的工具。通过提供跨各种时间周期的RSI的整体视图,您可以更好地理解资产的潜在强度或弱点,并预测潜在的价格变动。无论您是日内交易者、波段交易者还是长期投资者,该指标都将显著提高您的分析能力。
CycleDivergence
Enrico Mariani
Please,put CycleDivergence in the same folder of TimingCycleWithLLV otherwise it does not run. As for the cycle discussion, I invite you to read the TimingCycleWithLLV indicator presentation ...please ask me if something is not clear. I think tha time is much more important than price;this is the reason for wich I trade only when one cycle finishes and the new one start. In order to use the CycleDivergence indicator follow these steps: 1) for example (see imagine number four) 1 minute chart,in t
Lorentzian Classification EA
Michael Prescott Burney
Lorentzian Classification EA for MetaTrader 5 Lorentzian Classification EA is a machine-learning-based Expert Advisor for MetaTrader 5 designed to classify market conditions and automate trade execution using a structured confirmation process. It combines Lorentzian Distance K-Nearest Neighbors (KNN) classification with kernel regression trend confirmation, then applies multiple market filters and configurable trade management rules before opening a position. The system was built for traders who
FREE
This indicator works on atr with some edited . The AI ​​MACD FILTER indicator is used for confirmation. Certainly, the indicator contains an alert when the signal appears, and you use the exit of the deal on the saturation that occurs at the AI ​​MACD. The accuracy of the work is high on gold, the time frame is five minutes, while staying away from trading at the time of news that occurs on the US dollar. And using high liquidity trading times, which are two hours before the opening of the Lond
该产品的买家也购买
FX-AIEA 供给需求区智能识别指标(Supply and Demand Indicators MT5)——技术原理与参数讨论 版本:2.51 | 适用平台:MetaTrader 5 引言 供给需求区是机构订单流的重要表现形式,相比传统支撑阻力位能更直接地反映买卖力量的失衡。本指标尝试通过算法自动识别高概率供需区域,以减少手动绘制的耗时与主观性。其核心逻辑基于自适应 ZigZag 算法,提取波峰波谷并生成区域标识 。 核心技术特点 全自动绘制机制 :基于改良版 ZigZag 动态提取有效极值,标记潜在供给区与需求区。指标遵循 MQL5 原生   prev_calculated   机制,在新 K 线生成时自动重绘,支持跨周期强制计算( Forced_TimeFrame   参数)。 区域边界模式 :支持宽带(覆盖K线影线极值)与窄带(仅覆盖实体)两种模式,用户可通过   use_narrow_bands   参数切换,以适应不同交易风格。 滤噪算法 :启用   kill_retouch   后,自动剔除被后续行情反复轻触但未有效突破的弱势区域,以提升信号有效性。 视觉与性能 :支持自
PrimeScalping
Temirlan Kdyrkhan
PrimeScalping is a powerful trading companion designed to generate high-probability entry signals with dynamic TP/SL/DP levels based on volatility. Built-in performance tracking shows win/loss stats, PP1/PP2 hits, and success rates — all updated live. Key Features: Buy/Sell signals with adaptive volatility bands Real-time TP/SL/DP levels based on ATR Built-in MA Filter with optional ATR/StdDev volatility Performance stats panel (Success, Profit/Loss, PP1/PP2) Alerts via popup, sound, push, or e
TrendMaestro5
Stefano Frisetti
note: this indicator is for METATRADER4, if you want the version for METATRADER5 this is the link:  https://www.mql5.com/it/market/product/108106 TRENDMAESTRO ver 2.5 TRENDMAESTRO recognizes a new TREND from the start, he never makes mistakes. The certainty of identifying a new TREND is priceless. DESCRIPTION TRENDMAESTRO identifies a new TREND in the bud, this indicator examines the volatility, volumes and momentum to identify the moment in which there is an explosion of one or more of these da
SMC Sweep Fvg MT5
Daniil Sleptsov
5 (1)
SMC Sweep Fvg MT5 — 像聪明钱一样看市场,就在你的图表上 你一定有过这种感觉:价格扫掉你的止损,随后反转,并正好走到你预期的方向。方向你是对的,错的只是入场。 这个指标就是为了让这类情况少发生。它接手分析中最繁重的部分——图表标注,把真正重要的留给你:决策。 你会在图表上看到什么 市场结构 — 真实的结构高点与低点,带有 HH / HL / LH / LL 标记和水平线。趋势一目了然,无需猜测。 失衡区(FVG) — 价格推进过快、之后常会回补的区域。未回补与已回补的区域用不同颜色显示。 流动性行为 — 指标跟踪市场在反转前扫过关键水平的时刻。 现成的交易布局 — 入场箭头、止损位与盈利目标。全部画好,无需心算。 趋势过滤 — 更高周期的趋势线,帮你站在主趋势一侧。 指标关注流动性扫荡、失衡形成与结构状态——并只突出这些因素同时对齐的情形。 统计面板——回应每一个疑虑 你不必只听别人说。图表上的内置面板会按所选历史显示: 分析周期(K线数量); 检测到的情形总数; 多少到达目标、多少触及止损; 仍在运行中的数量; 以点数计的净结果。 切换品种——面板重
SmartScalping
Temirlan Kdyrkhan
SmartScalping is a powerful trading companion designed to generate high-probability entry signals with dynamic TP/SL/DP levels based on volatility. Built-in performance tracking shows win/loss stats, PP1/PP2 hits, and success rates — all updated live. Key Features: Buy/Sell signals with adaptive volatility bands Real-time TP/SL/DP levels based on ATR Built-in MA Filter with optional ATR/StdDev volatility Performance stats panel (Success, Profit/Loss, PP1/PP2) Alerts via popup, sound, push, or e
ScalpPoint
Temirlan Kdyrkhan
ScalpPoint is a powerful trading companion designed to generate high-probability entry signals with dynamic TP/SL/DP levels based on volatility. Built-in performance tracking shows win/loss stats, PP1/PP2 hits, and success rates — all updated live. Key Features: Buy/Sell signals with adaptive volatility bands Real-time TP/SL/DP levels based on ATR Built-in MA Filter with optional ATR/StdDev volatility Performance stats panel (Success, Profit/Loss, PP1/PP2) Alerts via popup, sound, push, or emai
Boom & Crash & PainX & GainX Ultimate Spike Detector Trade Spikes With Confidence — Not Guesswork Catching spikes should be one of the most profitable strategies in synthetic markets. But for most traders, it becomes one of the most frustrating. You enter too early… price goes against you. You wait for a spike… it never comes. You finally catch one… but don’t know whether to hold or close. You make profit… then give it all back because there’s no exit plan. This is exactly the problem the Ultim
TrendProMaster
Temirlan Kdyrkhan
MasterTrend Indicator for MT5 A powerful trend-following and signal-evaluation tool MasterTrend   is a custom MT5 indicator that combines Moving Averages and ATR-based risk/reward logic to generate clear buy/sell signals. It visualizes dynamic SL/TP levels, evaluates past trade outcomes, and displays win/loss statistics in a clean on-chart panel. Key features include: Buy/Sell signals based on MA crossovers ATR-based SL/TP1/TP2/TP3 levels with visual lines and labels Signal outcome tracking wit
Transaction Speed MT5
Ivan Stefanov
5 (4)
当然,以下是翻译成中文(简体)的版本: 该指标标出市场中显现出 交易兴趣 的区域,并随后显示 订单积累区域 。它的工作方式类似于大规模的订单簿。 这是为 大资金 打造的指标,性能卓越。市场中有任何兴趣,你都能通过它清晰看到。 (这是一个 完全重写的自动化版本 —— 不再需要手动分析。) 交易速度 是一个全新的概念指标,它显示了市场上大订单 何时 、 何地 聚集,并揭示了其背后的意义。它可以在 非常早期 就检测到趋势的变化。 在外汇市场,所谓的“交易量”实际上是误导性的,因为那指的是价格在单位时间内的变化,因此真正的名称应是“交易速度”。 一切都取决于我们如何思考、如何行动、如何分析。 改变分析范式至关重要。 该指标完全重构了外汇市场上“交易量”的概念,用逻辑方式重新定义并应用,从而成为一个 独特而精准的工具 。 使用方法: 默认情况下,指标处于 自动模式 ,可独立用于任何时间周期。如果你希望切换到手动模式,只需点击 Auto / Manual Mode 按钮即可。 在 手动模式 下,所有计算从 2025年1月1日 开始。你可以根据需要更改该日期,以查看不同的分析结果。 最优数据周期
==================================================================== SMC Pro v6.1 APEX AI — XAUUSD Gold Empire MetaTrader 5 指标 · Smart Money Concepts · 预测智能引擎 ==================================================================== SMC Pro v6.1 APEX AI 是一套专业的 Smart Money Concepts 指标系统,专为 MetaTrader 5 上的 XAUUSD(黄金)打造。 它将完整的 SMC 框架——Order Blocks、Liquidity sweeps(流动性扫荡)、Fair Value Gaps、Break of Structure、Change of Character——与 8 个全新的 AI 驱动模块相结合,直接在图表上呈现精准的可视化信号、预测轨迹线、彩色的 SL/TP 风险回报框,以及三级自适应 TP Ladde
看清市场真正在做什么。   在您眼前实时观察三大市场阶段(收缩、扩张、趋势),并在趋势阶段的早期阶段抓住更优的入场点。   不要再猜测。开始像机构和聪明钱那样解读市场。   Apex Market Structure Pro(MT5 版)是一款精准的聪明钱分析工具,它剥离噪音,向您展示每根 K 线之下的真实结构:流动性、结构转变、吸   筹区域与趋势偏向,全部呈现在一个简洁、专业的图层中。专为厌倦了滞后指标、准备以清晰视角交易的严肃交易者打造。   重要提示:本指标专为 Heikin Ashi(平均足)K 线设计。使用前请将图表切换为 Heikin Ashi,以释放其全部威力。全部分析都围绕 Heikin   Ashi 的价格流构建。正是在这里,Apex Market Structure Pro 发挥出最佳表现。   交易者为何选择 Apex Market Structure Pro:   流动性,一览无遗: 瞬间看清止损池所在之处。卖方与买方流动性会被自动标注。实时关注尚未被扫的价位,捕捉价格攫取流动性并反转的精确时   刻。在聪明钱交易的地方交易。   会说话的结构:
AriX
Temirlan Kdyrkhan
1 (4)
AriX Indicator for MT5 A powerful trend-following and signal-evaluation tool AriX is a custom MT5 indicator that combines Moving Averages and ATR-based risk/reward logic to generate clear buy/sell signals. It visualizes dynamic SL/TP levels, evaluates past trade outcomes, and displays win/loss statistics in a clean on-chart panel. Key features include: Buy/Sell signals based on MA crossovers ATR-based SL/TP1/TP2/TP3 levels with visual lines and labels Signal outcome tracking with real-time stat
Meravith MT5
Ivan Stefanov
5 (3)
做市商工具。 Meravith 将: 分析所有时间周期并显示当前正在运行的趋势。 标注流动性区域(成交量均衡区),即多头与空头成交量相等的位置。 在您的图表上直接显示来自不同时间周期的所有流动性水平。 生成并展示基于文本的市场分析供您参考。 根据当前趋势计算目标位、支撑位和止损位。 计算交易的风险回报比。 根据您的账户余额计算仓位大小,并估算潜在利润。 在市场出现重大变化时,Meravith 还会发出警告。 指标的主要线条: 多头/空头成交量衰竭线 —— 作为目标位使用。 趋势线 —— 指示市场趋势方向。根据市场是多头还是空头而改变颜色,并作为趋势支撑。其颜色主要反映市场情绪。 成交量均衡线(Eq)—— Eq(Volume Equilibrium)是系统的核心。它表示买卖双方成交量的平衡点,即市场流动性所在位置。向上突破 Eq 表示多头倾向,向下突破 Eq 表示空头倾向。突破后,应等待回调——当价格回到相反趋势的偏离线或衰竭线附近时。 使用方法:只需将其添加到图表中。 Meravith 可以分析一切——趋势和回调。 趋势线与某条成交量衰竭线之间的距离越大,说明该方向的成交量越高。 趋势
VTrende Pro
Andrii Diachenko
5 (1)
VTrende Pro - MTF indicator for trend trading with a display panel for MT5 *** Videos can be translated into any language using subtitles (video language - Russian) Although the signals of the VTrende Pro indicator can be used as signals of a full-fledged trading system, it is recommended to use them in conjunction with the Bill Williams TS. VTrende Pro is an extended version of the VTrende indicator. Difference between Pro version and VTrende: - Time zones - Signal V - signal 1-2 waves -    S
CGE Trading Suite
Carl Gustav Johan Ekstrom
5 (1)
Institutional-Grade Analytics for MT5 The full analytical edge of a professional trading desk, built into your MT5 chart. CGE Trading Suite is an indicator system of 21 integrated modules covering market structure, timing, momentum, volume, capital flow and regime change, combined into a single chart-based workspace. Why CGE Trading Suite? The suite empowers traders with structure, confidence, and consistent performance across all markets and time frames. Hover over any signal or tool on the c
Meravith Scanner
Ivan Stefanov
5 (3)
MERAVITH SCANNER 是一款适用于 MetaTrader 5 的专业金融市场指标,将多种分析工具整合为一个统一的系统。它基于专有的成交量加权平均价格(VWAP)方法自动完成所有计算,完全消除主观判断。 该指标适用于所有资产类别(外汇、股票、指数、大宗商品、加密货币)以及从 M1 到 Monthly 的所有时间周期。其核心原理是价格跟随成交量。MERAVITH 识别机构资金成交量的集中区域,并从该集中区域中推导出数学上精确的价格水平。它不预测,不推测。它只计算。 使用 MERAVITH SCANNER,您可以在 2–3 分钟内扫描全部 28 个主要外汇货币对的所有时间周期。您也可以扫描任何您选择的市场——例如,大约 100 只股票约需 10 分钟。 该指标计算耗尽水平、平衡线、偏差、统计水平以及目标投射。 图表元素 Origin Point 标记所有计算的起始位置。指标会自动将其放置在最佳位置。红色标签(TOP)表示市场高点并带有看跌倾向。绿色标签(BOTTOM)表示市场低点并带有看涨倾向。 Sentiment Line 是一条动态曲线,反映基于成交量加权计算得出的市场情绪。
OrderFlow Absorption – 專業級MT5買賣差與吸收訊號指標 釋放真正訂單流分析的力量,OrderFlow Absorption 是MetaTrader 5上最強大的買賣差(Delta)直方圖與吸收訊號指標。專為想看清每一個價格波動背後真相的交易者設計,這個工具揭示了隱藏的買賣壓力與推動市場的吸收事件。 功能特色 買賣差直方圖視覺化:   以清晰的色彩直方圖即時顯示買方與賣方壓力。 吸收訊號偵測:   先進邏輯自動辨識多空吸收事件,及早預警潛在反轉。 圖表標記:   吸收訊號直接標示於主圖表,方便視覺辨識。 彈出式警報:   新吸收訊號出現時即時通知。 自訂門檻:   過濾弱訊號,專注高勝率機會。 資源管理:   高效運算,適用於大型圖表也能流暢運行。 全品種兼容:   適用於任何商品與週期,包括外匯、指數、商品等。 簡易整合:   參數簡單,快速上手與調整。 OrderFlow Absorption 的邏輯說明 OrderFlow Absorption 採用專利演算法,能在沒有完整Tick數據的情況下,估算每根K棒的買賣壓力(Delta)。它分析成交量、價格行為、K
历史相似性匹配指标  概述 历史相似性匹配器(Historical Similarity Matcher)是 MetaTrader 5 的技术分析指标。它扫描历史价格数据,寻找与用户在图表上选定的参考时期具有统计相似性的片段。当找到匹配时,指标会显示历史模式,并根据这些历史片段的后续走势绘制潜在未来价格走势的投影。 本指标仅供教育和分析用途,不构成财务、投资或交易建议。不保证结果或盈利能力。过去表现不代表未来结果。交易存在重大损失风险。用户对自己的交易决策和结果负全责。  功能特点 - 识别与选定参考时期具有相关性的历史价格片段 - 支持正向和反向模式匹配 - 显示多个匹配的历史模式(数量可配置) - 为每个匹配绘制基于历史延续的独立投影线 - 可选 OpenCL 支持,在兼容硬件上加速计算(不支持时回退到 CPU) - 适用于任何时间周期和交易品种 - 允许在不同于当前图表的时间周期上进行扫描 - 在图表上提供启动扫描和导出结果的按钮 - 导出每个匹配的截图以及包含匹配详情的 CSV 文件  工作原理 1. 用户通过在图表上放置两条垂直线或在输入参数中设置日期来选择
ZIVA Signal Intelligence
Hassan Abdullah Hassan Al Balushi
ZIVA Signal Intelligence An Adaptive, Modular Market Intelligence System ZIVA Signal Intelligence is not positioned as a conventional trading indicator. It is a fully integrated, proprietary market intelligence system engineered to deliver structured, high-precision interpretation of price behavior within a controlled analytical environment. Developed through an independent architectural approach, ZIVA does not rely on, derive from, or replicate existing indicators. It represents a standalone
OmniSync Projection
Antonio-alin Teculescu
5 (1)
Chronos Fractal Engine is an innovative price projection indicator for MetaTrader 5, designed to transform your technical analysis by intelligently identifying and projecting historical price patterns. Built upon an advanced correlation algorithm and the fractal principles of the market, this powerful tool visualizes potential future price movements, giving you a unique edge in your trading decisions. What is Chronos Fractal Engine? At its core, the Chronos Fractal Engine employs a sophisticat
SMC Institutional Suite
Catur Cipto Nugroho
SMC Institutional Suite v3.7 Professional Smart Money Concept Indicator for MetaTrader 5 What is New in Version 3.7 - Visual Stability Update This release focuses entirely on one goal: making every zone, label, and line on your chart rock-solid stable. There is no more flickering, no more zones disappearing on a new candle, and no more duplicate drawings. Order Block (OB) zones no longer flicker or disappear. Once drawn, they stay permanently on the chart. Equal Highs and Equal Lows (EQH / EQL)
First time on MetaTrader, introducing IQ Star Lines - an original Vedic Astrology based indicator. "Millionaires don't use astrology, billionaires do" . - J.P. Morgan, Legendary American financier and banker. We don't offer free or bonus indicators in exchange of reviews from you. You won't need any free products with this indicator to make it work. ;) Enjoy! Welcome to  the new and updated  IQ Star Lines , the ultimate fusion of ancient planetary harmonic cycles and modern quantitative trading.
Binary Compound Indicator V3 Binary Compound Indicator V3 is a technical analysis indicator for MetaTrader 5 designed to help traders identify potential market opportunities using multiple confirmation filters and structured risk management concepts. The indicator combines trend analysis, momentum confirmation, and market condition filtering to provide visual trading signals directly on the chart. Main Features Triple-confirmation signal system EMA trend filtering RSI momentum analysis Stochast
"Manual channel drawing? Not anymore. Let the market structure reveal itself automatically." "Track long-term price zones 24/7, in real-time." Real Trader Pain Points Identifying pivot points manually takes   huge time   and   effort Difficult to adapt to   high volatility   and pinpoint   reliable channels Copy Ideas "Markets never sleep. Why should your analysis stop?" "Dozens of assets a day—how do you keep up?" Core Claim AutoChannels   automatically reads market structure , reducin
Triple Crox Strategy
issam rahhal sabour
Triple Crox Strategy v4.10 Triple Crox Strategy v4.10 专业MT5指标 | 13形态 | 斐波那契 | CLUSTER ML | 13过滤 概述 专业MT5指标,融合 13种形态检测 、 斐波那契分析 、 CLUSTER机器学习 及 13种多重过滤 ,多层验证降低虚假信号。 交易设置 改良 Heikin-Ashi :绿=上升,红=下降。信号确认显示 买入 / 卖出 箭头,附带 Entry 入场、 TP1/TP2/TP3 止盈、 SL 止损水平线。13种过滤可选。 视觉组件 箭头: 绿买/红卖+Entry/TP/SL线 EMA云(3层): EMA(8/21/50),绿云=上升,红云=下降 趋势带: 绿色=上升,品红=下降 DEMA-ATR线: 绿线=上升,红线=下降 斐波那契: 回撤/扩展水平,黄金区高亮 形态+突破区: 轮廓标注+突破箭头 仪表板: 5主题4位置实时统计 风险管理 ATR止损: 倍数自适应波动环境 移动止损: 自动跟踪锁定利润 利润因子: 风险回报≥1:2才发信号 止损因子: ATR倍数1.0x
TraderHUD
Justino Porto Neto
5 (1)
TraderHUD v2 — 专业交易者的完整面板 TraderHUD v2 是 MetaTrader 5 最完整可视化指标的进化版本。它将交易者在图表上需要看到的所有信息整合到一个工具中,以做出更明智的决策:时间背景、美元强度、统计区间、枢轴点位、运动速度和宏观趋势——全部集成、可配置且不会使图表显得杂乱。 此版本基于实盘交易的实际使用经验构建,遵循明确的理念: 更多背景,更少噪音 。 v2 新增功能 将 8 个模块完全整合到单一指标中 可配置的侧边面板,DayRange 和 DollarFlow 自动衔接 市场时段标记与整点时间一起显示 经典枢轴点,可选择在各水平之间显示均线 两个标记为测试版的实验性模块:波动率和宏观趋势均线 完全可配置的布局——角落位置、宽度、颜色和字体 模块 计时器与点差 当前K线的倒计时,每500毫秒更新一次,不依赖于tick 计时器旁边显示实时点差 可配置的分隔符——计时器默认为"t",点差默认为"s" 智能锚定:当价格接近底部边缘时,文本会自动上移 整点时间与市场时段 垂直线指示下一个整点时间——新资金可能进入的时刻 带有时间和开盘时段名称的标
XCalper TFO
Aecio de Feo Flora Neto
This oscillator was developed exclusively by xCalper in 2015 based on moving averages calculations to indicate and try predicting oversold and overbought levels. The fast line (white, by default) oscillates basically between values -0.5 (oversold) and +0.5 (overbought). Whenever this line crosses upward value -0.5, it means an oversold price level. When it crosses downward value +0.5, it means an overbought price level. When fast line crosses value 0.0 and returns, it is a strong pull-back indic
Pan PrizMA CD Phase
Aleksey Panfilov
The Expert Advisor and the video are attached in the Discussion tab . The robot applies only one order and strictly follows the signals to evaluate the indicator efficiency. Pan PrizMA CD Phase is an option based on the Pan PrizMA indicator. Details (in Russian). Averaging by a quadric-quartic polynomial increases the smoothness of lines, adds momentum and rhythm. Extrapolation by the sinusoid function near a constant allows adjusting the delay or lead of signals. The value of the phase - wave s
Классификатор силы тренда. Показания на истории не меняет. Изменяется классификация только незакрытого бара. По идее подобен полной системе ASCTrend, сигнальный модуль которой, точнее его аппроксимация в несколько "урезанном" виде, есть в свободном доступе, а также в терминале как сигнальный индикатор SilverTrend . Точной копией системы ASCTrend не является. Работает на всех инструментах и всех временных диапазонах. Индикатор использует несколько некоррелируемых между собой алгоритмов для класси
作者的更多信息
还在为这些问题困扰吗? • 不会自己分析行情,多空方向总是判断错误? • 四处找老师、看小道消息,却依然交易迷茫? • 面对复杂走势,总是错过机会或是被频繁止损? 我懂你的所有困惑。基于我十余年的实战交易与系统学习经验,我开发了这款【趋势分析指标】,帮你告别猜测,实现自主交易! 你是否也经历过这些? 看着多个时间周期图表,眼花缭乱,不知从何判断 在震荡行情中频繁交易,不断被止损出局 总是错过最佳入场时机,等发现时行情已经走完 分不清当前是趋势行情还是震荡整理 我们的指标,正是为你而来—— 多时间框架统一显示,一目了然 图表左上角清晰展示: → D1、H4 → 判断大方向 → H1、M15 → 捕捉交易机会 → M5、M1 → 精准定位入场时机 不再反复切换图表,一眼掌握全局趋势! 明确的趋势判断,告别主观臆测 红色“多头” → 价格位于MA上方 绿色“空头” → 价格位于MA下方 标准统一,识别趋势更简单、更直观! 精准入场信号,不错过每一次机会
筛选:
无评论
回复评论