Trend Risk Analyzer MT4

Trend Risk Analyzer intelligently identifies trends, impulses, and corrections, calculating optimal trade volumes and safe levels for stop-loss and take-profit. Increase your accuracy, reduce risks, and boost your trading profits!

This product is also available for MetaTrader 5 => https://www.mql5.com/en/market/product/134799

The key feature of Trend Risk Analyzer is its capability to calculate the average range of each market element, enabling traders to set justified stop-loss and take-profit levels. Additionally, it dynamically adjusts trading volume based on current volatility, significantly enhancing your risk management efficiency.

Benefits:

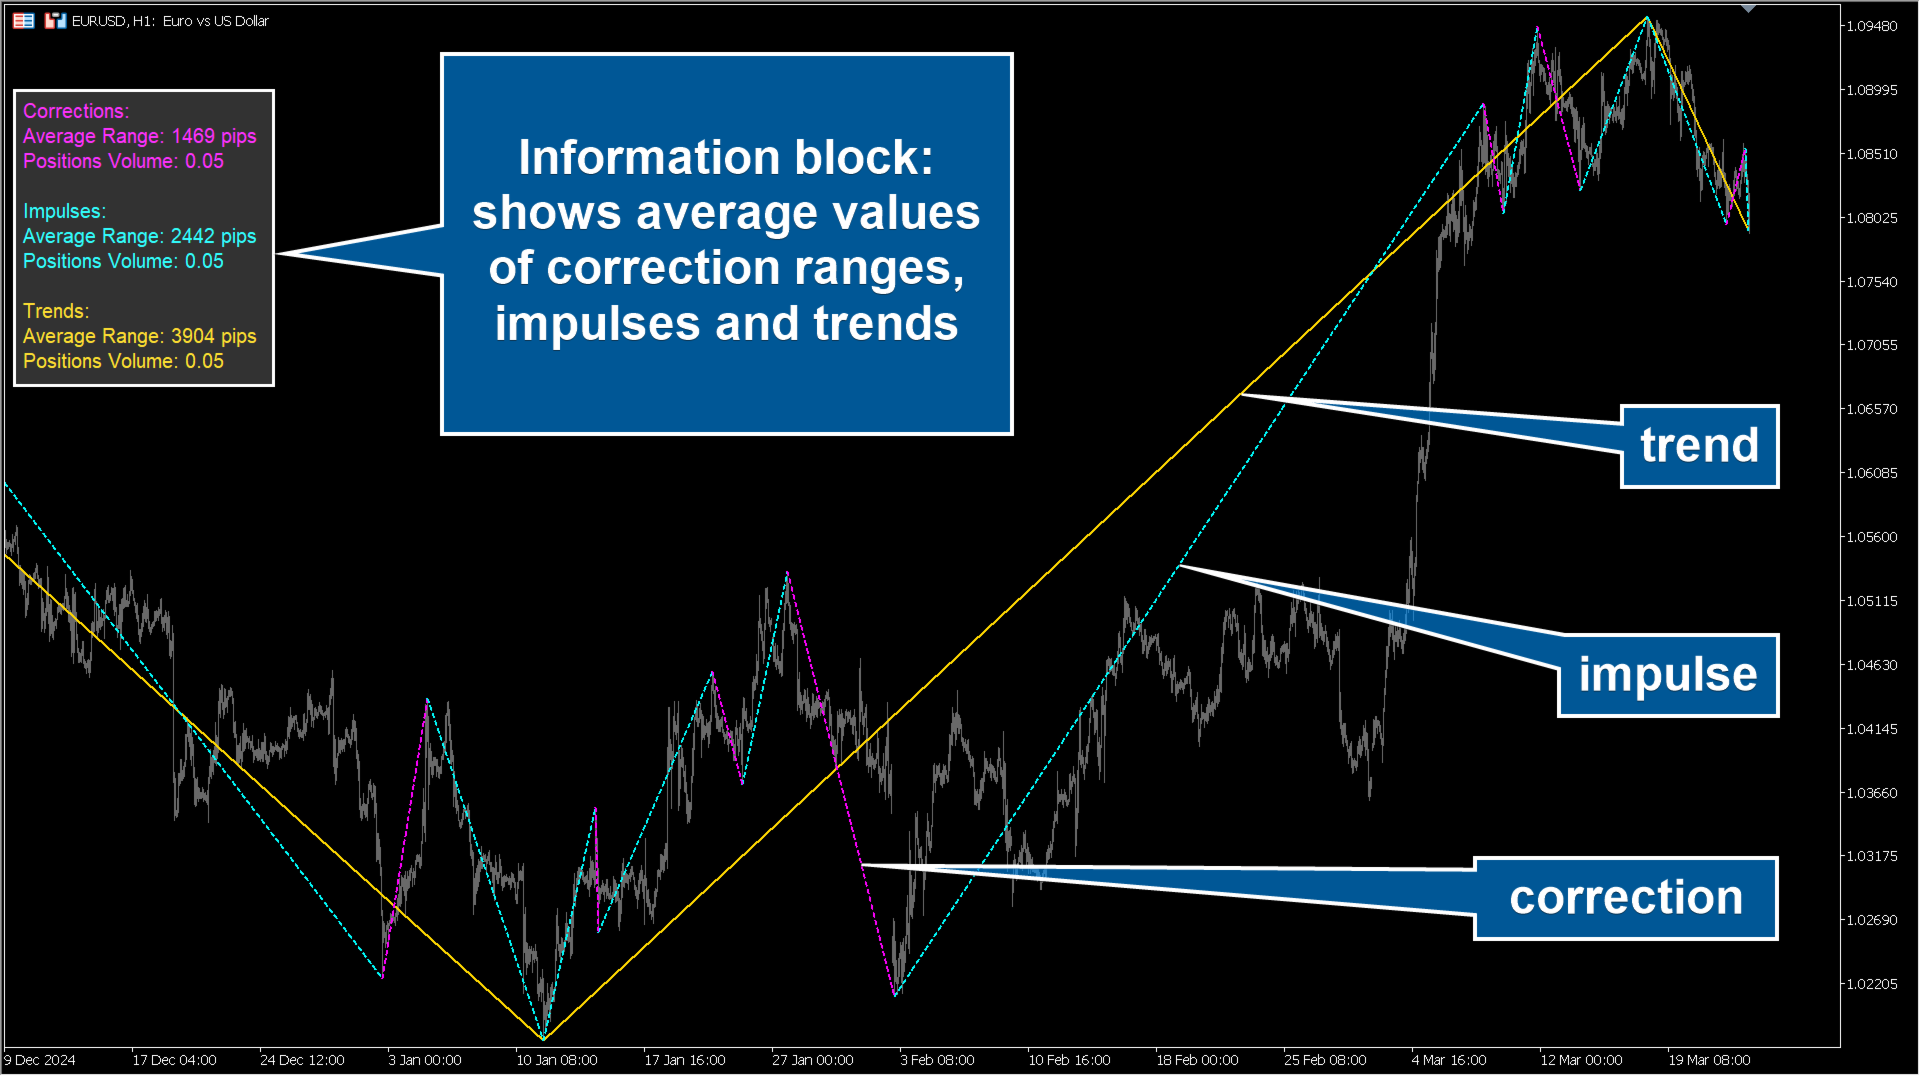
  • Automatically identifies trends (gold lines), impulses (aqua lines), and corrections (magenta lines)
  • Calculates average range values for each type of market movement
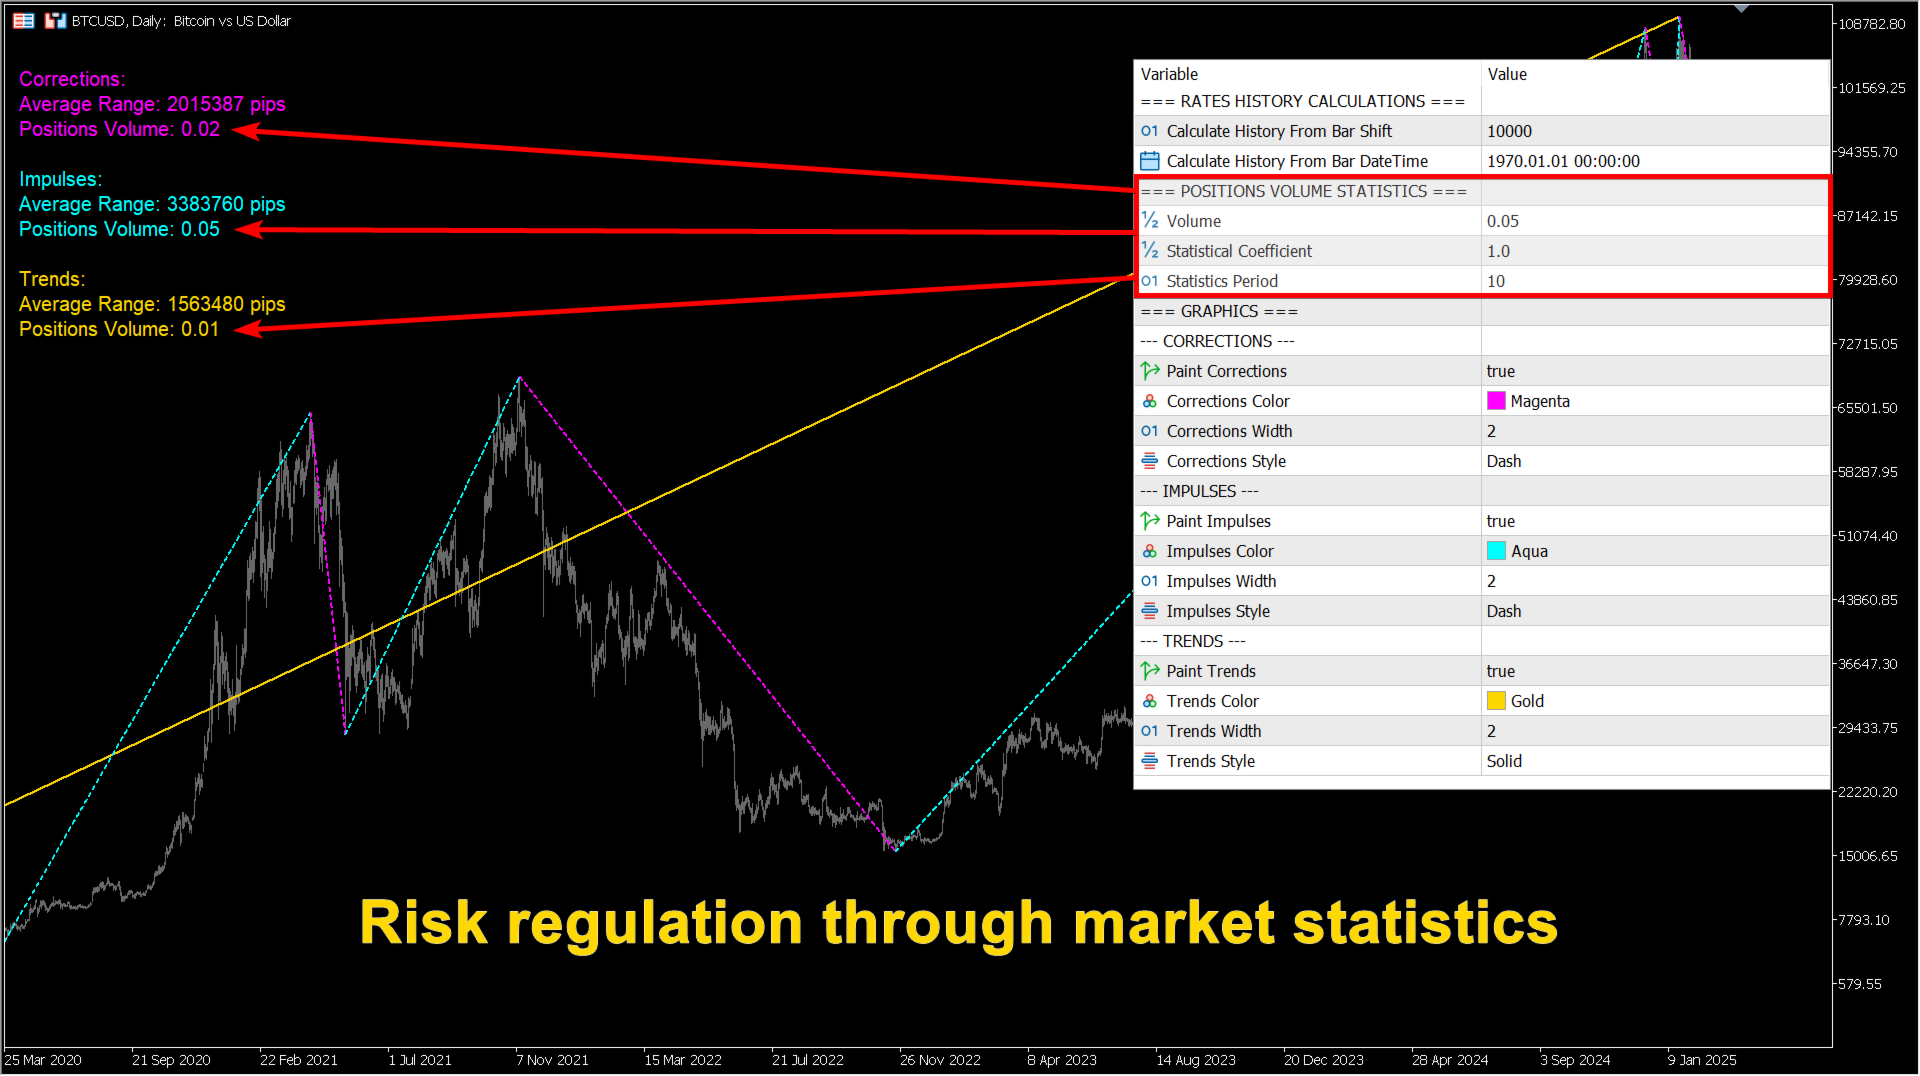
  • Adjusts optimal trade volumes dynamically based on real-time market volatility
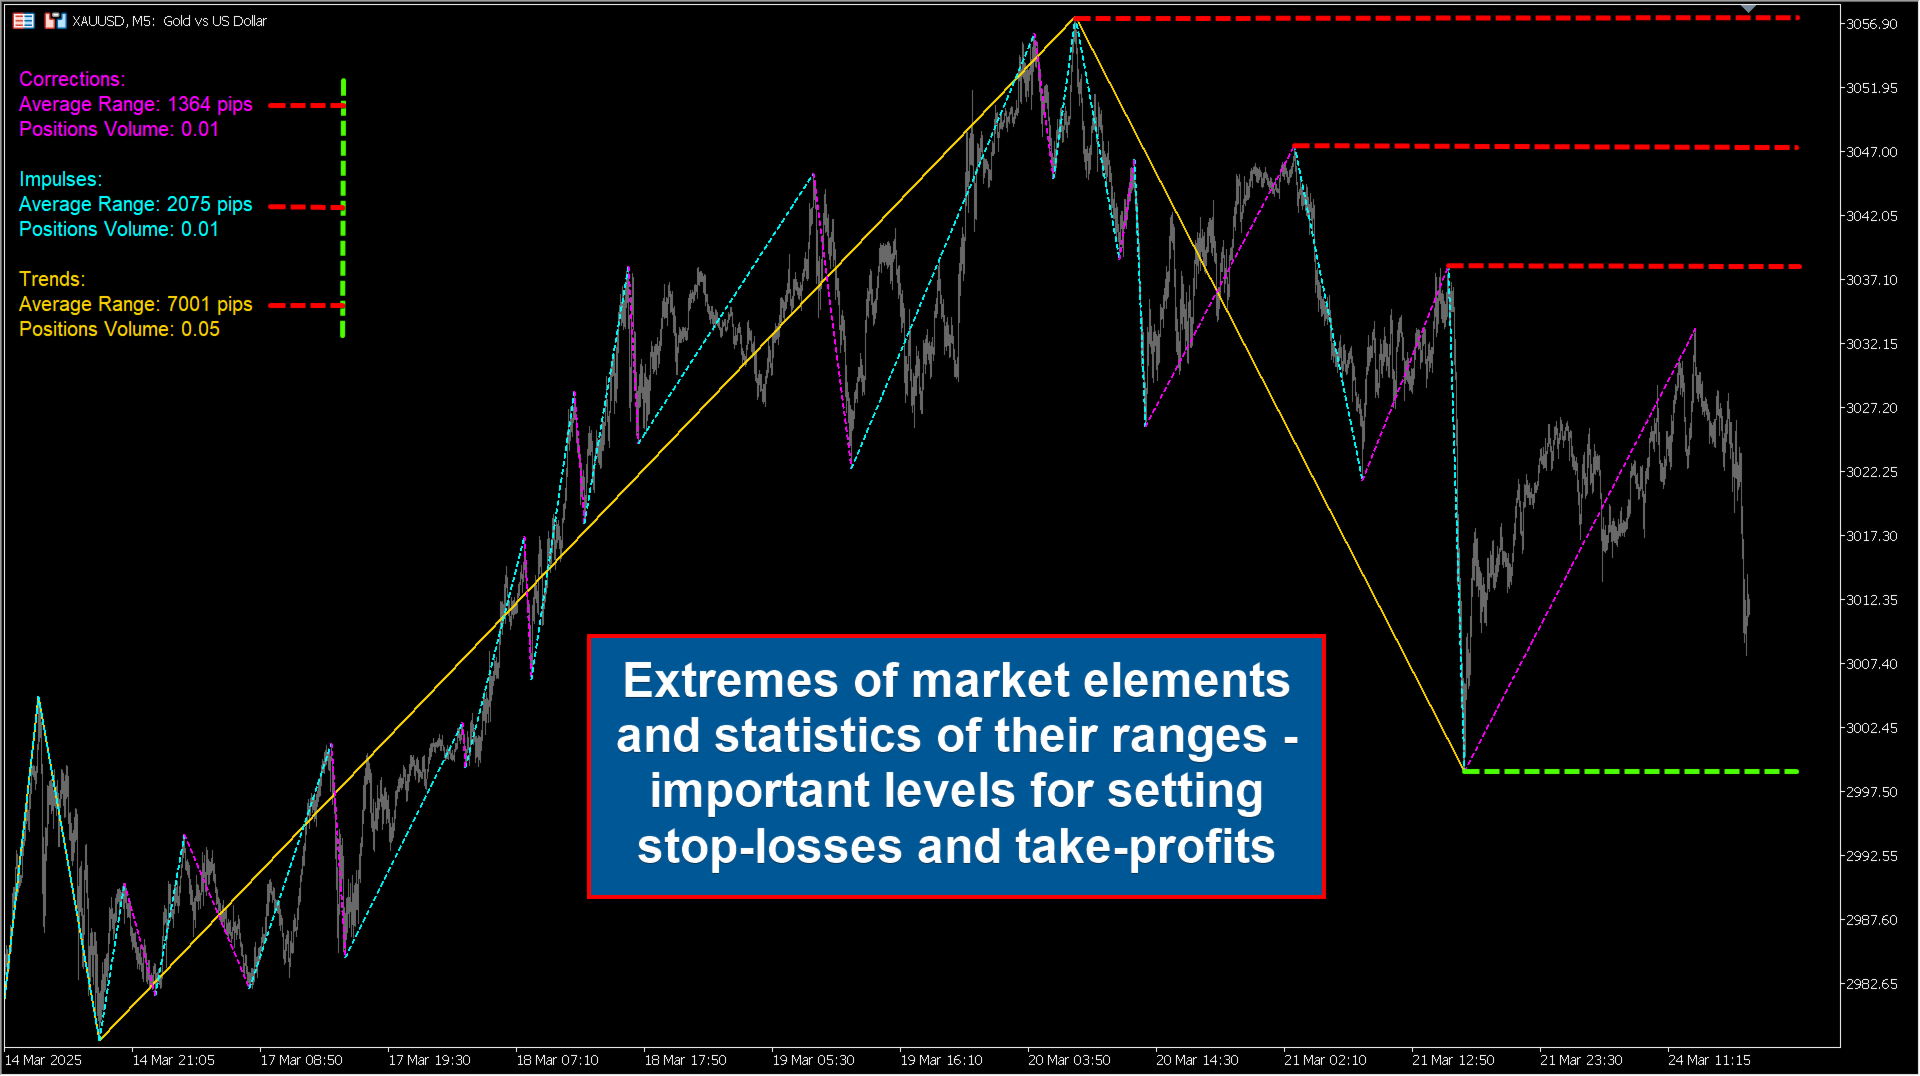
  • Provides clear visual guidance for setting effective stop-loss and take-profit levels

Use cases:

  • Open positions with volumes precisely adjusted to current market risk
  • Set logical take-profit and stop-loss levels backed by statistical market analysis
  • Enhance risk management capabilities for both beginners and seasoned traders

Perfectly suitable for all traders seeking consistent trading results!

Input Parameters:

=== RATES HISTORY CALCULATIONS === Settings for historical bar calculations.
Calculate History From Bar Shift Bar shift number from the current bar, from which historical calculations start.
Calculate History From Bar DateTime Date and time of the bar from which historical calculations begin.
=== POSITIONS VOLUME STATISTICS === Positions Volume Statistics settings.
Volume Standard position volume for calculations.
Statistical Coefficient Coefficient for adjusting position volumes according to market risk.
Statistics Period Number of elements used to calculate average ranges.
=== GRAPHICS === Graphics settings.
--- CORRECTIONS --- Settings for corrections graphics.
Paint Corrections Enable or disable the drawing of correction lines on the chart.
Corrections Color Color of correction lines.
Corrections Width Width of correction lines.
Corrections Style Style of correction lines (solid, dashed, etc.).
--- IMPULSES --- Settings for impulses graphics.
Paint Impulses Enable or disable the drawing of impulse lines on the chart.
Impulses Color Color of impulse lines.
Impulses Width Width of impulse lines.
Impulses Style Style of impulse lines (solid, dashed, etc.).
--- TRENDS --- Settings for trends graphics.
Paint Trends Enable or disable the drawing of trend lines on the chart.
Trends Color Primary color of trend lines.
Trends Width Width of trend lines.
Trends Style Style of trend lines (solid, dashed, etc.).
推荐产品
Auto Fibo Pro m
DMITRII GRIDASOV
“Auto FIBO Pro” Crypto_Forex 指标 - 是交易中的绝佳辅助工具! - 指标自动计算并放置在图表斐波那契水平和局部趋势线(红色)上。 - 斐波那契水平指示价格可能反转的关键区域。 - 最重要的水平是 23.6%、38.2%、50% 和 61.8%。 - 您可以将其用于反转剥头皮或区域网格交易。 - 还有很多机会可以使用 Auto FIBO Pro 指标来改进您当前的系统。 - 它具有信息价差掉期显示 - 它显示所连接的外汇对的当前价差和掉期。 - 显示屏还显示账户余额、净值和保证金。 - 可以将信息价差掉期显示定位在图表的任何角落: 0 - 左上角,1 - 右上角,2 - 左下角,3 - 右下角。 点击这里查看高质量的交易机器人和指标! 这是仅在此 MQL5 网站上提供的原创产品。
Forex Gump
Andrey Kozak
2.4 (5)
Forex Gump is a fully finished semi-automatic trading system. In the form of arrows, signals are displayed on the screen for opening and closing deals. All you need is to follow the instructions of the indicator. When the indicator shows a blue arrow, you need to open a buy order. When the indicator shows a red arrow, you need to open a sell order. Close orders when the indicator draws a yellow cross. In order to get the most effective result, we recommend using the timeframes H1, H4, D1. There
Owl smart levels
Sergey Ermolov
4.24 (37)
MT5版本  |  FAQ Owl Smart Levels Indicator   是一個完整的交易系統,包含   Bill Williams   的高級分形、構建正確的市場波浪結構的 Valable ZigZag 以及標記準確入場水平的斐波那契水平等流行的市場分析工具 進入市場和地方獲利。 策略的详细说明 指示灯使用说明 顾问-贸易猫头鹰助手助理 私人用户聊天 ->购买后写信给我,我会将您添加到私人聊天中,您可以在那里下载所有奖金 力量在於簡單! Owl Smart Levels   交易系統非常易於使用,因此適合專業人士和剛開始研究市場並為自己選擇交易策略的人。 策略和指標中沒有隱藏的秘密公式和計算方法,所有策略指標都是公開的。 Owl Smart Levels 允許您快速查看進入交易的信號,突出顯示下訂單的水平並向您發送有關已出現信號的通知。 優點很明顯: 清楚地顯示主要和更高時間框架的趨勢方向。 指示儀器信號的出現。 標記開單、止損設置和固定利潤的水平。 沒有多餘的,只有必要的結構! ZigZag   表示全球趨勢的方向,因此也表示貿易方向。 市場反轉點的短線清楚地表明在什
这是一个预测蜡烛收盘价的指标。 该指标主要用于 D1 图表。 该指标适用于传统外汇交易和二元期权交易。 该指标可以用作独立的交易系统,也可以作为您现有交易系统的补充。 该指标分析当前蜡烛,计算蜡烛本身内部的某些强度因素,以及前一根蜡烛的参数。 因此,该指标预测市场走势的进一步方向和当前蜡烛的收盘价。 由于这种方法,该指标既适用于短期盘中交易,也适用于中长期交易。 该指标允许您设置指标在分析市场情况期间将产生的潜在信号的数量。 在指标设置中有一个特殊的参数。 此外,该指标可以通过图表上的消息、电子邮件以及推送通知的形式通知新信号。感谢您的关注!交易愉快! 购买后一定要写信给我! 我会给你我的交易指标的建议! 还可以获得奖金!
GMMA Trade X is an EA based on GMMA. GMMA parameters such as MovingAveragePeriod1-24, MovingAverageMAShift1-24, MovingAverageShift1-24 and CandlestickShift1-24 can be adjusted. GMMA Trade X applies BTN TECHNOLOGY's state-of-the-art intelligent technology to help you create optimal results for your trades. May your dreams come true through GMMA Trade X. Good luck. = == == Inquiries = == == E-Mail:support@btntechfx.com
Project Infinity
Sergey Yarmish
The Infinity Expert Advisor is a scalper. When the resistance and support levels are broken, trades are opened in the direction of the price movement. Open positions are managed by several algorithms based on the current market situation (fixed stop loss and take profit, trailing stop, holding positions in case of trend indication, etc.). Requirements for the broker The EA is sensitive to spread, slippages and execution quality. It is strongly recommended not to use the EA for currencies with s
Trend Oscillator mw
DMITRII GRIDASOV
趋势振荡器 - 是一种高级自定义 Crypto_Forex 指标,高效的交易工具! - 使用高级新计算方法 - 参数“计算价格”有 20 个选项。 - 有史以来最平滑的振荡器。 - 绿色表示上升趋势,红色表示下降趋势。 - 超卖值:低于 5,超买值:超过 95。 - 使用此指标,有很多机会升级标准策略。 - 具有 PC 和移动警报。 ....................................................................................................................... 点击这里查看高质量的交易机器人和指标! 这是仅在此 MQL5 网站上提供的原创产品。
Noize Absorption Index MT4
Ekaterina Saltykova
5 (1)
Noize Absorption Index - is the manual trading system that measures the difference of pressure between bears forces and bulls forces. Green line - is a noize free index that showing curent situation. Zero value of index shows totally choppy/flat market.Values above zero level shows how powerfull bullish wave is and values below zero measures bearish forces.Up arrow appears on bearish market when it's ready to reverse, dn arrow appears on weak bullish market, as a result of reverse expectation. S
Crypto_Forex 指标“晨星模式”适用于 MT4。 - 指标“晨星模式”是价格行为交易的非常强大的指标:无需重绘,无延迟。 - 指标检测图表上的看涨晨星模式:图表上的蓝色箭头信号(见图片)。 - 带有 PC、手机和电子邮件警报。 - 还有它的兄弟 - 看跌“黄昏之星模式”指标可用(点击以下链接)。 - 指标“晨星模式”非常适合与支撑/阻力位结合使用。 ................................................................................................................. 点击这里查看高质量的交易机器人和指标! 这是仅在此 MQL5 网站上提供的原创产品。
Chart Patterns Detect 15 patterns (Ascending Triangle, Descending Triangle, Rising Wedge, Falling Wedge, Bullish Flag, Bearish Flag, Bullish Rectangle, Bearish Rectangle Symmetrical triangle, Head and Shoulders, Inverted Head and Shoulders, Triple top, Triple Bottom, Double Top, Double Bottom) Use historical data to calculate the probability of each pattern to succeed (possibility to filter notification according to the chance of success) gives graphic indication about the invalidation level and
VR Cub
Vladimir Pastushak
VR Cub 这是获得高质量切入点的指标。该指标的开发是为了促进数学计算并简化对仓位入场点的搜索。多年来,该指标所针对的交易策略已被证明其有效性。交易策略的简单性是其巨大的优势,即使是新手交易者也能成功进行交易。 VR Cub 计算开仓点以及获利和止损目标水平,这显着提高了效率和易用性。查看使用以下策略进行交易的屏幕截图,了解简单的交易规则。 设置、设置文件、演示版本、说明、问题解决,可以从以下位置获取 [博客] 您可以在以下位置阅读或撰写评论 [关联] 版本为 [MetaTrader 5] 计算入场点的规则 开仓 要计算入场点,您需要将 VR Cub 工具从最后一个高点拉伸到最后一个低点。 如果第一个点在时间上早于第二个点,交易者等待柱线收于中线上方。 如果第一个点在时间上晚于第二个点,交易者等待柱线收于中线下方。 根据上述条件,严格在 柱线收盘 后建仓。 换句话说,如果我们在小时图上进行交易,那么从最高点到最低点的时间距离必须超过24小时,最高点和最低点之间的点数必须大于或等于平均价格变动每天。 维持和改变市场地位 可以有多个未平仓头寸;每个头寸都可以单独修改。 VR Cub
ZhiBiCCI MT4
Qiuyang Zheng
【ZhiBiCCI】指标适合所有的周期使用,也适合所有的市场品种。 【ZhiBiCCI】绿色实线是逆转看涨背离。绿色虚线是经典的看涨背离。 【ZhiBiCCI】向红色实线是反向看跌背离。红色虚线是古典看跌背离。 【ZhiBiCCI】可以在参数里面设置(Alert、Send mail、Send notification),设置为(true)就可以发送即时信号到警报窗口、电子邮件、即时消息。 参数设置说明: 【displayAlert】:这是警报开关,设置成true,如果出现箭头就会自动警报提示;设置成false,则不会警报提示。 【sendmail_NO_OFF】:这是发送邮件的开关,设置成true,如果出现箭头就会发送邮件到你在MT4设置好的邮箱里面;设置成false,则不会发邮件。 【sendnotification_NO_OFF】:这是发送即时消息的开关,设置成true,如果出现箭头就会发送消息到你的移动设备;设置成false,则不会发消息。 更多好用的指标网址: https://www.mql5.com/en/users/zhengqiuyang/seller
The Th3Eng PipFinite indicator is based on a very excellent analysis of the right trend direction with perfect custom algorithms. It show the true direction and the best point to start trading. With StopLoss point and Three Take Profit points. Also it show the right pivot of the price and small points to order to replace the dynamic support and resistance channel, Which surrounds the price. And Finally it draws a very helpful Box on the left side on the chart includes (take profits and Stop loss
EZZ Zig Zag MT4
Paulo Rocha
5 (1)
EZZ Elite Zig Zag is an indicator for the MetaTrader 4 terminal. This indicator traces the peak of the trend based on the market reversal, thus showing various opportunities in the financial market. EZZ Elite Zig Zag is a visual tool, intuitive, and easy to understand and use.  Test it Yourself by Downloading it for Free. Author Paulo Rocha all rights reserved
斐波那契折返和扩展画线工具 适用于MT4平台的斐波那契折返和扩展画线工具,适合于使用黄金分割交易的交易者 优点:没有多余的线,没有过长的线,易于观察发现交易的机会 试用版: https://www.mql5.com/zh/market/product/35884 主要功能: 1.可以直接画出多组斐波那契折返,可以看出重要折返点之间的关系; 2.可以画出斐波那契扩展,比率有三种0.618,1,1.618 3.画出的斐波那契折返和扩展均可左右移动,有数值显示,方便观察 4.可通过数字键切换周期 使用指南和功能键: 1.按 [ 或R画折返,按需要画折返,最多云持8组折返; 2.按 ] 或E画扩展; 3.按 \ 删除当前周期下的所有扩展和折返,其余周期的不受影响 4.如何左右移动折返和扩展 (1)点击第一组折返的F5字符,可以左右移动折返; (2)点击COP的字符 ,可以左右移动扩展; 5. (1)点击第一组折返的F5字符,按del 可以删除这组折返; (2)点击COP的字符, 按del 可以删除这组扩展; 6.修改折返和扩展(随着市场的运行,焦点或者反弹点需要修改)
Koala Supply Demand
Ashkan Hazegh Nikrou
5 (2)
介绍 MetaTrader 4 的 Koala 供需指标(我们鼓励您分享您的评论或反馈 - 无论是正面的还是负面的 - 以便其他交易者可以从您的经验中受益。): 欢迎使用 Koala 供需指标。该指标设计用于识别不间断的供应和需求区域,有助于交易者将市场视为区域,您可以看到价格如何尊重一些强大的区域,该指标还可以在这些区域内形成价格行动信号时显示给您。 加入  Koala Trading Solution 频道  在 mql5 社区中获取有关所有 Koala 产品的最新消息,加入链接如下: https://www.mql5.com/en/channels/koalatradingsolution https://www.mql5.com/en/blogs/post/755700 重要提示 :此产品包含免费的专家顾问(EA)。购买后,请在MQL5 Messenger上与我联系,以获取与指标关联的免费EA。 重要提示: 从1.2版本开始,此指标是多时间框架供需指标,用户可以通过点击按钮在不同时间框架间切换。 主要特点: 图上回测功能:通过独特的图上回测功能体验分析的未来。只需单击图表
FREE
SimSim Arrow Momentum 是一個標準的「動量」指標,但採用箭頭版本。 MetaTrader 5 版本 指標參數與標準參數類似,另外也增加了一個參數 Delta。 Delta = 0 - 100 相對於 100 值的偏差。改變 100 指標的水平,可以加法或減量。 當價格穿過水平線 = 100 +- Delta 時,指標會產生訊號。 啟用「控制交易」進行操作,將自動開啟基於指標訊號的交易。 您可以將指標用作其預期用途,作為可靠的訊號設備。 然而,它的次要目的是作為“ CONTROL DEAL ”實用程式的信號提供者。 指標與該實用程式之間的共生關係不僅使您能夠看到訊號,而且還能根據它進行交易。 如果您想有效地使用這些訊號,請下載免費實用程式: SimSim Control Deal 。 「SimSim ARROW」系列指標的訊號以其明顯性和清晰度吸引了交易者,這使得它們比顧問更具吸引力。當箭頭出現時,指標的視覺清晰度就會顯現出來這是開啟交易的時刻!相反,當使用顧問時,事件通常以隱藏的方式展開,交易者並不總是清楚為什麼啟動特定操作,因為許多內容仍然隱藏在演算
Red Hawk EA
Profalgo Limited
4.18 (17)
NEW PROMO: Only a few copies copies available at 349$ Next price: 449$ Make sure to check out our " Ultimate EA combo package " in our   promo blog ! Red Hawk is a "mean reversion" trading system, that trades during the quiet times of the market. It runs on 9 pairs currently: EURUSD, GBPUSD, USDCHF, EURCHF, EURGBP, AUCAD, AUDJPY, EURAUD and USDCAD. Recommended timeframe: M5 Since this kind of strategy works best with low spread and fast execution, I advise using an good ECN broker. IMPORTANT F
我们为您提供一个指标"蜡烛收盘台",它将成为您在贸易领域不可或缺的助手。 这就是为什么知道蜡烛何时关闭会有所帮助的原因: 如果你喜欢使用蜡烛花纹进行交易,你就会知道蜡烛何时关闭。 此指标将允许您检查是否形成了已知模式以及是否存在交易的可能性。 该指标将帮助您做好市场开放和市场关闭的准备。 可以设置一个计时器来创建计划新闻的预览,这样就可以检查市场对此的反应。 您可以设置指示灯,以便在蜡烛关闭前几秒钟发送警报/警告。 通知/警报/警报可以发送到: 屏幕警报 电子邮件 移动应用 MT4烛台计时器指示器为什么有用 那么烛台计时器什么时候有用呢?如果你长期交易,你可能不需要蜡烛计时器指示器,因为你的参赛不会受到一分钟或一小时的太大影响。但是,如果你在短时间内是黄牛或交易员,那么你知道时机非常重要。 外汇市场24小时开放,只在周末关门,有些策略可能会受到您入仓时出现错误时机的严重影响。 MT4蜡烛计时器指示器可以显示当前蜡烛中的剩余时间,以便为下一次蜡烛打开做好准备。 可以从这一指标中受益的一些情况例子有: 预定消息传出 地理市场开闭 预定发生的事件,通常是金融、经济或政治事件
Stepping Trend
Mpendulo Chiliza
The Stepping Trend Indicator     The Steppi ng Trend indicator uses the  average true range  (ATR indicator) in its calculation. This gives you control to set your own average true range period, I set the Default as 10.   Indicator Details. Green Arrow Up: This means you are at the starting point of a new bullish trend, it’s time to buy.   Red  Arrow  Down : This means you are at the starting point of a new  bearish  trend, it’ s time to sell .   What if you miss the Arrow Signal?   No prob
Trade with Gann on your side!! MASTER CIRCLE 360 CIRCLE CHART, originally created by Gann admitted that this is “The Mother of all charts”. It is one of the last studies that this great trader left for us. The numeric tab le is apparently quite simple like all the tables and is based on square numbers, the SQUARE OF 12 and is by evolution, one of the most important square numbers. Here we can find CYCLE, PRICE AND TIME thanks to angles and grades, to show past and future support and resistance.
Alpha Trend sign Alpha Trend sign 是我么长期以来非常受欢迎的交易工具,它可以验证我们的交易系统,并且明确的提示交易信号,并且信号不会漂移。 主要功能: •  根据市场显示活跃区域,根据指标可以很直观的判断当前行情是属于趋势行情,还是震荡行情。    并根据指标的指示箭头切入市场,绿色箭头提示买入,红色箭头提示卖出。 •  建议使用5分钟以上的时间周期进行交易,避免因为小周期波动出现频繁的交易信号。 •  您也可以开启信号提示,以免错过最佳的交易时机。 •  本指标不但可以很好的预测趋势行情,也可以在宽幅震荡行情中获利。 •  本指标本着大道至简的原则,适合不同阶段的交易者使用。 注意事项: •  Alpha Trend sign 有明确的进出场信号,不建议逆势操作,以免造成损失。 •  Alpha Trend sign 是特别成熟的指标,我们团队人手一个,使用它可以实现稳定盈利。     
Super Reversal Pattern
Parfait Mujinga Ndalika
Super Reversal Pattern Indicator Unlock the power of advanced pattern recognition with our Super Reversal Pattern Indicator. Designed for traders seeking precision and reliability, this indicator identifies one of the most effective reversal patterns in technical analysis, offering a significant edge in your trading strategy. Key Features: Non-Repainting Accuracy: Enjoy the confidence of non-repainting technology. Once a Super Reversal Pattern is detected, it remains static, providing consiste
Gold Titan King Scalper
Dodong Christian Arnon
Indicator Description GOLD TITAN KING SIGNAL INDICATOR High-Precision Gold Scalping Buy/Sell Signals – Manual Trading Assistant Overview The Gold Titan King Signal Indicator is a manual trading assistant tool designed for high-frequency scalping on Gold (XAUUSD) and other major pairs. It generates clear BUY/SELL signals with precise entry levels, along with adjustable Stop Loss and Take Profit levels displayed directly on the chart. ️ This tool is NOT an EA. It does not execute trades
PipFinite Trend PRO
Karlo Wilson Vendiola
4.88 (2248)
Breakthrough Solution For Trend Trading And Filtering With All Important Features Built Inside One Tool! Trend PRO's smart algorithm detects the trend, filters out market noise and gives entry signals with exit levels. The new features with enhanced rules for statistical calculation improved the overall performance of this indicator. Important Information Revealed Maximize the potential of Trend Pro, please visit www.mql5.com/en/blogs/post/713938 The Powerful Expert Advisor Version Automatin
"Impulses and Corrections 4" is created to help traders navigate the market situation. The indicator shows multi-time frame upward and downward "Impulses" of price movements. These impulses are the basis for determining the "Base" , which is composed of zones of "Corrections" of price movements, as well as "Potential" zones for possible scenarios of price movement. Up and down impulses are determined based on a modified formula of Bill Williams' "Fractals" indicator. The last impulse is always
| Fully-automated Smart Money Concept (ICT) inspired trading solution with multi-strategy capabilities | Built by a grid trader >> for grid traders.  This is MT4 version, click  here  for  Blue CARA MT5  (settings and logics are same in both versions)     Real monitoring signal  -->  Cara Gold Intro Blue CARA EA   ('CARA') - short for  C omprehensive  A lgorithmic R esponsive A dvisor is a next-gen  multi-currency    multi-timeframe  EA base on the widely known (and perhapse most popular) Inn
Advanced Trend Regime
Shellard Securities (Pty) Ltd
The indicator has been designed to function on any time-frame and any pair.   This regime filter will help the trader better evaluate whether the current market is trending, and in which direction. It quickly reacts to changes in market dynamics using a series of advanced calculations. The user is able to select whether the calculation remains standard, or if a further filter constraint is added to the calculation.   A Yellow moving average of the signal has been included for the trader to smoot
PABT Pattern Indicator - it's classical system one of the signal patterns. Indicator logic - the Hi & Lo of the bar is fully within the range of the preceding bar, look to trade them as pullback in trend. In the way if indicator found PABT pattern it's drawing two lines and arrow what showing trend way.  - First line - it's entry point and drawing at: 1. On the high of signal bar or on middle of the signal bar (depending from indicator mode) for buy; 2. On the low of signal bar or on middle of t
Smart Funded Hft
Barbaros Bulent Kortarla
4.82 (65)
解锁您的交易潜力,使用智能资金化HFT EA! 无需VPS/无需设置文件/享受即插即用/请查看下方的简易设置视频 限时促销价格 我很兴奋地分享我的交易秘密——智能资金化EA。我已经用完美的成功率征服了数百个挑战,现在轮到您提升您的交易游戏了! 此EA旨在通过允许使用其服务的道具公司的HFT挑战。如果挑战不允许使用HFT/资金账户/实盘账户,请不要使用它。 智能资金化HFT EA的独特之处: 挑战掌控: 在几乎所有HFT挑战中经过验证的成功,确保了100%的成功率。它不仅仅是一个工具;它是一个经过验证的强大工具。 极致简约: 无需陷入复杂的设置或VPS设置。加载它,调整手数大小,然后点击运行按钮——极致简约。 为什么分享?时间宝贵,挑战可能真的令人头疼。由于我不能再承担更多的挑战,我想,为什么不分享财富呢?所以我们来到了这里。 独家限时租赁选项:限时抓住机会在MQL5市场以促销价格租赁智能资金化EA。在您的挑战中测试它,体验它的魔力。 购买它:准备承诺?购买智能资金化EA,将您的交易提升到新的水平。在成功的挑战后请留下真实的评论。 评论激励:对于买家,这里有一个特别的待遇。留下评论后,如
该产品的买家也购买
Meravith
Ivan Stefanov
5 (1)
该指标从每个点分析成交量,并计算该成交量的市场疲劳水平。 它由三条线组成: 牛市成交量疲劳线 熊市成交量疲劳线 表示市场趋势的线。该线根据市场是熊市还是牛市变化颜色。 您可以从任何选择的起点分析市场。一旦达到成交量疲劳线,确定一个新的起点来开始下一次分析。 您可以分析任何内容——趋势和修正。一个好的方法是每次当它达到趋势线或形成顶部或底部时移动指标。 趋势线与某一成交量疲劳线之间的距离越大,说明该方向的成交量越大。 趋势线可以作为开单的位置,而疲劳线则用于收集利润。 该系统非常独特,但又极其直观。 市场上没有类似的产品。 使用没有限制。可以在所有市场和所有时间框架中应用。 重要提示:在MetaTrader4测试器中检查时,双击紫色线条,然后左右移动它以分析市场。 如有任何问题,请随时联系我。
Scalper Inside PRO
Alexey Minkov
4.74 (69)
An exclusive indicator that utilizes an innovative algorithm to swiftly and accurately determine the market trend. The indicator automatically calculates opening, closing, and profit levels, providing detailed trading statistics. With these features, you can choose the most appropriate trading instrument for the current market conditions. Additionally, you can easily integrate your own arrow indicators into Scalper Inside Pro to quickly evaluate their statistics and profitability. Scalper Inside
目前八折优惠! 对任何新手或专家交易者来说都是最好的解决方案! 这个仪表板软件适用于28种货币对。它基于我们的两个主要指标(高级货币强度28和高级货币冲动)。它对整个外汇市场提供了一个伟大的概述。它显示高级货币强度值,货币运动速度和28个外汇对在所有(9)时间段的信号。想象一下,当你可以使用图表上的单一指标观察整个市场,以确定趋势和或剥头皮的机会时,你的交易将得到改善 我们已经在这个指标中建立了一些功能,使你更容易识别强势和弱势货币,同时识别和确认潜在的交易。该指标以图形方式显示货币的强势或弱势是增加还是减少,以及它在所有时间段的表现。 增加的新功能是动态市场斐波那契水平,它适应当前的市场条件变化,这是一个已经在我们的高级货币强度28和高级货币冲动指标中使用的成熟的加分项。 在交易时,总是将弱势货币和强势货币配对,这个新指标将帮助你做到这一点。 用户手册:点击这里  https://www.mql5.com/en/blogs/post/708783 特点  显示每个时间段的ACS28和GAP-speed(冲动)的货币强度值。 列:颜色代码以7种颜色显示货币强度:强势
Currency Strength Exotics
Bernhard Schweigert
4.88 (33)
目前8折优惠! 对任何新手或专家交易者来说都是最好的解决方案! 这个指标是专门用来显示任何符号的货币强度,如异国货币对、商品、指数或期货。它是同类产品中的第一个,任何符号都可以添加到第9行,以显示黄金、白银、石油、DAX、US30、MXN、TRY、CNH等的真实货币强度。这是一个独特的、高质量的、负担得起的交易工具,因为我们已经纳入了一些专有的功能和一个新的公式。想象一下,你的交易将如何改善,因为你能够准确地确定新趋势或剥头皮机会的触发点? 用户手册:点击这里   https://www.mql5.com/en/blogs/post/708876 它适用于所有时间框架。你将很快能够看到TREND! 根据新的基础算法设计,它使识别和确认潜在交易变得更加容易。这是因为它以图形方式显示了8种主要货币和一种符号的强弱。 该指标显示了8种主要货币(澳元加元瑞士法郎欧元英镑日元新西兰美元)的强弱线,再加上一个符号! 该指标显示了符号的真实价值。例如:对于XAUUSD(黄金):价格以美元报价。如果黄金在上涨,你怎么能知道是黄金的强势还是美元的弱势?只有当黄金走强时,我们才会进行交易。该指
本指标是实践实战交易完善的波浪自动分析的指标 !  案例... 注: 波浪分级用西方叫法不习惯,因受到缠论(缠中说禅)命名方式习惯的影响,我是将基础波浪命名为 笔 ,将二级波段命名为 段 ,同时具有趋势方向的段命名为 主趋段 (以后笔记中都是这种命名方式,先告知大家),但是算法上和缠论关系不大切勿混淆.反映的是本人分析盘面总结的 千变万化纷繁复杂的运行规律 . 对波段进行了标准化定义,不再是不同人不同的浪  ,   对人为干扰的画法进行了排除,在严格分析进场起到了关键的作用 . 使用这个指标,等于将交易界面提升美感,抛弃最原始的K线交易带你进入新的交易层次.如果不是为了交易,在宣传上也将使客户观感提升层次. 指标内容: 1. 基础波浪 (笔) : 首先我们找出了价格波动过程中的基础波动拐点,当然他的有序性低,为下一步的计算提供基础. 2. 二级波段( 段 ) :在基础波浪的基础上,通过算法分析得到层级更明显的二级波段,二级波段为波浪提供了分析基础 3. 波浪( 浪 ): 有着更清晰的趋势,更清晰直观的方向.分析一个波浪是否延续,需要看二级波段的形态,分析二级的构成,可以得出波浪后
Looking for a powerful yet lightweight swing detector that accurately identifies market structure turning points? Want clear, reliable buy and sell signals that work across any timeframe and any instrument? Buy Sell Arrow MT Swing is built exactly for that — precision swing detection made simple and effective. This indicator identifies Higher Highs (HH) , Higher Lows (HL) , Lower Highs (LH) , and Lower Lows (LL) with remarkable clarity. It is designed to help traders easily visualize market str
Dynamic Forex28 Navigator
Bernhard Schweigert
4.43 (7)
Dynamic Forex28 Navigator - 下一代外汇交易工具。 当前 49% 折扣。 Dynamic Forex28 Navigator 是我们长期流行的指标的演变,将三种功能合二为一: 高级货币强度 28 指标 (695 条评论)+ 高级货币 IMPULSE 带警报 (520 条评论)+ CS28 组合信号(奖励)。 有关指标的详细信息 https://www.mql5.com/en/blogs/post/758844 下一代强度指标提供什么? 您喜欢的原始指标的一切,现在通过新功能和更高的精度进行了增强。 主要特点: 专有货币强度公式。  所有时间范围内的平滑和准确的强度线。 非常适合识别趋势和精确进入。 动态市场斐波那契水平(市场斐波那契)。  此指标独有的独特功能。 斐波那契应用于货币强度,而不是价格图表。 适应实时市场活动以获得准确的反转区域。 实时市场动量。  第 9 行显示市场是活跃还是被动。 对于定时交易至关重要。 全面的警报和显示。  每种货币最强的买入和卖出动量。 ​​28 对的双重动量买入和卖出。 超买/超卖警告外部范围和止损。 反转
ACB Breakout Arrows
KEENBASE SOFTWARE SOLUTIONS
4.15 (34)
ACB Breakout Arrows 指标通过识别一种特殊的突破形态,为交易者提供关键的入场信号。该指标持续扫描图表中某一方向上趋于稳定的动能,并在主要行情启动之前给出准确的进场信号。  点击此处获取多品种、多周期扫描仪 - ACB Breakout Arrows MT4 专用扫描仪 主要功能 指标自动提供止损和止盈位置。 配备 MTF 多周期扫描仪面板,可跟踪所有时间周期的突破信号。 适用于日内交易者、波段交易者和剥头皮交易者。 采用优化算法,提高信号准确性。 提供特殊目标线,用于设置快速平仓点或无损平移位(Quick Profit Line)。 包括胜率、成功率、平均收益等表现分析指标。 不重绘,信号一旦出现即保持不变。 交易确认 -  建议结合使用 ACB Trade Filter 指标 以过滤低质量信号。 强买入: 上箭头 + 绿色柱状图 + 多头趋势。 强卖出: 下箭头 + 红色柱状图 + 空头趋势。 避免交易 :当柱状图为灰色且趋势为震荡时。 (可选) -  建议使用 KT  支撑与阻力位指标  来避免在关键支撑/阻力区域附近开仓。此类交易可能迅速转为亏损,造成不必
Entry Points Pro
Yury Orlov
4.62 (172)
这是一款 MT4 的趋势指标,可提供准确的入场交易信号,且无重绘或延迟。 它可应用在任何金融资产:外汇、加密货币、贵金属、股票、指数。 最好的结果出现在 M15+ 的时间帧内。 指标的 MT5 版本 重要! 购买后请联系我,以便获取详细指南和奖励。 视频 (6:22) - 一个信号赢取的利润等于指标价格的三倍。 视频 (4:44) - 它如何在测试器中工作,我的提示和技巧。 视频 (1:44) - 有关它如何处理加密货币和指数的几句话。 大多数交易者在 Entry Points Pro 指标的帮助下,在第一个交易周内就改善了他们的交易结果。 Entry Points Pro 指标的益处 入场信号无重绘或延迟 如果信号出现,并得到确认(如果信号所在烛条已收盘),则它不会再消失;不像是重绘指标,它会导致重大的财产损失,因为它们可以在显示信号后再将其删除。 无差错开仓 指标算法可令您找到入场交易(买入或卖出资产)的理想时机,从而提高每位交易者的成功率。 Entry Points Pro 可操作任何资产 它允许您在 MT4 平台上交易任何经纪商提供的加密货币、股票、金属、指数、商品
Hidden Cycles
Lev Vladimirovic Marushkin
5 (1)
Black Friday Sale – Limited Time! Grab Hidden Cycles for only $129 (regular price $179 ). This is your chance to boost your strategy with a powerful, easy-to-use cycle-based trading tool. Offer ends soon — don’t miss it! Based on Universal Laws — NOT Some Guy’s Algorithm: Let the market adjust to the Hidden Cycles Geometry — not the other way around. Most indicators are based on a man-made formula. They often lag, fail over time, or need constant re-optimization.  Hidden Cycles is different.
Adaptive Volatility Range
Stanislav Konin
5 (3)
Adaptive Volatility Range [AVR] is a powerful tool for identifying key trend reversal points. AVR accurately reflects the Average True Range (ATR) of volatility, taking into account the Volume-Weighted Average Price (VWAP). The indicator adapts to any market volatility by calculating the average volatility over a specific period, ensuring a stable rate of profitable trades. You receive not just an indicator but a professional automated trading system , AVR-EA . Advantages: Automated Trading Sys
Royal Wave Pro M4
Vahidreza Heidar Gholami
5 (3)
Royal Wave is a Trend-Power oscillator which has been programmed to locate and signal low-risk entry and exit zones. Its core algorithm statistically analyzes the market and generates trading signals for overbought, oversold and low volatile areas. By using a well-designed alerting system, this indicator makes it easier to make proper decisions regarding where to enter and where to exit trades. Features Trend-Power Algorithm Low risk Entry Zones and Exit Zones Predictions for Overbought and Over
RelicusRoad Pro
Relicus LLC
4.63 (106)
您有多少次购买了一个交易指标,它拥有 出色的回测 、 实盘账户表现证明 以及惊人的数据和 无处不在的统计数据 ,但使用后您却 最终爆仓 ? 您不应该只相信一个信号本身,您需要知道它最初为何出现,而这正是 RelicusRoad Pro 最擅长的! 用户手册 + 策略 + 培训视频 + 带 VIP 权限的私人群组 + 提供移动版本 一种全新的市场视角 RelicusRoad 是外汇、期货、加密货币、股票和指数领域 全球最强大、最好的交易指标 ,为交易者提供 账户增长 所需的所有信息和工具。我们提供 技术分析 和 交易计划 ,帮助 每一位交易者成功 ,无论是 初学者 还是 高级交易者 。 它是一个 关键交易指标 ,提供足够的信息来 预测 未来市场。我们相信一个 完整的解决方案 ,而不是图表上几个毫无意义的不同指标。这是一个 一体化指标 ,显示 信号 、 箭头 + 价格行为 信息,这些信息 无与伦比 且 非常准确 。   RelicusRoad 利用机器学习(AI)技术,为交易者提供必要的信息和工具,帮助他们成为成功且消息灵通的交易者。   利用领先指标预测未来价格 几乎 所有技术指标
OrderFlow Absorption – 專業級MT4買賣差與吸收訊號指標 釋放真正訂單流分析的力量,OrderFlow Absorption 是MetaTrader 4上最強大的買賣差(Delta)直方圖與吸收訊號指標。專為想看清每一個價格波動背後真相的交易者設計,這個工具揭示了隱藏的買賣壓力與推動市場的吸收事件。 功能特色 買賣差直方圖視覺化:   以清晰的色彩直方圖即時顯示買方與賣方壓力。 吸收訊號偵測:   先進邏輯自動辨識多空吸收事件,及早預警潛在反轉。 圖表標記:   吸收訊號直接標示於主圖表,方便視覺辨識。 彈出式警報:   新吸收訊號出現時即時通知。 自訂門檻:   過濾弱訊號,專注高勝率機會。 資源管理:   高效運算,適用於大型圖表也能流暢運行。 全品種兼容:   適用於任何商品與週期,包括外匯、指數、商品等。 簡易整合:   參數簡單,快速上手與調整。 OrderFlow Absorption 的邏輯說明 OrderFlow Absorption 採用專利演算法,能在沒有完整Tick數據的情況下,估算每根K棒的買賣壓力(Delta)。它分析成交量、價格行為、K
Dynamic Scalper System
Vitalyi Belyh
5 (1)
“ Dynamic Scalper System ”指标专为在趋势波内进行剥头皮交易而设计。 已在主要货币对和黄金上进行测试,并可与其他交易工具兼容。 提供顺势短线建仓信号,并提供额外的价格变动支持。 指标原理: 大箭头决定趋势方向。 在趋势波内,我们采用一种生成小箭头形式的剥头皮交易信号的算法。 红色箭头代表看涨方向,蓝色箭头代表看跌方向。 敏感的价格变动线会沿着趋势方向绘制,并与小箭头信号协同作用。 信号运作方式如下:当线在适当时刻出现时,将形成入场信号;在出现线时,持仓;线完成后,平仓。 建议的操作时间范围为M1 - H4。 箭头在当前K线上方形成,如果下一根K线已开仓,则不会重新绘制上一根K线上方的箭头。 输入参数 Trend Wave Period - 趋势方向(大箭头)的周期,改变趋势波的时间间隔。值 1 表示趋势方向的最长持续时间,参数值越大,持续时间越短。 Scalper Arrows Period - 信号箭头(小箭头)的计算周期,改变入场信号的生成频率。值 3 表示最频繁的生成频率,参数值越大,箭头频率越低,准确度越高。 这些参数可以根据不同的时间范
PZ Swing Trading
PZ TRADING SLU
5 (3)
Swing Trading 是第一个旨在检测趋势方向的波动和可能的反转波动的指标。它使用在交易文献中广泛描述的基准摆动交易方法。该指标研究多个价格和时间向量,以追踪总体趋势方向,并检测市场超卖或超买并准备好进行修正的情况。 [ 安装指南 | 更新指南 | 故障排除 | 常见问题 | 所有产品 ] 市场波动的利润不会被窃取 指示器始终显示趋势方向 彩色价格带代表机会基准 彩色虚线表示可能的反转波动 该指标分析其自身的质量和性能 它实现了一个多时间仪表板 可定制的趋势和波动周期 它实现了电子邮件/声音/推送警报 指示器为非重涂或重涂 什么是摇摆交易 摇摆交易是一种尝试在一天到一周内从证券中获得收益的交易方式,尽管某些交易最终可以保持更长的寿命。摇摆交易者使用技术分析来买入弱点和卖出力量,并有耐心等待这些机会的发生,因为在发生一波抛售浪潮之后购买证券而不是陷入抛售更有意义。 机会基准 关于历史数据的大量研究证明,适合于波动交易的市场倾向于在基线价格带上下交易,基线价格带由图表显示,使用平均真实区间计算得出。波动交易者使用基线,该策略是购买常态和卖出躁狂,或做空常态并掩盖沮丧。在没有疲
The BB Reversal Arrows technical trading system has been developed to predict reverse points for making retail decisions. The current market situation is analyzed by the indicator and structured for several criteria: the expectation of reversal moments, potential turning points, purchase and sale signals. The indicator does not contain excess information, has a visual understandable interface, allowing traders to make reasonable decisions. All arrows appear to close the candle, without redrawin
Full Scalping Signal
Leandro Bernardez Camero
FullScalping 是一款 不重绘、不回绘 的指标,专为在任何市场中生成 持续不断的剥头皮入场信号 而设计。非常适合追求激烈行情的激进交易者! 加入频道,获取独家信息和更新: https://www.mql5.com/en/channels/forexnewadvisor 你会注意到它 几乎在每根K线 上都会给出信号,要么是确认趋势,要么是提示关键回调。就像一个全天候运行的雷达为你指引方向。 它是如何工作的?非常简单: 红色箭头 进场 做空 蓝色箭头 进场 做多 始终顺应整体趋势方向进行交易,积极获取 每单15到20点 的利润,并在市场剧烈反转之前迅速退出。 信号 持续不断 ,让你永远不会错过交易机会。目标是通过以下方式实现 高频剥头皮交易 : 大手数交易 低点差(显示在左下角) 宽止损,设在上一次趋势反转附近 你可以观看 实时交易视频 了解操作过程,但它使用起来非常简单,安装完成后即可上手。 它会重绘或回绘吗? 对于箭头类指标,大家最关心的问题之一就是它是否 重绘 或 回绘 。而对于 FullScalping 来说,答案非常明确: 此指标 不会重绘 这意味着
NAM Order Blocks
NAM TECH GROUP, CORP.
3.67 (3)
MT4多時限訂單塊檢測指示器。 特徵 -在圖表控制面板上完全可自定義,提供完整的交互。 -隨時隨地隱藏和顯示控制面板。 -在多個時間範圍內檢測OB。 -選擇要顯示的OB數量。 -不同的OB用戶界面。 -OB上的不同過濾器。 -OB接近警報。 -ADR高低線。 -通知服務(屏幕警報|推送通知)。 概括 訂單塊是一種市場行為,它指示從金融機構和銀行收取訂單。著名的金融機構和中央銀行帶動了外匯市場。因此,交易者必須知道他們在市場上正在做什麼。當市場建立訂單塊時,它會像發生大多數投資決策的範圍一樣移動。 訂單建立完成後,市場將朝著上升和縮小的方向發展。訂單大宗交易策略的關鍵術語是它包括機構交易者正在做的事情。由於它們是主要的價格驅動因素,因此包括機構交易在內的任何策略都可以。 您將在任何時間範圍內實時看到訂單塊,使用我們的控制面板,您將能夠在所選的歷史記錄週期內檢測常規,拒收和未大寫的訂單塊。 現在您可以接收到訂單塊接近警報,我們在MT4上顯示屏幕通知,並將通知推送到您的手機!
The Nihilist 5.0 Indicator includes Forexalien and Nihilist Easy Trend trading strategies and systems. It is composed of an MTF Dashboard where you can analyze the different input possibilities of each strategy at a glance. It has an alert system with different types of configurable filters. You can also configure which TF you want to be notified on your Metatrader 4 platform and Mobile application The indicator has the option to view how could be a TP and SL by using ATR or fixed points, even w
Introducing the Delta Volume Profile Indicator - Unleash the Power of Institutional Precision!  Technical Indicator: Are you ready to trade like the pros? The Delta Volume Profile Indicator is no ordinary tool. It’s a high-precision, cutting-edge indicator that puts the power of institutional-grade trading in your hands. This unique indicator analyses delta volume distribution in real-time, revealing the market's hidden buy/sell imbalances that the biggest financial institutions rely on to antic
Trend Lines PRO
Roman Podpora
5 (1)
趋势线专业版   这是一个专业的工具,可以 自动运行。     揭示真相   转折点   和   重入   主要参与者,并且还展示了更高时间框架的全球水平,这使其成为全面市场分析的必备工具。 得益于可靠的市场噪音过滤和精心设计的算法,信号保持稳定且不会重绘。这使得交易者能够对所接收数据的客观性和决策的正确性充满信心。 适用于寻求可靠趋势分析工具的初学者和经验丰富的交易者。 当与 RFI levels PRO 指标 结合使用时,该指标可发挥其最大潜力 。 该指标以 BOS 线的形式准确地显示了趋势和倾向的真实变化。 您可以立即看到市场真正发生转变的关键点——没有噪音和虚假信号。 它显示了 BOS 线路整个生命周期中的重入和补给区域。 所有点都标有数字——2、3、4等等。 这可以帮助你了解哪些大玩家正在回归并积蓄力量,以便你可以朝着他们的方向努力。 该指标不会重新绘制或重新计算信号——所有计算仅在K线收盘时执行。 图表上会显示水平线和信号,确保完全的可靠性和透明度。 优势 该指标通过BOS线显示真实的趋势变化,使您能够轻松区分重要的趋势反转和市场噪音。它使用三个信号强度级别:
介绍 ON Trade Waves Patterns Harmonic Elliot Wolfe,这是一款高级指标,旨在使用手动和自动方法检测各种市场模式。以下是它的工作原理: 谐波模式: 该指标可以识别出现在您图表上的谐波模式。这些模式对于练习谐波交易理论的交易者非常重要,正如Scott Carney的书《谐波交易第1卷和第2卷》所描述的那样。无论您是手动绘制它们还是依赖自动检测,ON Trade Waves Patterns都可以胜任。 控制面板: 我们配备了一个用户友好的控制面板,它会保存您的图表和时间帧设置,使您可以轻松切换不同配置。您甚至可以最小化它以最大化图表空间。如果您更喜欢使用其他分析工具,只需单击关闭按钮即可隐藏所有指标数据。 模板保存: 当您自定义设置或添加其他指标,如移动平均线或布林带时,该指标会自动保存您的模板。这意味着您可以随时轻松加载您喜欢的设置。 优化显示: 对于Windows 10用户,我们建议调整您的DPI设置以获得高清设备上的最佳屏幕体验。右键单击MetaTrader图标,选择“兼容性”,然后选择“更改高DPI设置”,将其设置为“系统(增强)”。
KT Trend Trading Suite MT4
KEENBASE SOFTWARE SOLUTIONS
KT Trend Trading Suite 是一款多功能指标,它结合了趋势跟随策略和多个突破点作为入场信号。 当新趋势形成后,该指标会提供多个入场机会,让交易者能够顺势而为。为了避免不重要的入场点,还引入了回调阈值的概念。 MT5版本可在此处获取  https://www.mql5.com/en/market/product/46270 功能特点 将多种市场动态纳入一个公式中,以清晰展现市场趋势。 绘制矩形框标记入场信号,并配合局部高点和低点进行定位。 指标会自动评估自身信号的准确性,并提供多个简明的性能指标。 内置多周期仪表盘,扫描所有可用时间周期,并显示每个周期内的趋势方向。 输入参数 History Bars:   用于分析历史信号的K线数量。  Signals Period:   整数值,决定入场信号的强度。 Pullback Depth:   整数值,决定趋势继续前常见的回调深度。 Trend Period:   整数值,用于判断主要趋势方向。 Show MTF Dashboard:   显示/隐藏多周期扫描仪表盘。 Performance Analysis:
The Super Arrow Indicator provides non-repainting buy and sell signals with exceptional accuracy. Key Features No repainting – confirmed signals remain fixed Clear visual arrows: green for buy, red for sell Real-time alerts via pop-up, sound, and optional email Clean chart view with no unnecessary clutter Works on all markets: Forex, gold, oil, indices, crypto Adjustable Parameters TimeFrame Default: "current time frame" Function: Sets the time frame for indicator calculation Options: Can be set
Beast Super Signal
Dustin Vlok
4.73 (89)
正在寻找可以帮助您轻松识别有利可图的交易机会的强大外汇交易指标? Beast Super Signal 就是您的不二之选。 这个易于使用的基于趋势的指标持续监控市场状况,寻找新的发展趋势或跳入现有趋势。当所有内部策略一致且彼此 100% 融合时,Beast Super Signal 会发出买入或卖出信号,无需额外确认。当您收到信号箭头警报时,只需买入或卖出。 购买后给我留言,让我加入我的私人 VIP 群组! (仅限购买完整产品)。 购买后给我发消息以获取最新的优化设置文件。 此处提供 MT5 版本。 在此处 获取 Beast Super Signal EA。 查看评论部分以查看最新结果! Beast Super Signal 根据您偏好的 1:1、1:2 或 1:3 风险回报率建议入场价、止损和获利水平,让您放心交易。这个 Beast Super Signal 是 100% 不可重新绘制的,这意味着它永远不会重新计算或重新绘制,每次都能为您提供可靠的信号。 Beast Super Signal 指标适用于所有时间范围,包括货币对、指数、商品和加密货币对。 Beast Su
GOLD Impulse with Alert
Bernhard Schweigert
4.64 (11)
这个指标是我们2个产品 Advanced Currency IMPULSE with ALERT  +   Currency Strength Exotics 的一个超级组合。 它适用于所有时间框架,并以图形方式显示8种主要货币和一种符号的强势或弱势冲动! 该指标专门用于显示任何符号的货币强度加速,如黄金、异国货币对、商品、指数或期货。这是它的第一个指标,任何符号都可以被添加到第9行,以显示黄金、白银、石油、DAX、US30、MXN、TRY、CNH等的真实货币强度加速(冲动或速度)。 建立在新的基础算法上,它使识别和确认潜在的交易更加容易。这是因为它以图形方式显示了一种货币的强势或弱势是否正在加速,并测量了这种加速的速度--把它想象成你汽车中的速度表。当你加速时,事情显然会发生得更快,这在外汇市场上也是一样的,即如果你配对的货币正在向相反的方向加速,你就会发现一个潜在的有利可图的交易。 动态市场斐波那契28水平被用作警报触发器,将适应市场活动。如果冲动击中黄色触发线,你将收到警报。然后你就知道作为一个交易员应该做什么。货币对和方向已经给出。只需点击警报按钮,就可以切换到该货
Volatility Trend System - a trading system that gives signals for entries. The volatility system gives linear and point signals in the direction of the trend, as well as signals to exit it, without redrawing and delays. The trend indicator monitors the direction of the medium-term trend, shows the direction and its change. The signal indicator is based on changes in volatility and shows market entries. The indicator is equipped with several types of alerts. Can be applied to various trading ins
Elliott Wave Trend MT4
Young Ho Seo
4 (7)
Elliott Wave Trend was designed for the scientific wave counting. This tool focuses to get rid of the vagueness of the classic Elliott Wave Counting using the guideline from the template and pattern approach. In doing so, firstly Elliott Wave Trend offers the template for your wave counting. Secondly, it offers Wave Structural Score to assist to identify accurate wave formation. It offers both impulse wave Structural Score and corrective wave Structure Score. Structural Score is the rating to sh
PZ Divergence Trading
PZ TRADING SLU
5 (2)
棘手的发现和频率稀缺是最可靠的交易方案之一。该指标使用您喜欢的振荡器自动查找并扫描常规和隐藏的发散。 [ 安装指南 | 更新指南 | 故障排除 | 常见问题 | 所有产品 ] 容易交易 发现常规和隐藏的分歧 支持许多知名的振荡器 根据突破实现交易信号 显示适当的止损和获利水平 可配置的振荡器参数 可自定义的颜色和尺寸 按条形过滤大小差异 实现绩效统计 它实现了电子邮件/声音/视觉警报 为了提供广阔的市场前景,可以使用不同的振荡器在同一张图表中多次加载该指标,而不会产生干扰。该指标支持以下振荡器: RSI CCI MACD OSMA 随机 动量 很棒的振荡器 加速器振荡器 威廉姆斯百分比范围 相对活力指数 由于差异可能会扩大很多,尤其是在外汇市场中,因此该指标产生了转折:它在等待交易突破之前等待donchian突破确认差异。最终结果是带有非常可靠的交易信号的重新粉刷指示器。 输入参数 幅度:用于寻找差异的之字形周期 振荡器-选择要加载到图表的振荡器。 突破期-交易信号的突破期,以柱为单位。 发散类型-启用或禁用发散类型:隐藏,常规或两者。 最小散度单位为条形-最小散度单位为条形
作者的更多信息
SuperCCI
Denys Babiak
Description SuperCCI is an indicator based on the standard CCI indicator. It identifies and displays convergences/divergences in the market and forms the corresponding entry points. Also, using the trading channel index, it determines the direction of the trend and displays the levels of support and resistance . Features Not repaint. Shows entry points. Shows the direction of the current trend and support/resistance levels. Has notifications. Recommendations Use convergence/divergence to ide
Volume Horizon is a horizontal volume indicator that allows you to observe the density of market participants' volumes across various price and time intervals. Volume histograms can be constructed based on ascending or descending market waves, as well as individual bars. This tool enables more precise determination of entry or exit points, relying on levels of maximum volumes or volume-weighted average prices (VWAP). What makes Volume Horizon unique? 1. Segmentation into ascending and descendi
Double Fractal Entry Bot trades automatically using fractal breakouts or rebounds. It detects precise entry points, places SL and TP based on market structure, and includes logic to manage risk and avoid false signals. Simple, smart, and powerful. This product is also available for MetaTrader 5 =>  https://www.mql5.com/en/market/product/143608 Double Fractal Entry Bot is an intelligent trading robot based on the proven logic of the Double Fractal Entry indicator. It analyzes price using upper a
Description Range Detector   is an indicator that identifies ranges in the market and displays their presence on the price chart. Recommendations You can use this indicator to determine the flet and, accordingly, to determine the direction of opening a position or closing an opposite position. Parameters Maximum History Bars   - maximum number of history bars for calculating the indicator. Average True Range Period   - ATR indicator period (used to calculate the difference between moving a
Impulse Angle
Denys Babiak
4 (3)
Description Range Detector   is an indicator that identifies impulses in the market and displays their slope angles on the chart. Recommendations You can use this indicator to determine a trend and, accordingly, to determine the direction of opening a position or closing an opposite position. Parameters ===== _INDICATOR_SETTINGS_ =====   - indicator settings Maximum History Bars   - maximum number of history bars for calculating the indicator. Average True Range Period   - ATR indicator p
Volume Magic
Denys Babiak
3.67 (3)
Description Volume Magic is an indicator that shows the value of the relative volume in conjunction with the direction of the current trend. The ratio of the current volume relative to the average volume for a certain period is displayed in the lower window as an oscillator. The direction of the current trend is displayed as two-color trend lines. How to use? First, use two-color trend lines to determine the direction of the current trend. Then look for areas of low volume and open positions
Money Zones
Denys Babiak
Description Money Zones is an indicator that determines accumulation/distribution zones in the market. Green zones make it possible to look for buy entry points or sell exit points. Red zones, on the contrary, define the opportunity for selling or closing buys. The indicator has the ability to define money zones for two timeframes simultaneously on the same chart. How to use? Use this indicator to identify market zones as support/resistance zones to determine the best conditions for market e
Description Bitcoin Manager is the best indicator for trading Bitcoin cryptocurrency. It is calculated based on the price deviation from the moving average line channel. Ascending and descending arrows indicate potential points and levels for opening buy and sell positions. How to use? We strongly recommend using this indicator on the H1 timeframe. An up arrow indicates a buy level. Down Arrow - Sell Level. Parameters Maximum History Bars - maximum count of history bars to calculate. _GRAP
Description The Quantum Awesome Oscillator indicator is based on the standard Bill Williams Awesome Oscillator (AO) indicator. It has two parts. The lower part is a colored histogram of the oscillator (divided into two sides - above zero and below zero and, accordingly, colored in two colors - blue for buying and red for selling) and a trend curve line (shows the direction of the global trend). The upper part - arrows showing market entry points, as well as dashed lines showing Stop-Loss and Ta
Description The Quantum Awesome Oscillator Pro indicator is based on the standard Bill Williams Awesome Oscillator (AO) indicator. It has two parts. The lower part is a colored histogram of the oscillator (divided into two sides - above zero and below zero and, accordingly, colored in two colors - blue for buying and red for selling) and a trend curve line (shows the direction of the global trend). The upper part - arrows showing market entry points, as well as dashed lines showing Stop-Loss an
Description Trend Influencer is an indicator that determines the potential dynamics of the influence of trend wave movements on the market. The indicator is based on the value of moving averages corrected by the standard deviation. The indicator is displayed as a main dash-dotted moving average and a signal solid moving average. The signal moving average is colored blue or red depending on what type of trend is currently observed in the market. The indicator also draws inhibition levels - blue a
Let us introduce you to a new era of neural indicators for financial markets! Intelligent Moving is a unique indicator that trains its neural network in real time! You no longer need to look for the optimal indicator parameters for each specific situation. No more late signals. The artificial intelligence is able to adapt itself and predict any market movements. Visually, the indicator is drawn as a main solid moving average line, two dotted lines of standard deviations and signal arrows. For
Volume Horizon is a horizontal volume indicator that allows you to observe the density of market participants' volumes across various price and time intervals. Volume histograms can be constructed based on ascending or descending market waves, as well as individual bars. This tool enables more precise determination of entry or exit points, relying on levels of maximum volumes or volume-weighted average prices (VWAP). What makes Volume Horizon unique? 1. Segmentation into ascending and descendi
Fractal Bot Gold is a trading bot that utilizes breakout and rebound strategies from fractal levels to determine effective entry points for positions, as well as to set safe stop-losses and take-profits. Combined with the Average True Range (ATR) indicator and precise adaptation to market conditions, it minimizes the impact of market noise and volatility, providing reliable risk management and optimizing profits. The bot’s parameters are carefully optimized and adapted for trading the Gold (XAU
One Good Trade is a simple and effective Forex trading bot that implements the "time determines price" strategy. Its main feature is just one trade per day, executed at the optimal time and in the direction of the current trend. This straightforward approach allows you to take full advantage of favorable market conditions while minimizing risks. Additionally, the bot adjusts to market volatility, ensuring that stop-loss and take-profit levels are set appropriately for current market conditions.
Real Spread Monitor is a powerful indicator that is designed to accurately measure and analyze real spreads, giving traders the ability to compare trading conditions of different brokers. This product is also available for MetaTrader 5 =>  https://www.mql5.com/en/market/product/125768 Key Features of Real Spread Monitor: 1. Two modes of operation: Write mode : In this mode the indicator collects data on real spreads of the selected trading instrument and records them in a file. The spread is r
Position Accelerator is an innovative solution for traders that helps maximize profits by capitalizing on trending market movements. The utility automatically increases the size of your trading positions once they reach a predefined profit level, significantly enhancing your profitability. This product is also available for MetaTrader 5 =>  https://www.mql5.com/en/market/product/126702 How does Position Accelerator work? 1. Acceleration through additional positions: When your open position reac
The ABC Indicator analyzes the market through waves, impulses, and trends, helping identify key reversal and trend-change points. It automatically detects waves A, B, and C, along with stop-loss and take-profit levels. A reliable tool to enhance the accuracy and efficiency of your trading. This product is also available for MetaTrader 5 =>  https://www.mql5.com/en/market/product/128178 Key Features of the Indicator: 1. Wave and Trend Identification:    - Automatic detection of waves based on mov
ZLMA Trend Candles indicator uses an enhanced Zero-Lag Moving Average to highlight key trend shifts, repainting candles in real time. It reacts faster than traditional moving averages, helping you spot potential market turns earlier. Gain clear entry and exit signals and filter out market noise with ease! This product is also available for MetaTrader 5 =>  https://www.mql5.com/en/market/product/129278 1. What Is ZLMA Trend Candles? ZLMA Trend Candles is a MetaTrader 4/5 indicator based on the Z
Fibo Extrema Bands is a unique indicator that visually demonstrates when the market shifts into a trend and highlights key levels acting as support or resistance. It combines easy-to-read “stepped” extrema lines with Fibonacci levels (whose values can be adjusted in the indicator’s inputs), simplifying the search for entry and exit points. Install Fibo Extrema Bands to gain a powerful tool for trend analysis and for identifying critical price levels! This product is also available for MetaTrade
Double Fractal Entry generates precise entry signals based on smart fractal breakouts or rebounds. It visualizes market structure with dynamic channels and plots clear SL/TP levels. A powerful tool for trend and reversal traders. This product is also available for MetaTrader 5 =>  https://www.mql5.com/en/market/product/143601 The indicator generates entry points based on two configurable strategies: Fractal Breakout – when price breaks the last key fractal; Fractal Rebound – when price bounces
Intelligent Moving Bot — Adaptive EA with Neural Optimization Intelligent Moving Bot is a fully autonomous EA built on the Intelligent Moving indicator. It uses a dynamic MA, ATR-based deviation bands, and virtual trades with a perceptron to optimize parameters on the fly — with no repainting and no manual curve-fitting. This product is also available for MetaTrader 5 =>  https://www.mql5.com/en/market/product/148151 Intelligent Moving indicator is available here =>  https://www.mql5.com/en/
Imbalance Volume Trend is a professional indicator for MetaTrader that combines Fair Value Gap (FVG) / Imbalance zones with volume imbalance analysis and a trend engine based on imbalances . The indicator automatically finds bullish and bearish Fair Value Gaps, paints them on the chart as colored rectangles and calculates the percentage of volume domination of buyers over sellers (or vice versa) inside the breakout candle that created the imbalance. On top of that, it builds a trend of imbalance
Description Range Detector   is an indicator that identifies ranges in the market and displays their presence on the price chart. Recommendations You can use this indicator to determine the flet and, accordingly, to determine the direction of opening a position or closing an opposite position. Parameters Maximum History Bars   - maximum number of history bars for calculating the indicator. Average True Range Period   - ATR indicator period (used to calculate the difference between moving a
Description Range Detector is an indicator that identifies impulses in the market and displays their slope angles on the chart. Recommendations You can use this indicator to determine a trend and, accordingly, to determine the direction of opening a position or closing an opposite position. Parameters ===== _INDICATOR_SETTINGS_ ===== - indicator settings Maximum History Bars - maximum number of history bars for calculating the indicator. Average True Range Period - ATR indicator period (us
SuperCCI MT5
Denys Babiak
Description SuperCCI is an indicator based on the standard CCI indicator. It identifies and displays convergences/divergences in the market and forms the corresponding entry points. Also, using the trading channel index, it determines the direction of the trend and displays the levels of support and resistance . Features Not repaint. Shows entry points. Shows the direction of the current trend and support/resistance levels. Has notifications. Recommendations Use convergence/divergence to ide
Description Volume Magic is an indicator that shows the value of the relative volume in conjunction with the direction of the current trend. The ratio of the current volume relative to the average volume for a certain period is displayed in the lower window as an oscillator. The direction of the current trend is displayed as two-color trend lines. How to use? First, use two-color trend lines to determine the direction of the current trend. Then look for areas of low volume and open positions
Description Money Zones is an indicator that determines accumulation/distribution zones in the market. Green zones make it possible to look for buy entry points or sell exit points. Red zones, on the contrary, define the opportunity for selling or closing buys. The indicator has the ability to define money zones for two timeframes simultaneously on the same chart. How to use? Use this indicator to identify market zones as support/resistance zones to determine the best conditions for market e
Description Bitcoin Manager is the best indicator for trading Bitcoin cryptocurrency. It is calculated based on the price deviation from the moving average line channel. Ascending and descending arrows indicate potential points and levels for opening buy and sell positions. How to use? We strongly recommend using this indicator on the H1 timeframe. An up arrow indicates a buy level. Down Arrow - Sell Level. Parameters Maximum History Bars - maximum count of history bars to calculate. _GRAP
Description Trend Influencer is an indicator that determines the potential dynamics of the influence of trend wave movements on the market. The indicator is based on the value of moving averages corrected by the standard deviation. The indicator is displayed as a main dash-dotted moving average and a signal solid moving average. The signal moving average is colored blue or red depending on what type of trend is currently observed in the market. The indicator also draws inhibition levels - blue a
筛选:
无评论
回复评论