Easy Trend Scalper
- 指标
- 版本: 1.50
- 更新: 4 三月 2025
- 激活: 10

“ Easy Trend Scalper ”指标是为趋势方向内的剥头皮交易而设计的。
指标的工作原理。
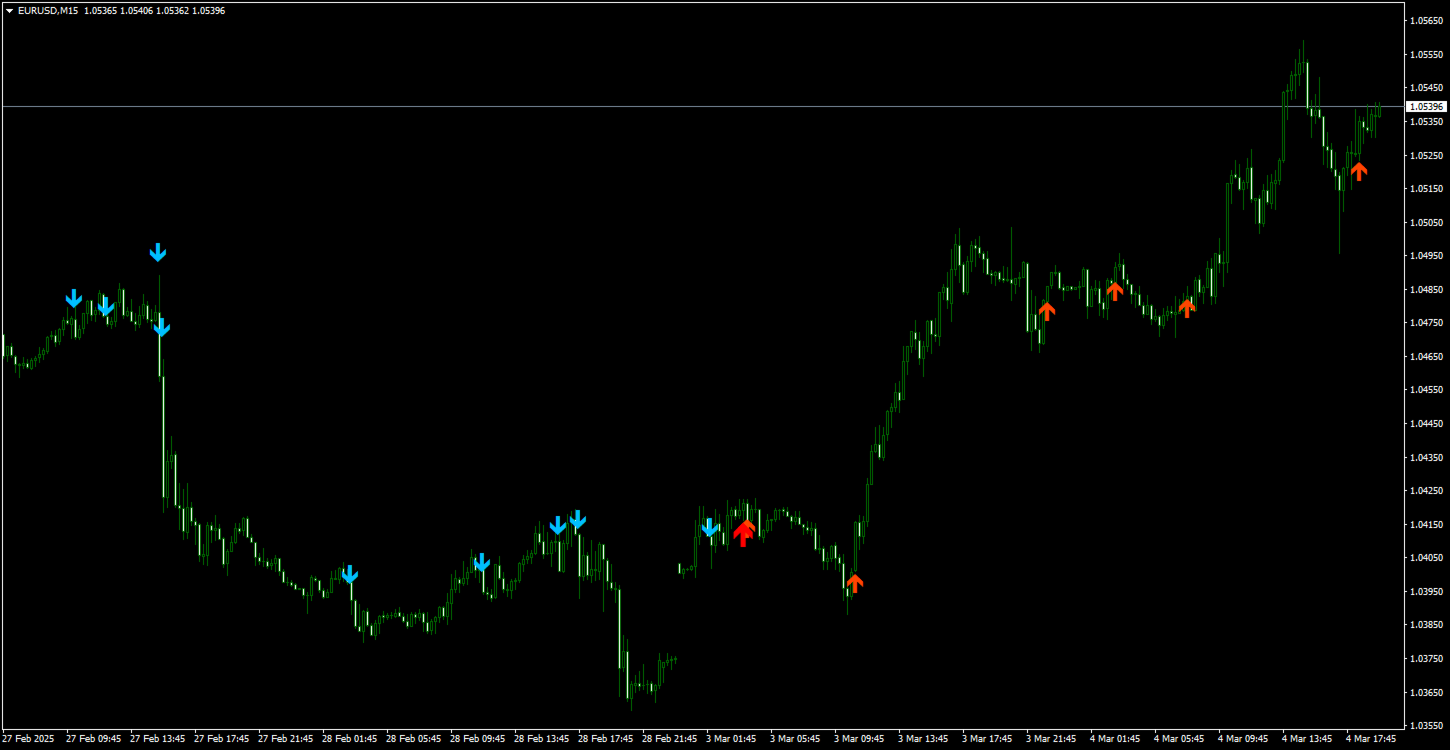
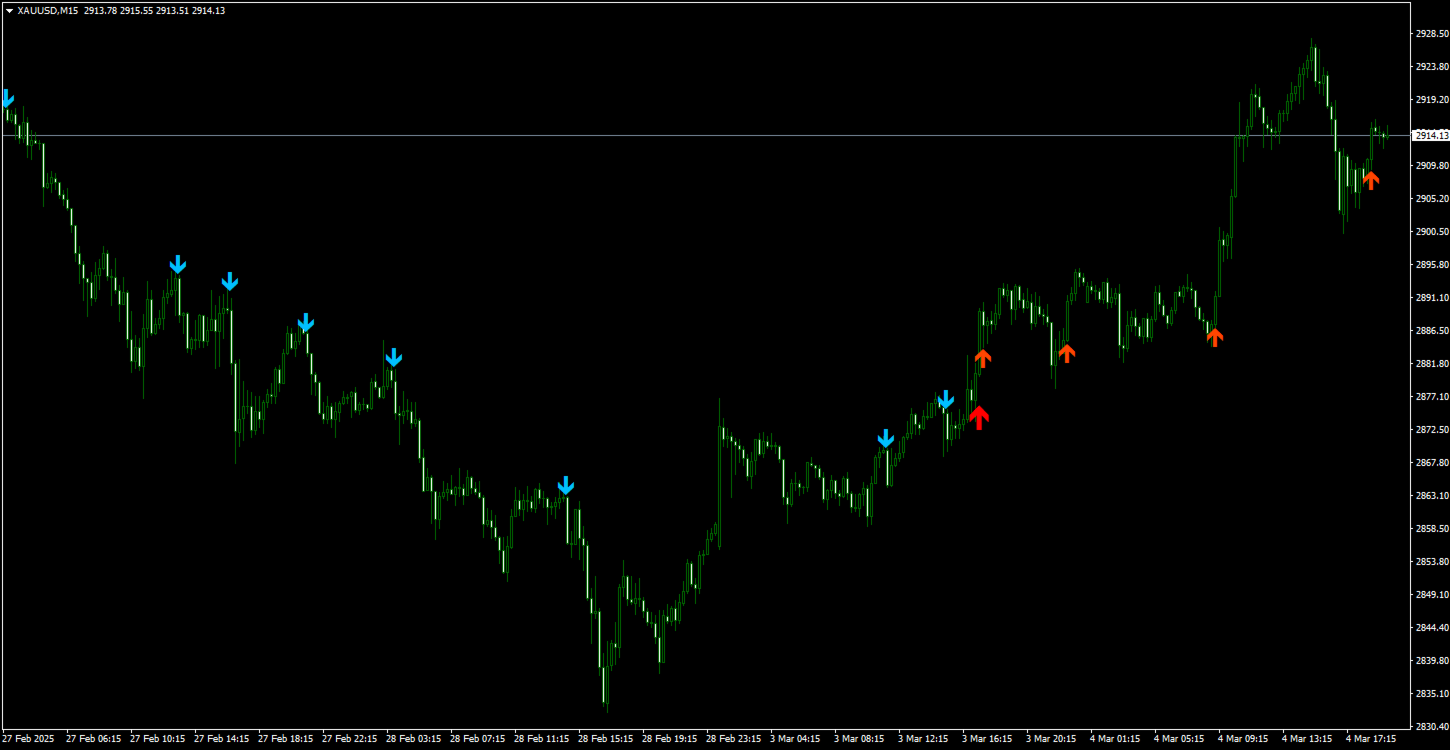
该指标决定市场走势的方向。
红色大箭头表示看涨方向。
蓝色大箭头-表示看跌方向。
在看涨或看跌趋势中,有一种算法可以以小箭头的形式生成剥头皮信号。
橙色箭头是购买信号。
蓝色——表示销售。
还可以手动更改需要为所需工具配置的参数。
“ Channel Width ” - 用于确定趋势的通道宽度,在较低时间范围内增加,在较高时间范围内增加。
“ Signal Generator ”——调整信号生成的频率,数字越大,信号数量越少。
指标的工作原理。
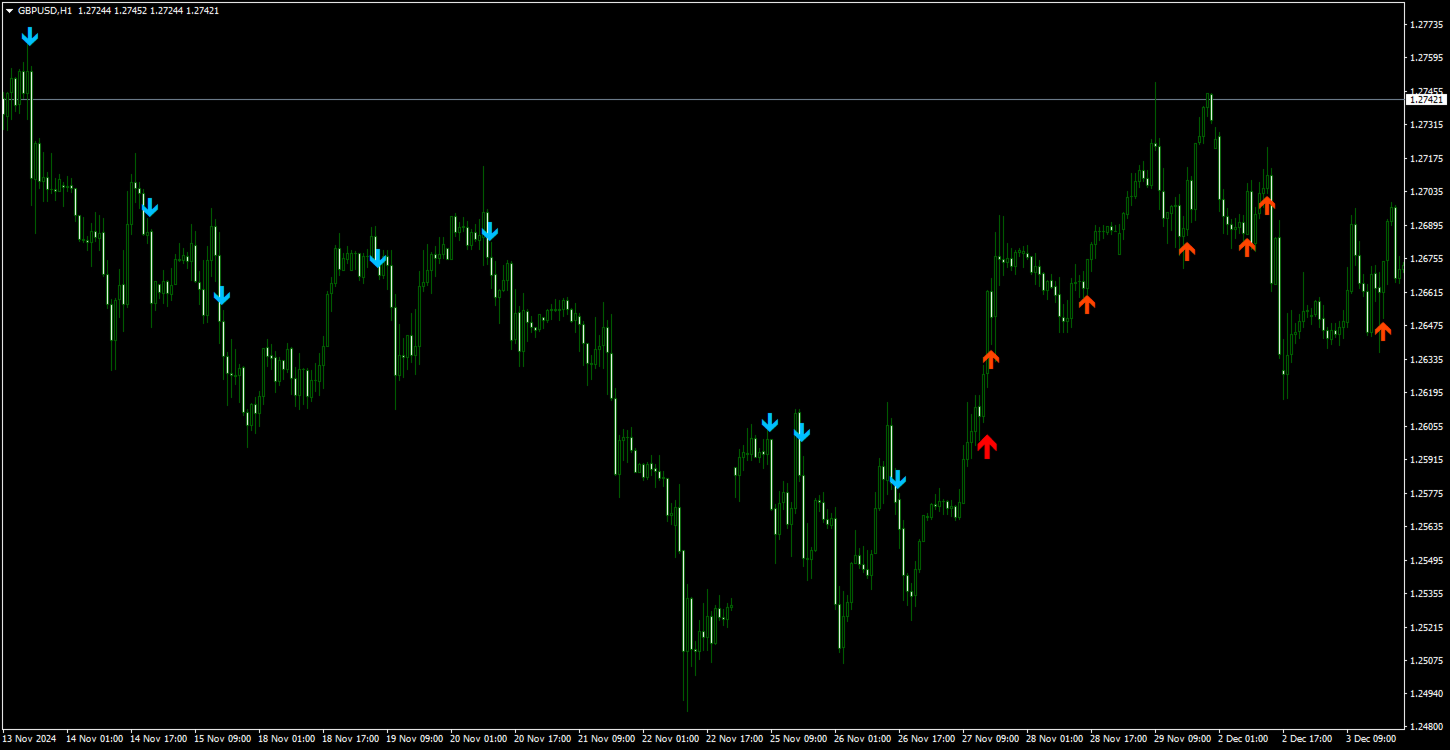
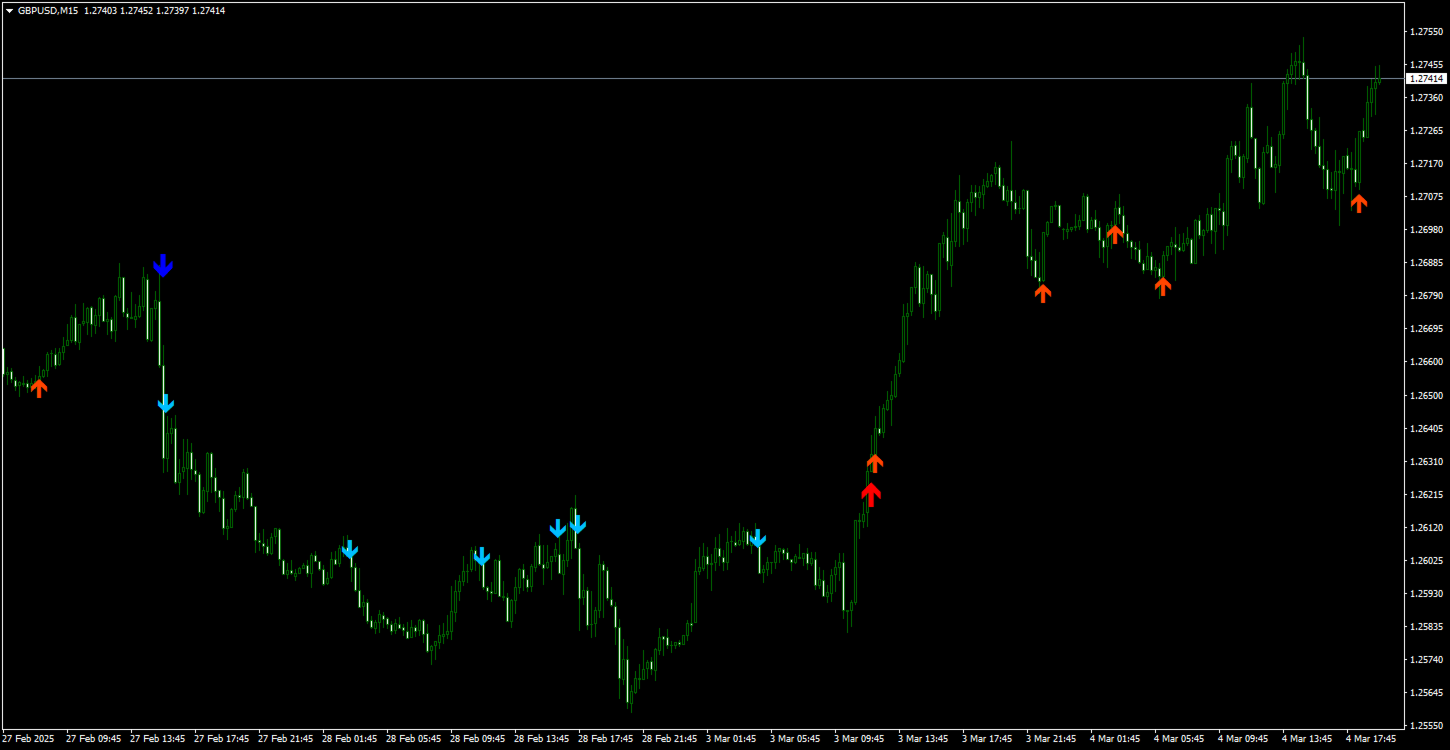
该指标决定市场走势的方向。
红色大箭头表示看涨方向。
蓝色大箭头-表示看跌方向。
在看涨或看跌趋势中,有一种算法可以以小箭头的形式生成剥头皮信号。
橙色箭头是购买信号。
蓝色——表示销售。
- 可以用于任何交易工具和任何时间范围。
- 当信号出现时提供几种类型的警报,用于改变趋势方向和进入信号。
- 无需重新绘制,可让您预测 2-5 根蜡烛的价格走向。
- 箭头形成模式可以手动更改——在当前蜡烛上或在蜡烛收盘时。
- 在两种情况下,如果下一根蜡烛已经打开,则不会重新绘制前一根蜡烛上的箭头。
还可以手动更改需要为所需工具配置的参数。
“ Channel Width ” - 用于确定趋势的通道宽度,在较低时间范围内增加,在较高时间范围内增加。
“ Signal Generator ”——调整信号生成的频率,数字越大,信号数量越少。