Easy Trend Scalper
- インディケータ
- バージョン: 1.50
- アップデート済み: 4 3月 2025
- アクティベーション: 10

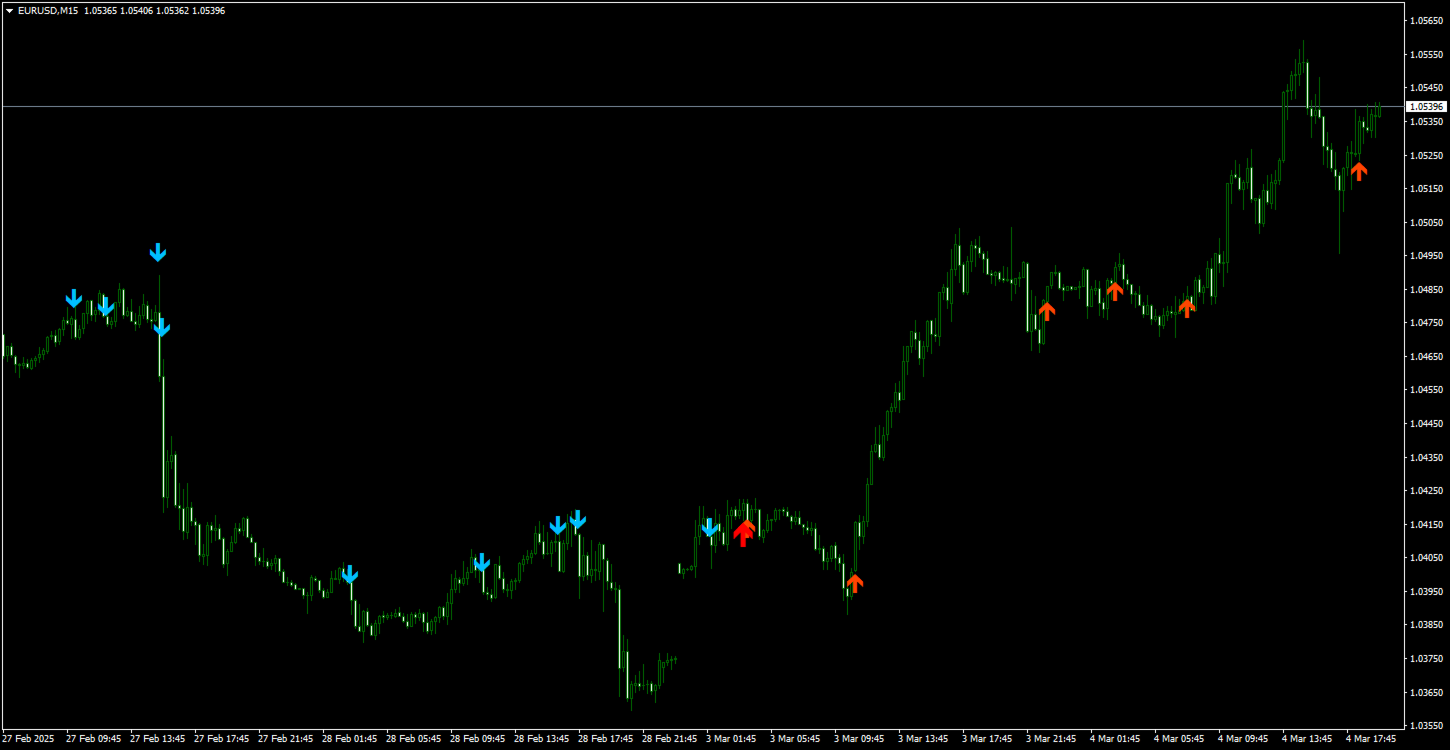
「 Easy Trend Scalper 」インジケーターは、トレンド方向内でのスキャルピング取引用に設計されています。
インジケーターの動作原理。
この指標は、市場がどの方向に動いているかを判断します。
赤い大きな矢印は強気方向を示します。
青い大きな矢印 - 弱気方向。
強気または弱気のトレンドでは、小さな矢印の形でスキャルピングのシグナルを生成するアルゴリズムがあります。
オレンジ色の矢印は購入を促すシグナルです。
青 - 販売の合図。
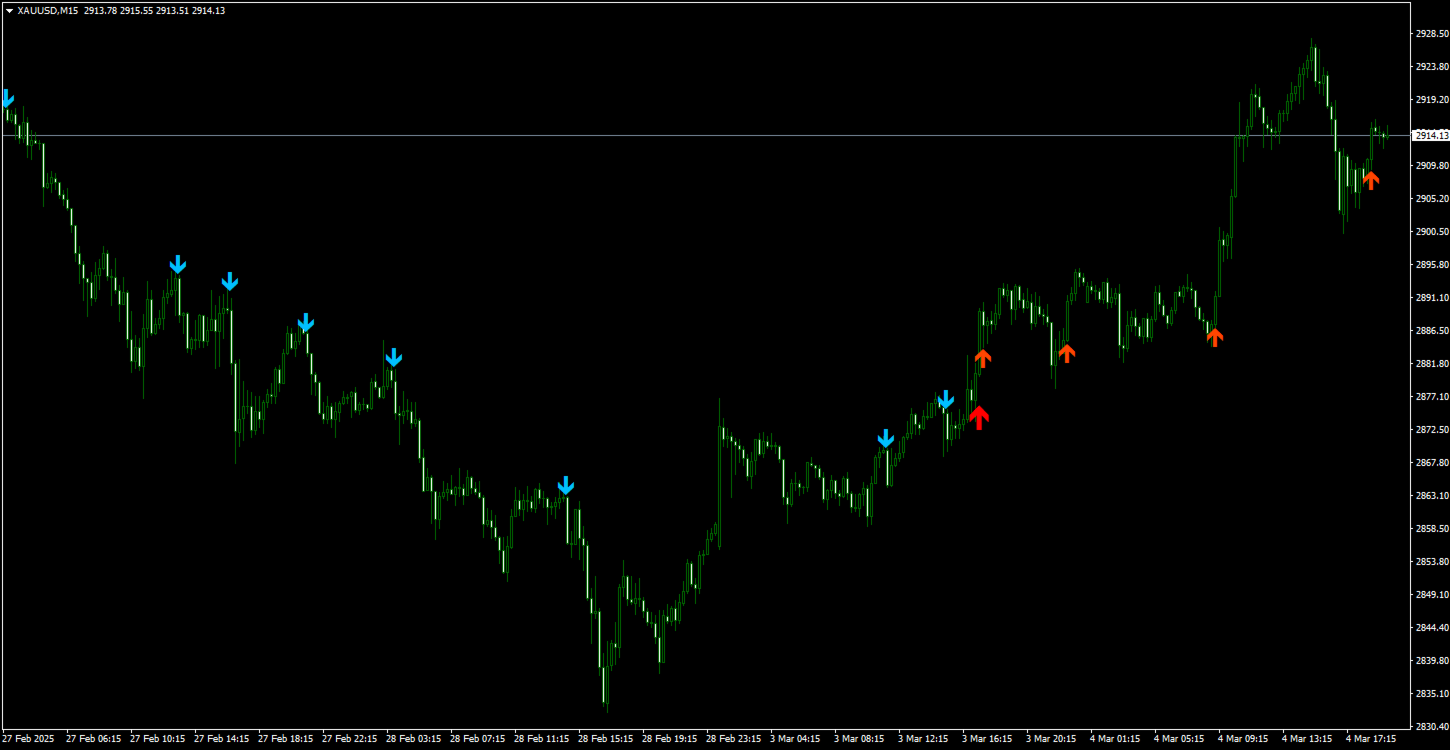
目的のツールに対して設定する必要があるパラメータも手動で変更できます。
「 Channel Width 」 - トレンドを決定するためのチャネル幅。低い時間枠では増加し、高い時間枠では増加します。
「 Signal Generator 」 - 信号生成の頻度を調整します。数値が高いほど、信号の数は減ります。
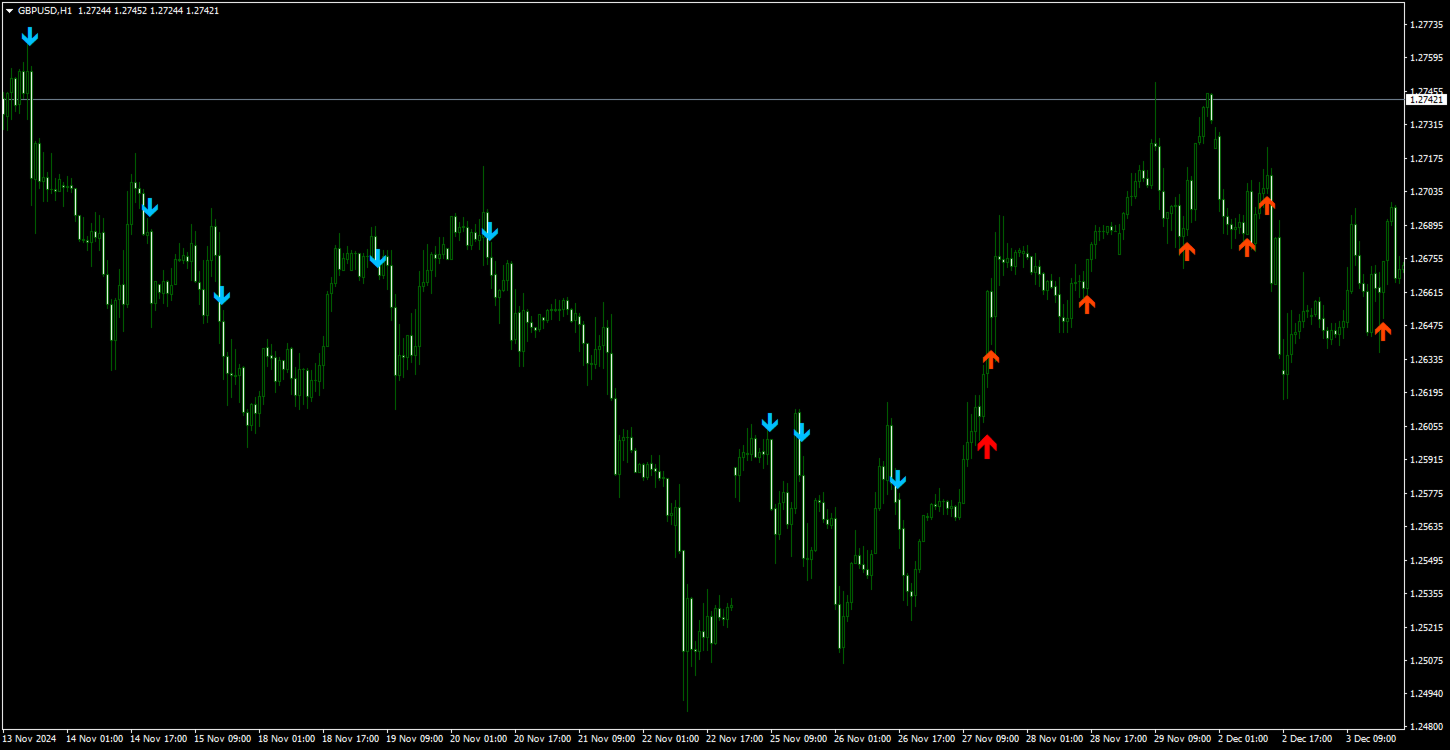
インジケーターの動作原理。
この指標は、市場がどの方向に動いているかを判断します。
赤い大きな矢印は強気方向を示します。
青い大きな矢印 - 弱気方向。
強気または弱気のトレンドでは、小さな矢印の形でスキャルピングのシグナルを生成するアルゴリズムがあります。
オレンジ色の矢印は購入を促すシグナルです。
青 - 販売の合図。
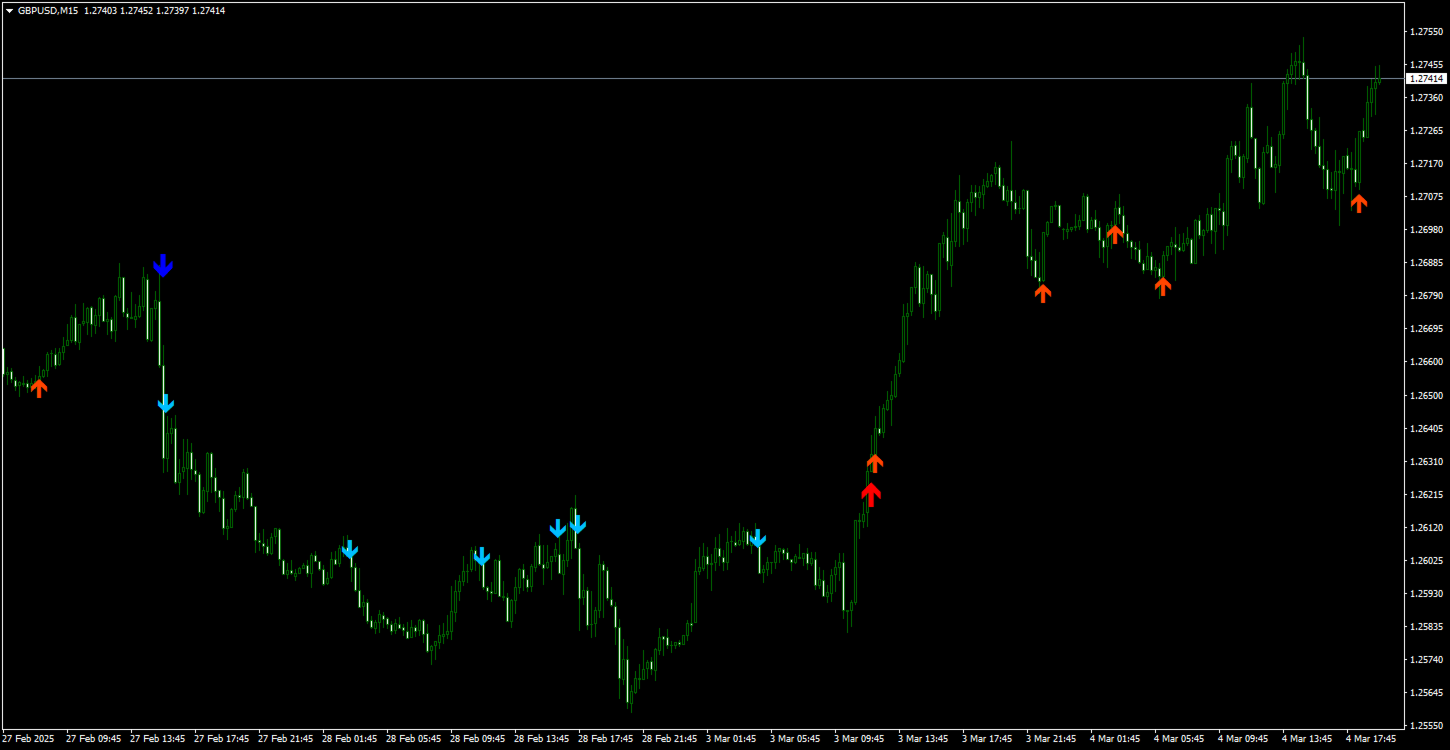
- あらゆる取引商品とあらゆる時間枠で使用できます。
- トレンドの方向やエントリーシグナルを変更するために、シグナルが表示されたときにいくつかの種類のアラートを提供します。
- 再描画なしで動作し、2〜5 本のローソク足の価格方向を予測できます。
- 矢印形成モードは、現在のローソク足またはローソク足の終値で手動で変更できます。
- 2 つのケースでは、次のローソク足が開いている場合、前のローソク足の矢印は再描画されません。
目的のツールに対して設定する必要があるパラメータも手動で変更できます。
「 Channel Width 」 - トレンドを決定するためのチャネル幅。低い時間枠では増加し、高い時間枠では増加します。
「 Signal Generator 」 - 信号生成の頻度を調整します。数値が高いほど、信号の数は減ります。