Catalyst Points
- 指标
- 版本: 1.1
- 更新: 30 十二月 2024
- 激活: 10

Spot Turning Points with Ease
The Catalyst Indicator is a tool designed to assist traders in analyzing potential turning points in price movements. By combining a smoothing technique with an advanced algorithm, this indicator offers signals that can support your trading analysis and decision-making.
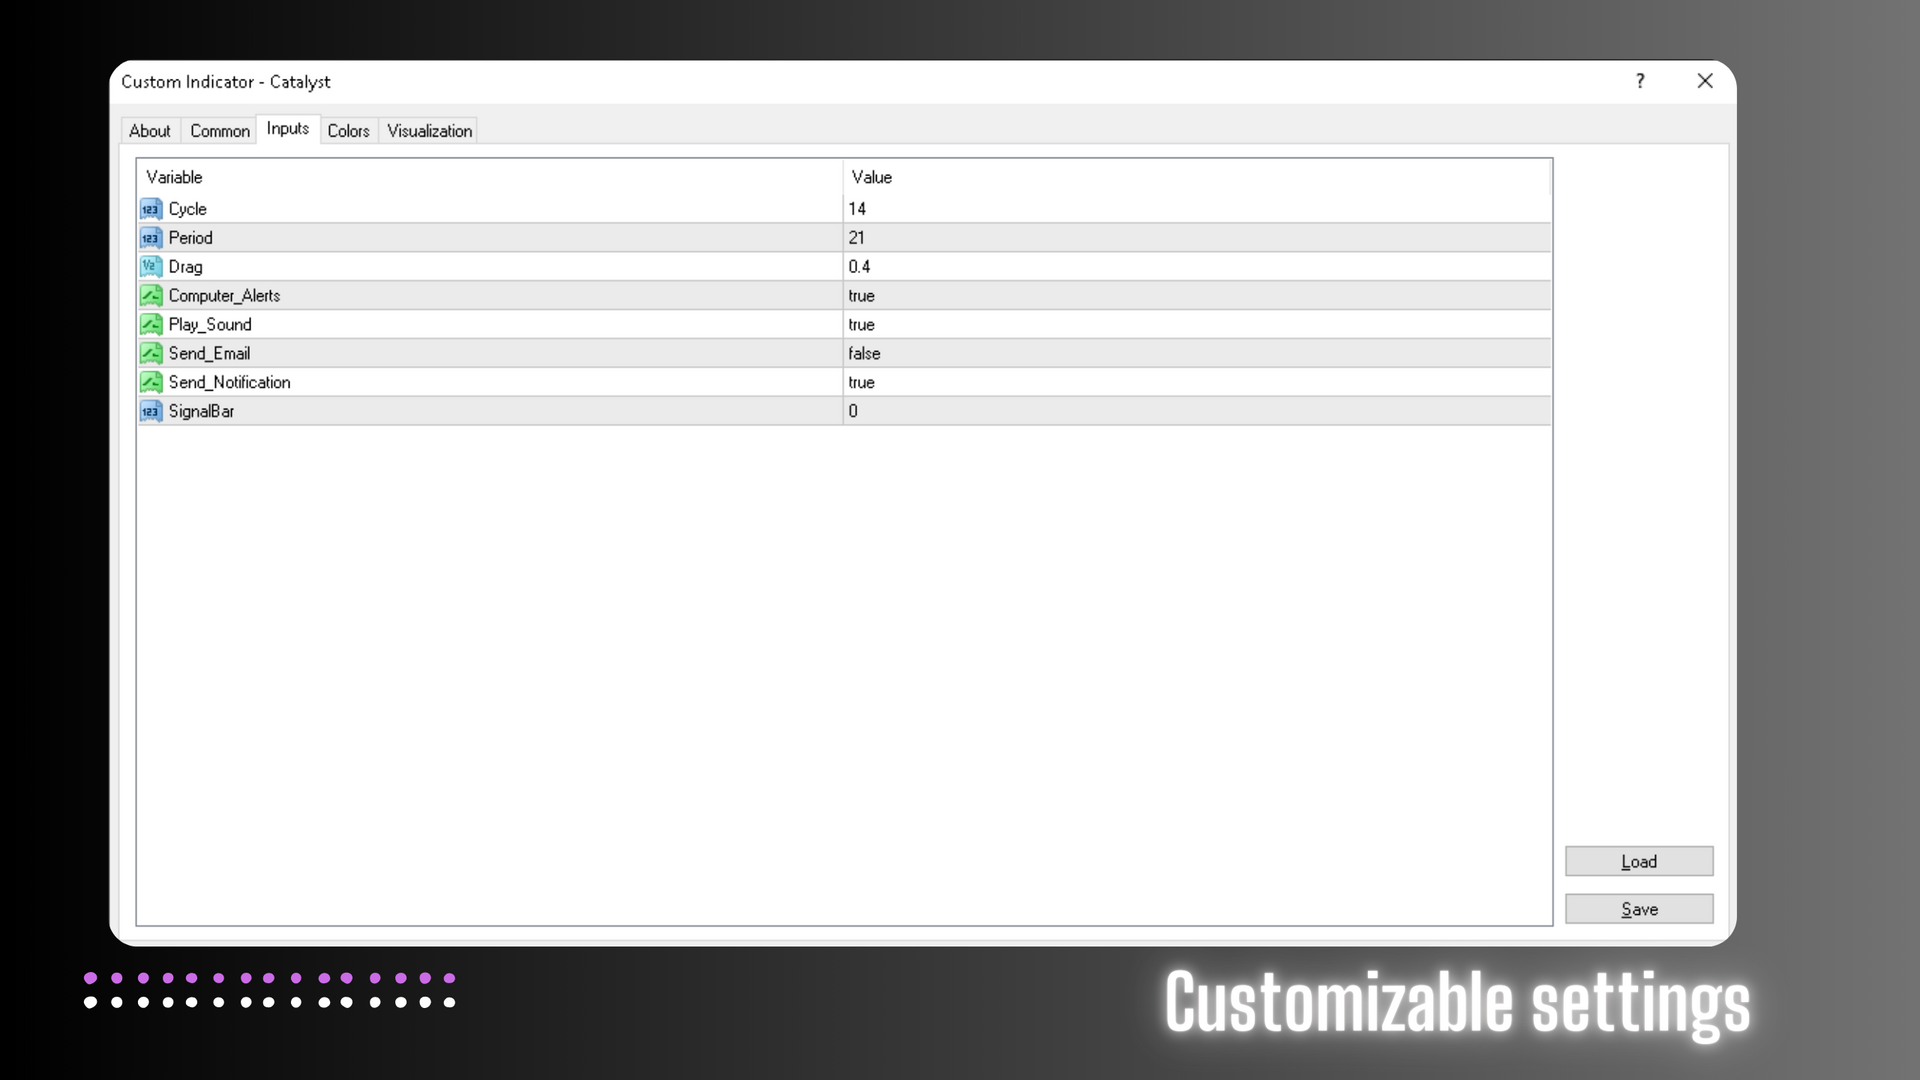
Parameters:
| Variable | (Defaults) |
|---|---|
| Cycle | 14 |
| Period | 21 |
| Drag | 0.2 |
| Computer Alerts | True |
| Play_Sound | True |
| Send_Email | false |
| Send_Notification | True |
| Signal_Bar | 0 |
How It Works
-
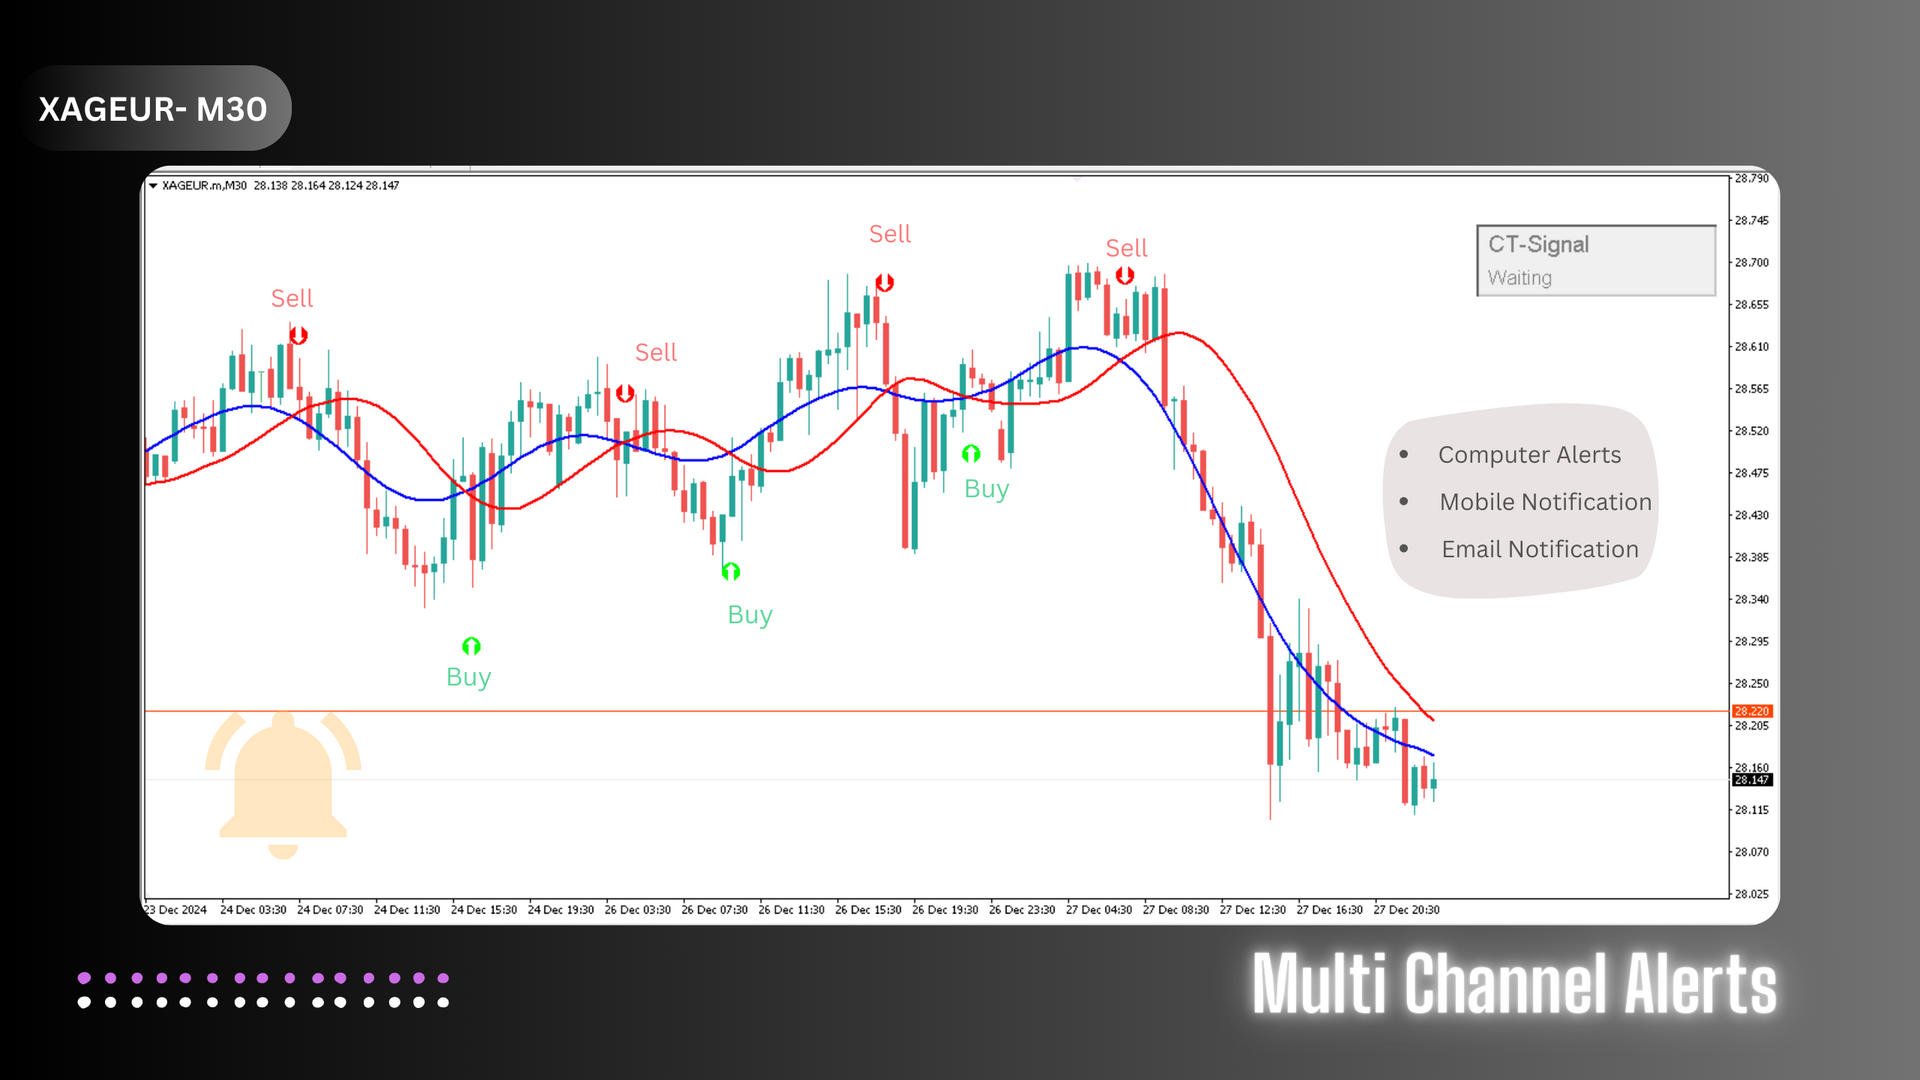
Signal Detection:
- Green Arrows: Appear at line crossings to indicate a potential buy signal.
- Red Arrows: Mark crossing points suggesting a potential sell signal.
-
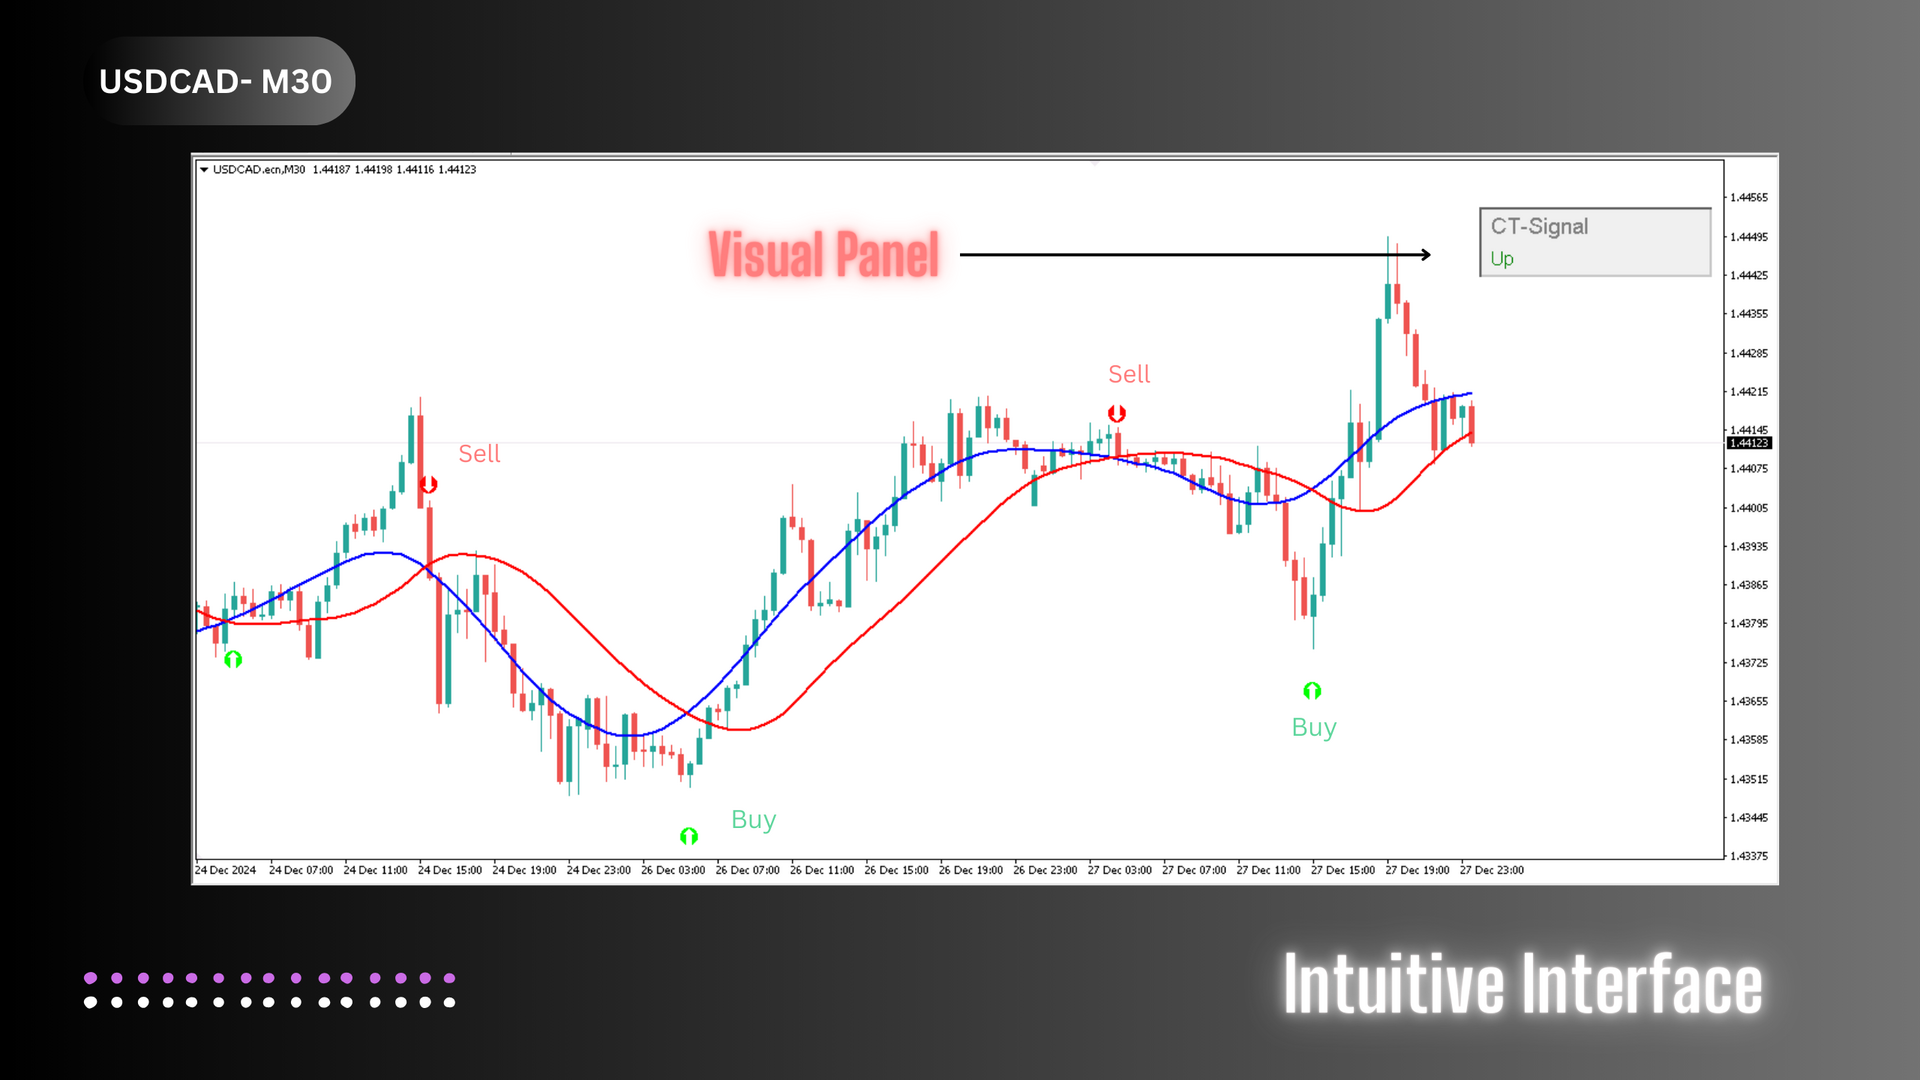
Signal Panel: Stay informed at a glance with a built-in panel that updates in real-time:
- Empty: No active signal.
- Up: Indicates a buy signal.
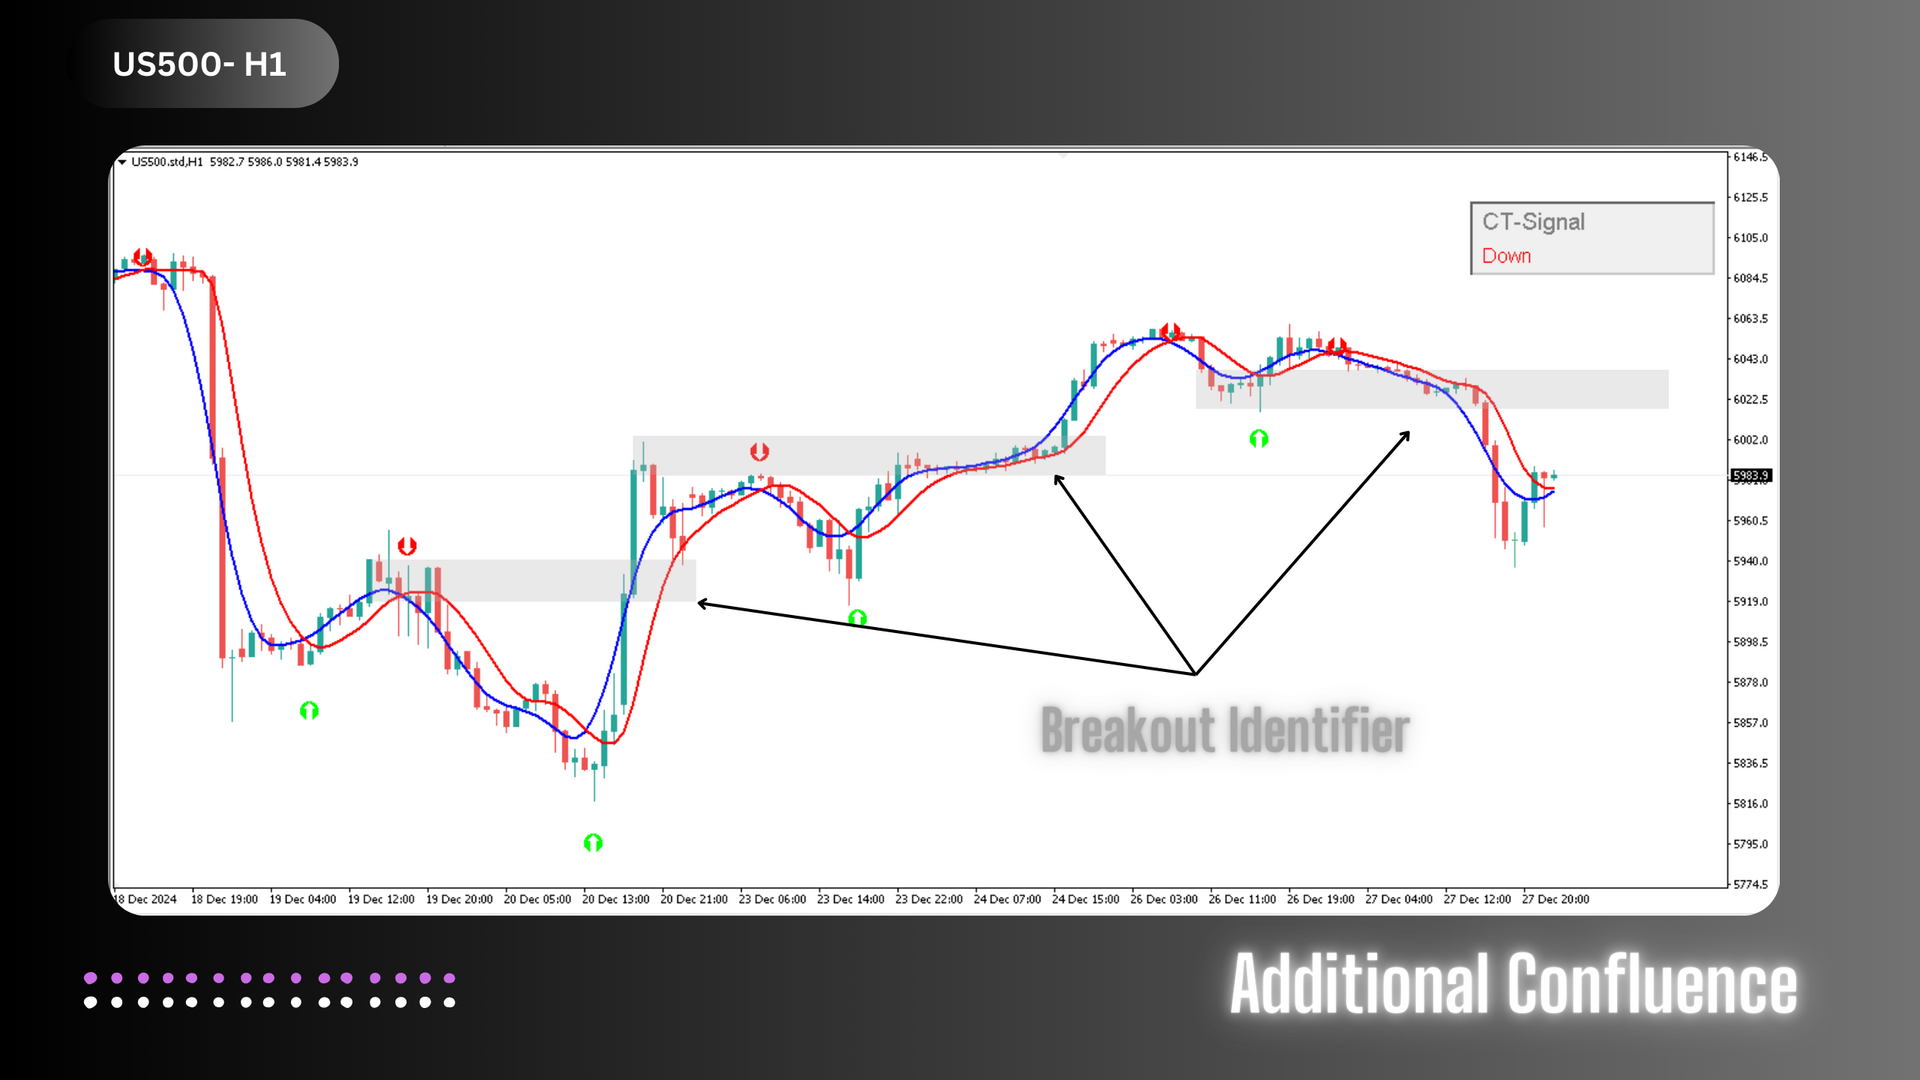
- Down: Indicates a sell signal.
-
Customizable Alerts: Receive alerts via computer, email, or mobile notifications. Easily adjust settings to suit your needs.
Key Features
- Advanced Signal Generation: Combines the T3 indicator with proprietary algorithms for fast and reliable signal detection.
- Interactive Signal Panel: Displays the current market signal in real-time, ensuring you’re always informed.
- Visual Clarity: Arrows at crossing points make identifying potential price changes intuitive.
- Versatile Application: Ideal for forex, stocks, commodities, and cryptocurrencies across multiple timeframes.
- Customizable Parameters: Adapt settings to fit your trading style and strategy.
Why Use the Catalyst Indicator?
- Identify critical price turning points with accuracy and speed.
- Gain confidence in your trades with real-time signal updates.
- Make informed decisions with a tool that adapts to your trading preferences.