Makuchaku Super Order Block
- 指标
- 版本: 1.0
- 激活: 10

Makuchaku Super Order Block
Introducing the "Makuchaku Super Order Block" – an all-in-one, powerhouse trading tool that combines the market’s most effective indicators in one, intuitive interface. This is more than just an indicator; it's a comprehensive market intelligence solution. Engineered for peak performance and precision, OBFVG is the best indicator of 2024 and a must-have for every serious trader. Let's dive into the key features of this indicator and how each can enhance your trading success.
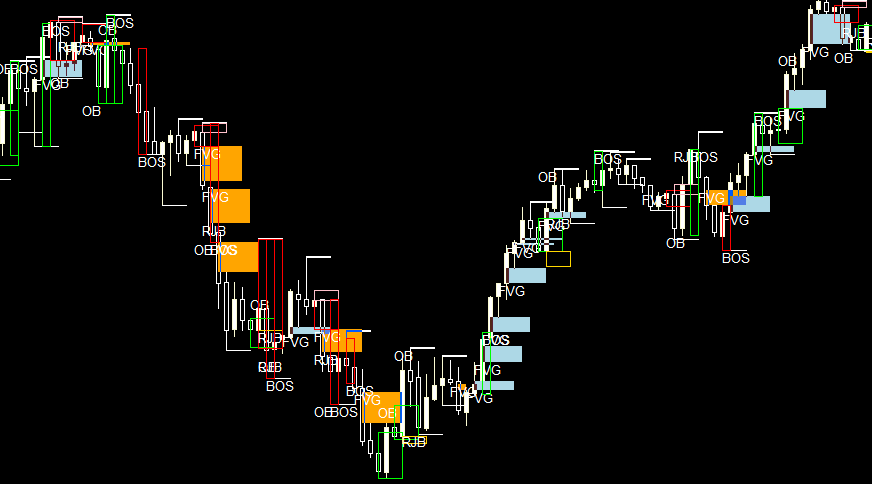
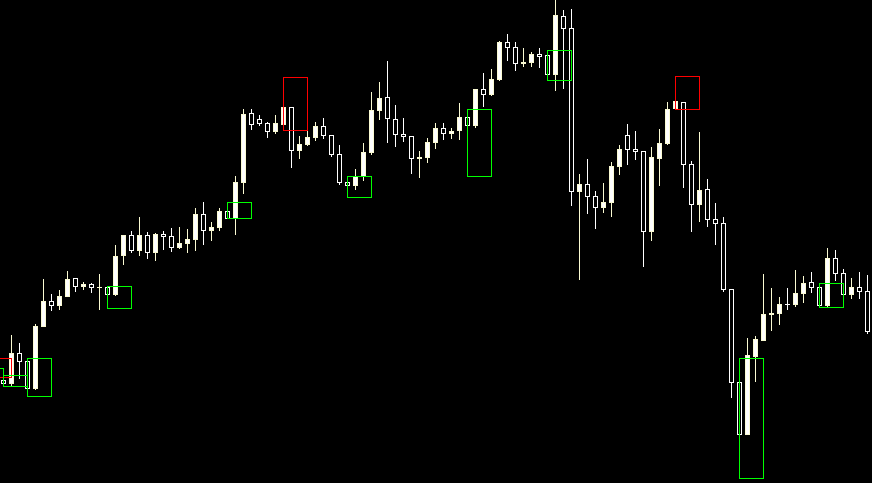
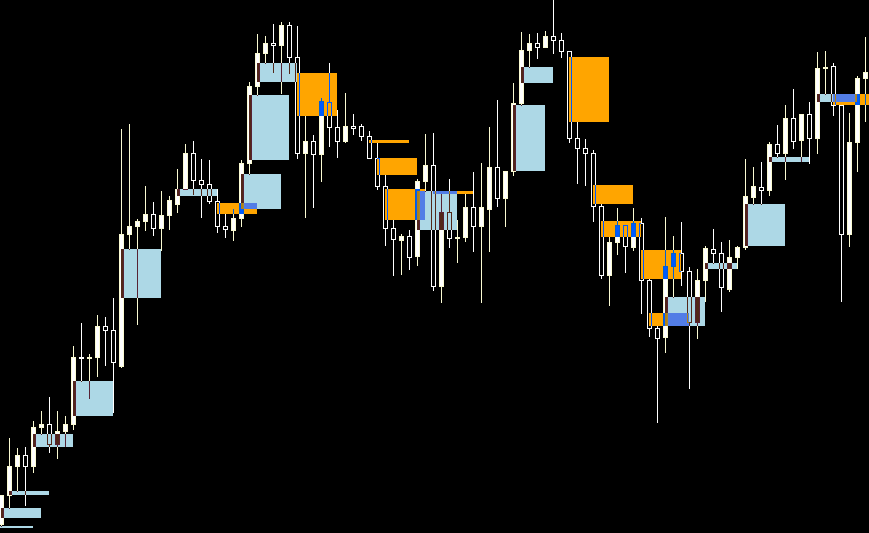
Order Blocks
Order Blocks are institutional zones where significant buying or selling orders have accumulated. The Makuchaku Super Order Block indicator highlights these zones, offering insights into the likely positions of large market players. Understanding these zones allows traders to align their trades with institutional money, enhancing trade reliability and reducing risk by focusing on areas with high liquidity.
Fair Value Gaps (FVGs)
Fair Value Gaps identify imbalances in the price where demand greatly outweighed supply (or vice versa). These are price gaps that the market tends to fill as it rebalances. Makuchaku Super Order Block’s FVG feature spots these gaps in real-time, giving you a trading edge by indicating price levels that are highly likely to be retested. Perfect for traders looking to catch optimal entry and exit points.
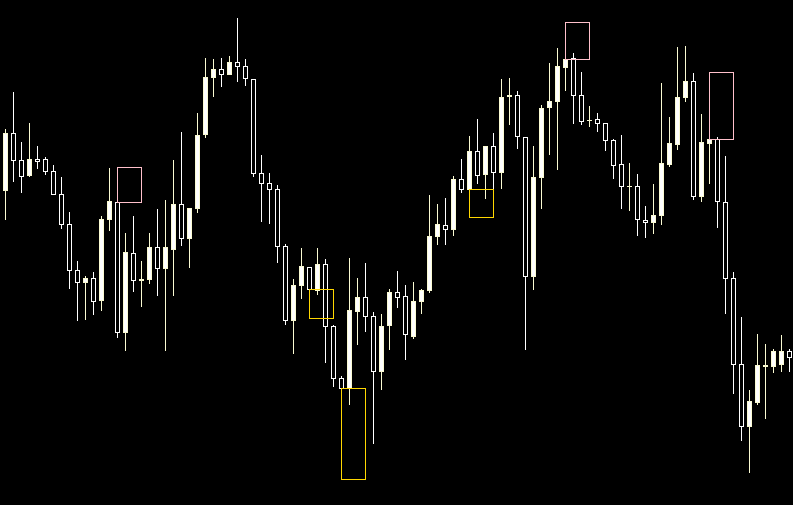
Rejection Blocks
Rejection Blocks mark areas where price was quickly rejected, signaling strong support or resistance levels. By highlighting these zones, the Makuchaku Super Order Block indicator helps traders identify areas where the market is likely to react, providing opportunities to enter or exit trades with a high probability of success.
Pivot Points
Pivot Points are critical support and resistance levels calculated based on recent price action. Makuchaku Super Order Block includes dynamic Pivot Point calculations, assisting traders in pinpointing potential price reversal zones. This feature is especially valuable for scalpers and day traders who need to make quick decisions based on reliable price levels.
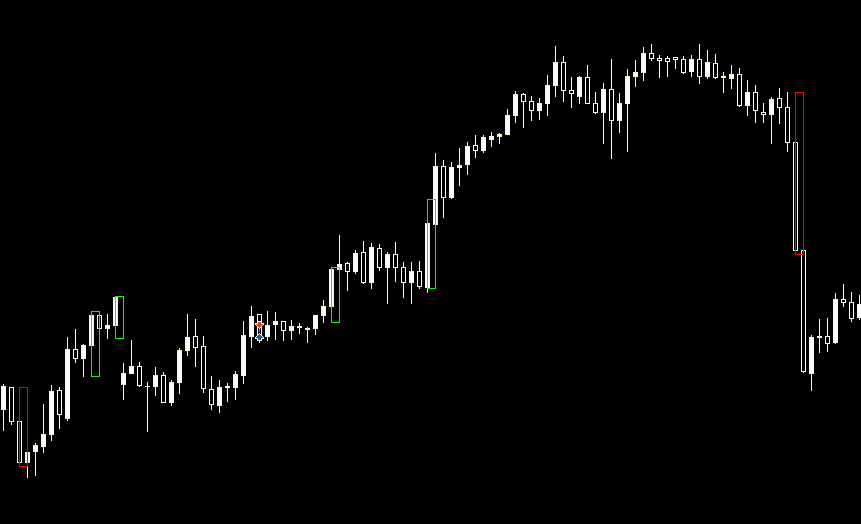
High Volume Bars
High Volume Bars detect moments when trading volume significantly exceeds average levels, often indicating institutional interest or market-moving events. By tracking these, Makuchaku Super Order Block lets traders see where the "smart money" is flowing, giving them an edge in anticipating powerful market moves before they happen.
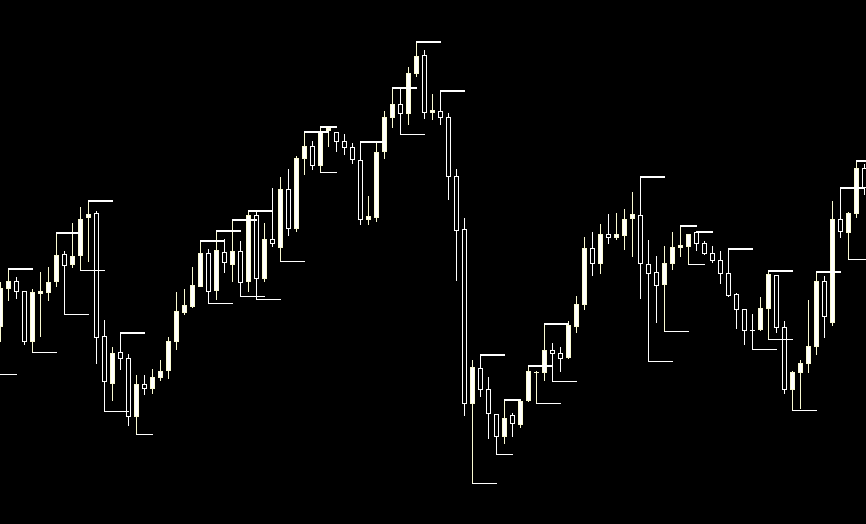
Break of Structure (BOS)
The Break of Structure (BOS) indicator identifies when price action breaks key support or resistance structures, signaling potential trend shifts. Makuchaku Super Order Block’s BOS feature alerts traders to these critical moments, making it ideal for capturing trend reversals or confirming trend continuations, boosting accuracy and timing in trade execution.
Premium and Discount Levels
Premium and Discount levels guide traders in identifying where price is trading relative to a fair value range. By distinguishing between premium and discount zones, Makuchaku Super Order Block enables traders to identify overbought and oversold conditions, giving them the ability to find optimal trade locations in alignment with market sentiment.
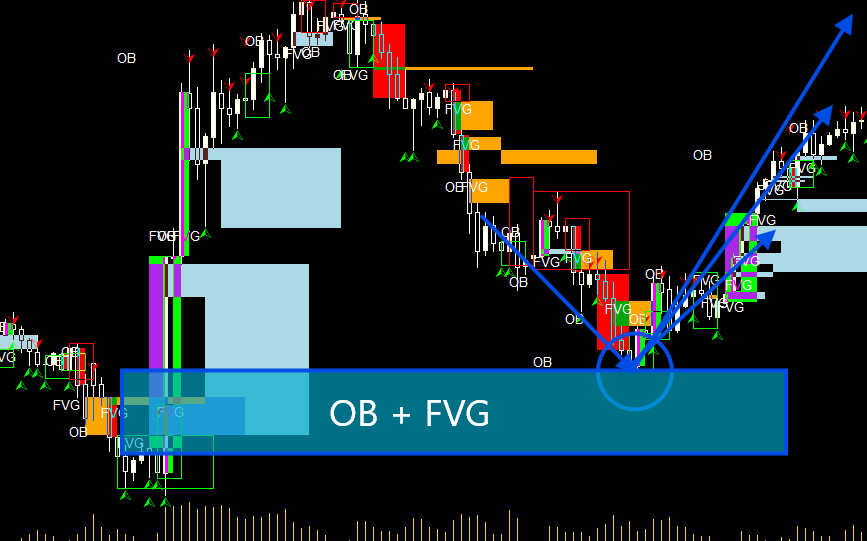
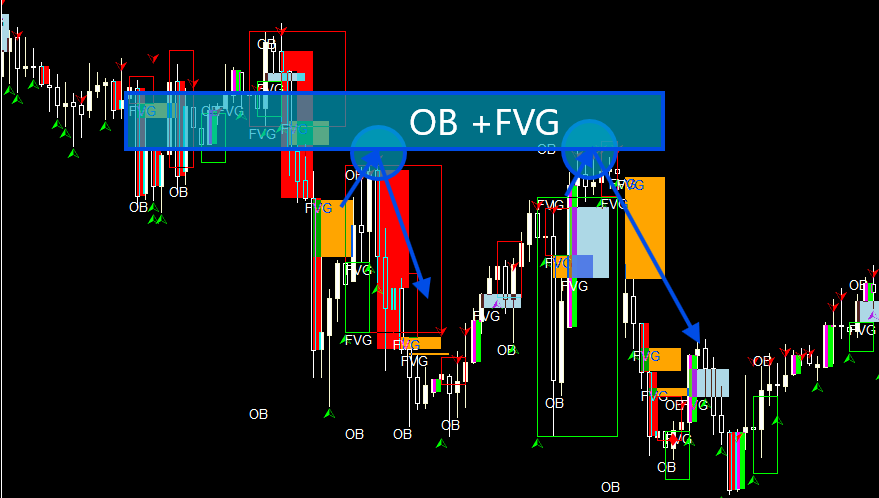
OBFVG Overlap
The OBFVG indicator’s unique OB and FVG Overlap feature highlights areas where Order Blocks and Fair Value Gaps converge, creating super zones of liquidity and heightened trading opportunities. These overlap zones are high-probability trading areas, allowing traders to pinpoint entries with even greater accuracy.
Promo Price: $120 until 3/31/2025 !!! Final Price: $299
Why Makuchaku Super Order Block is a Game-Changer for Every Trader
The Super Order Block indicator combines the insights of multiple leading indicators into one powerful tool, designed to give traders a market edge that’s simply unmatched. No more juggling between indicators – with OBFVG, you have all the critical insights you need at a glance. This tool provides a level of accuracy and real-time responsiveness that makes it the best indicator of 2024.
With OBFVG, you’re not just reacting to the market; you’re anticipating it. The all-in-one functionality saves time, simplifies analysis, and significantly enhances decision-making. This is an absolute must-have for every trader looking to trade like a pro.
Experience the OBFVG Super Indicator – the most advanced, trader-focused indicator of the year. If you're serious about trading success, Makuchaku Super Order Block is the edge you need to elevate your performance and capitalize on the market’s movements with precision and confidence.

It makes MT5 very very slow. But I love it on Trading view, not MT5.