RaysFX Forecaster
- 指标
- Davide Rappa
- 版本: 1.90
- 激活: 5
RaysFX Forcaster è un indicatore avanzato per MetaTrader 4, progettato per fornire previsioni accurate del mercato. Questo indicatore utilizza un algoritmo sofisticato per calcolare i valori futuri basandosi su una serie di parametri configurabili dall'utente.
Caratteristiche principali:
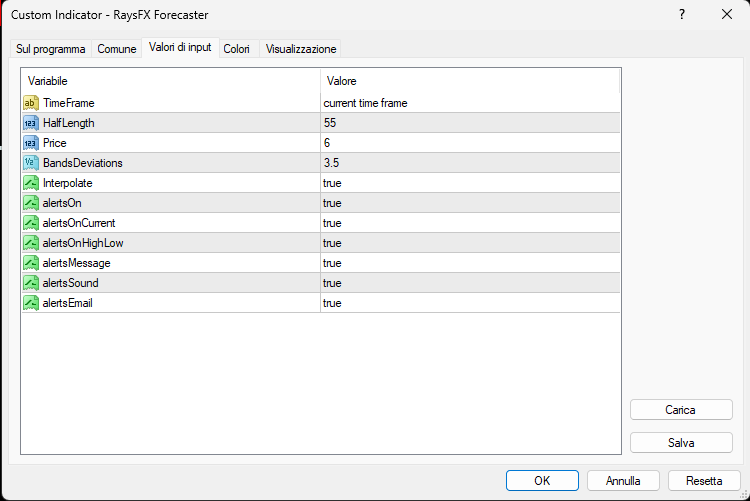
- TimeFrame: Permette all'utente di impostare il timeframe desiderato. Supporta diversi timeframes come M1, M5, M15, M30, H1, H4, D1, W1 e MN.
- HalfLength: Questo parametro determina la lunghezza della metà del canale del prezzo.
- Price: L'indicatore utilizza il prezzo ponderato per i suoi calcoli.
- BandsDeviations: Questo parametro determina la deviazione delle bande dall'equilibrio del prezzo.
- Interpolate: Se impostato su true, l'indicatore interpolerà i valori mancanti.
- Alerts: L'indicatore ha diverse opzioni di allarme che possono essere attivate o disattivate dall'utente.
L'indicatore RaysFX Forcaster è un potente strumento per qualsiasi trader che cerca di ottenere un vantaggio nel mercato Forex. Con la sua capacità di prevedere i movimenti futuri del mercato, questo indicatore può essere un prezioso aggiunta alla tua strategia di trading.
Consigli:
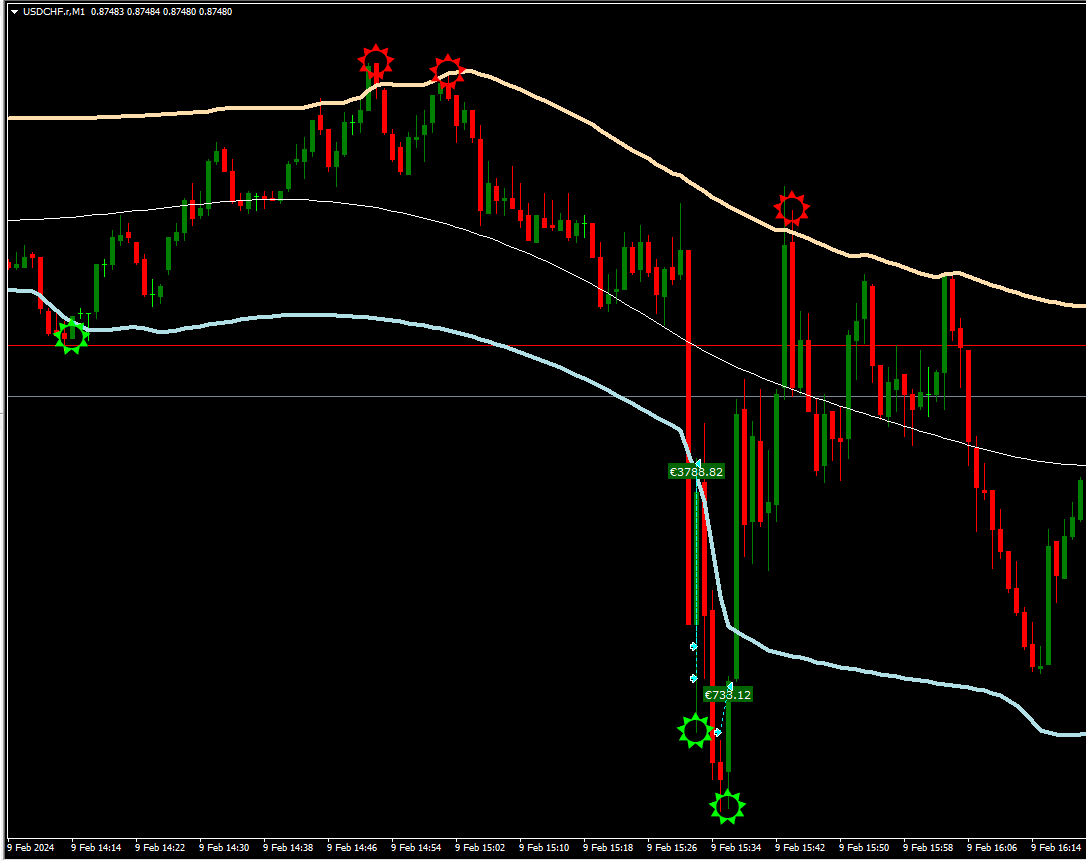
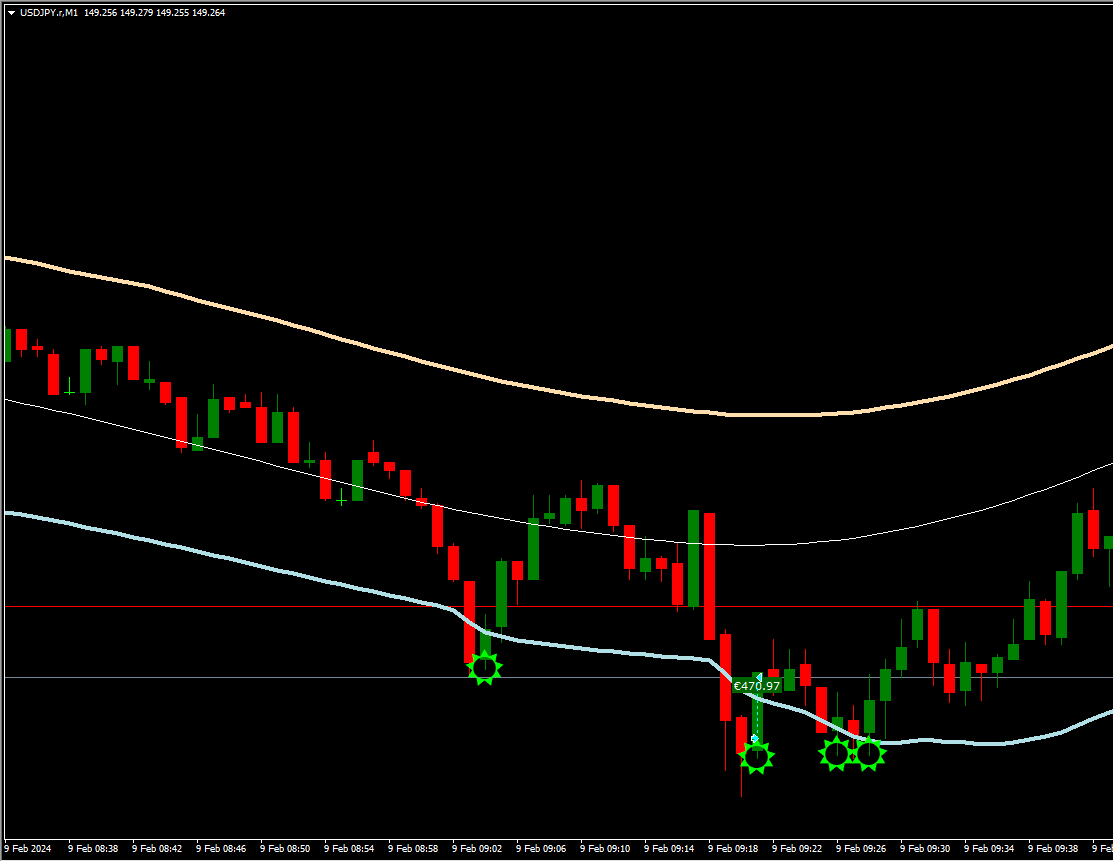
TF → M1
TP e SL (1) → [se usati statici] usate un rapporto 1:1 o 2:1 (es: TP = 5 pip / SL = 2.5 pip)
TP e SL (2) → [se usati dinamici] potete considerare di chiudere il trade dopo 1 candela (1 minuto)
TP e SL (3) → [se usati dinamici] potete chiudere sulla middle-line (vale sia come TP che SL)