Win rate signal Echidna
- 指标
-
Eve sense Co., Ltd.
 我在过去的8年里,在一家从事外汇和期货业务的公司工作。
之后,我在一个游戏开发公司学习了7年,并最终创立了自己的游戏开发公司。
在公司成立后,我们除了致力于大型知名IP的游戏开发,还计划在内部进行指标和EA(专家顾问)的开发。
为此,我们经历了5年的试错和探索,目前正在全力进行实施。
由于我们专注于游戏和系统开发,公司拥有众多开发人员和调试人员,我们致力于高精度的开发和无故障的实施。
我将向您呈现一个"美妙的新世界"。 - 版本: 1.21
- 激活: 10
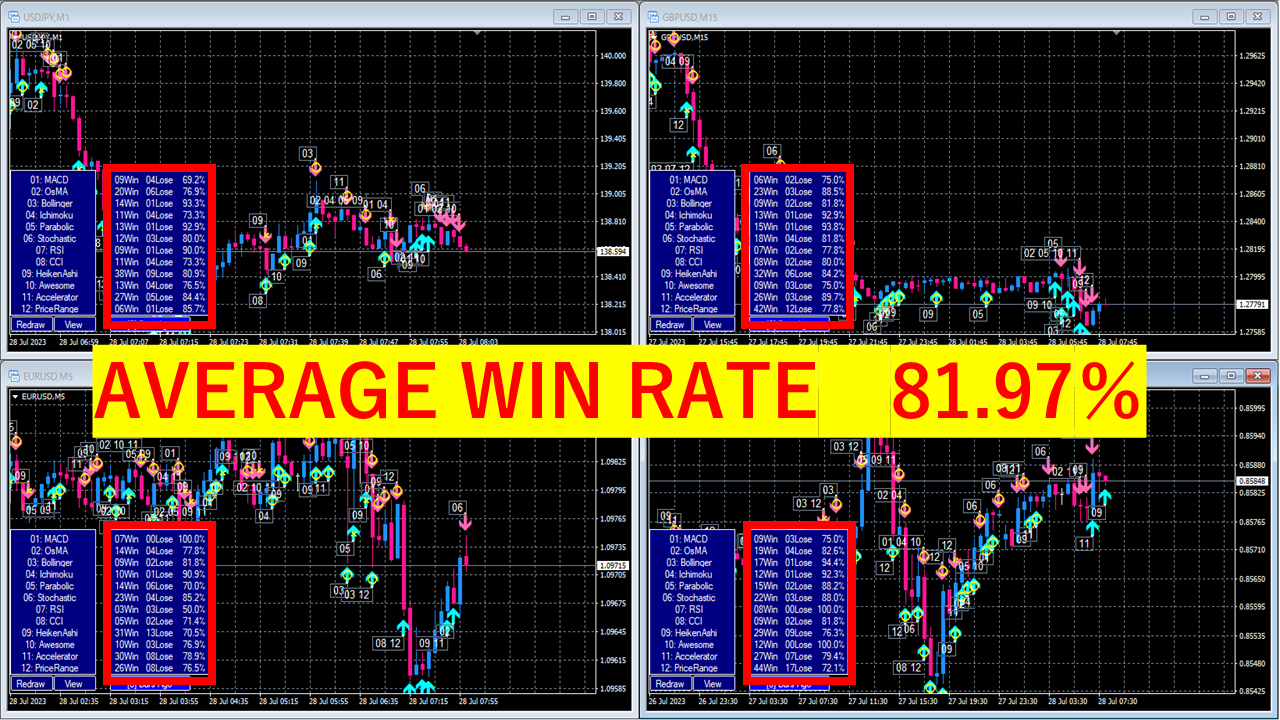
■ 包含 12 种技术分析! 配备胜率计算系统的指标
【指标特点】
该指标可以让您通过信号标志直观、清晰地确认12种正常的技术分析。
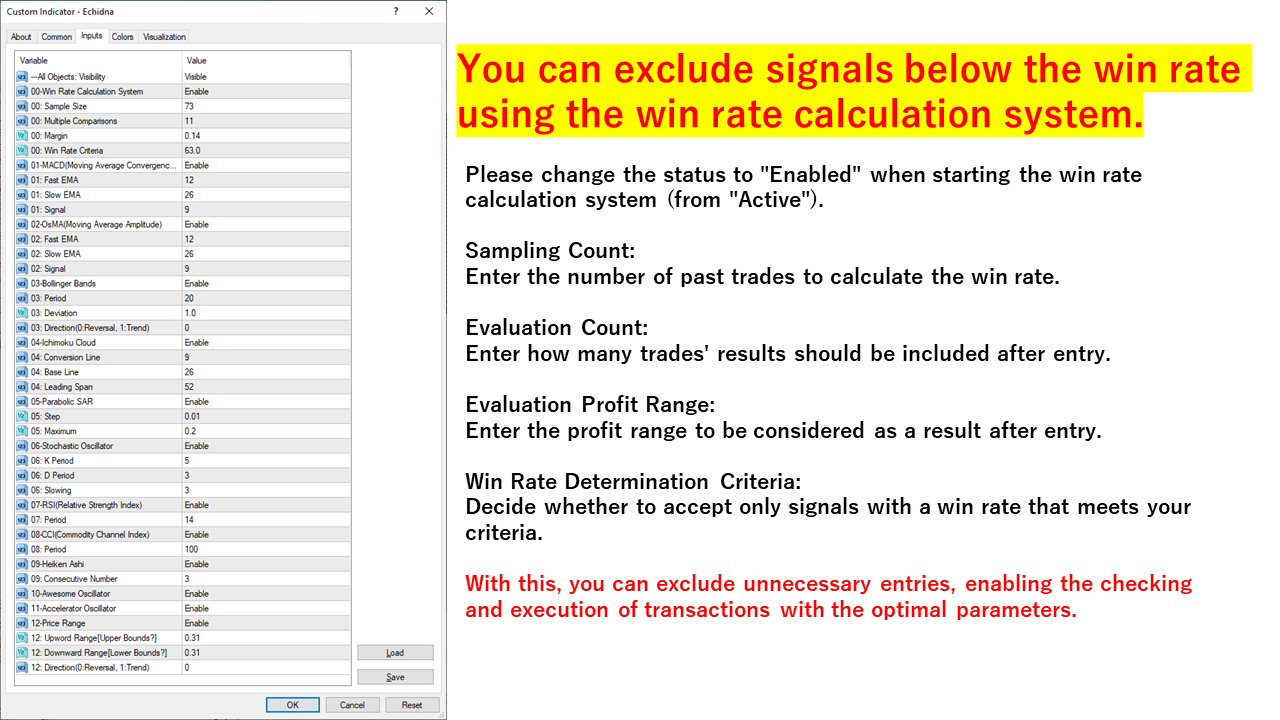
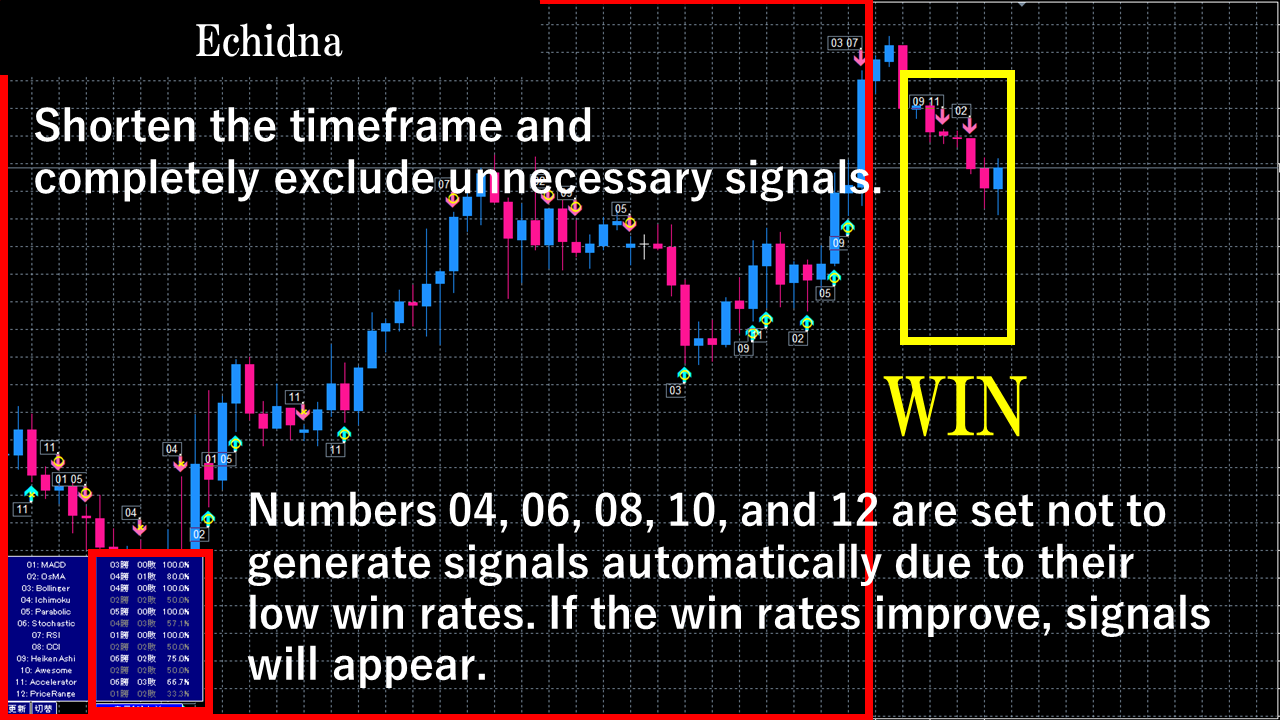
此外,它还具有自动胜率确定系统,可以检查当前参数是否合适,并避免在胜率较低时发出信号。
这减少了不必要的入场,并允许您仅在胜率较高时进行交易。
【重要说明】
・不可重新涂装。 可使用从 1 分钟到每周的图表。
・无货币限制。 适用于所有货币对。
・计算胜率的能力。
・仅当达到预定胜率或更高时才会产生信号。
・优化减轻负载! 适合长期操作和9种货币对同时使用。
・作为众所周知的指标,它允许在跟踪信号的同时进行学习。
・调试器已支持并验证调试以解决任何问题。
【ECHIDNA箭头符号说明】
ECHIDNA箭头指标是一种方便的工具,通过“箭头指标”提供全球著名的12种技术分析。
它的设计易于使用,允许单独的参数设置和删除不必要的指示器。
它根据您认为重要的技术方面使用箭头符号来指导您。
特征:
・通过“箭头符号”提供12种指标分析。
・检查胜率并仅在达到预定胜率或更高时显示信号。
・优化减轻负载,实现长期使用。
支持的指标:
01-MACD(移动平均线趋同分歧)
02-OsMA(移动平均振荡器)
03-布林线
04-一目云
05-抛物线转向指标(停止和反转)
06-随机震荡指标
07-RSI(相对强度指数)
08-CCI(商品通道指数)
09-Heiken Ashi(平均酒吧)
10-很棒的振荡器
11-加速器振荡器
12-价格范围
ECHIDNA 箭头标志指标是交易者的强大工具,支持高效、准确的交易。
无论如何,让我们获得这个梦幻般的指标,并以交易成功为目标!