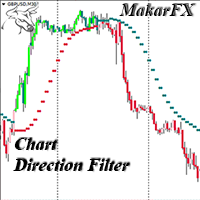
Chart Direction Filter

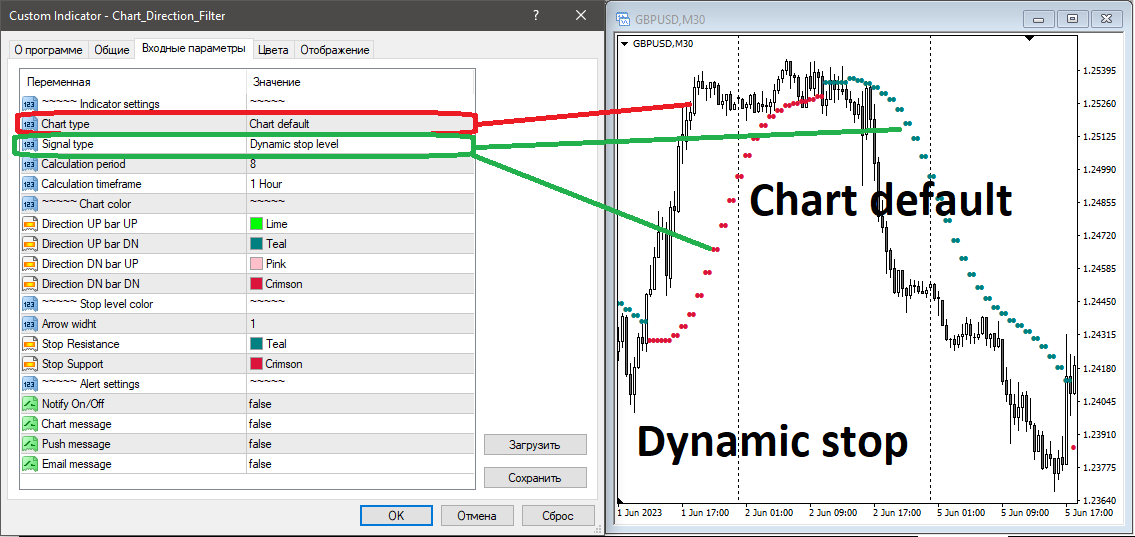
The indicator shows the Buy/Sell direction.

The calculations use the opening prices and their rate of change for the billing period - "Calculation period"

MTF indicator - "Calculation timeframe", no repaint - NRP.

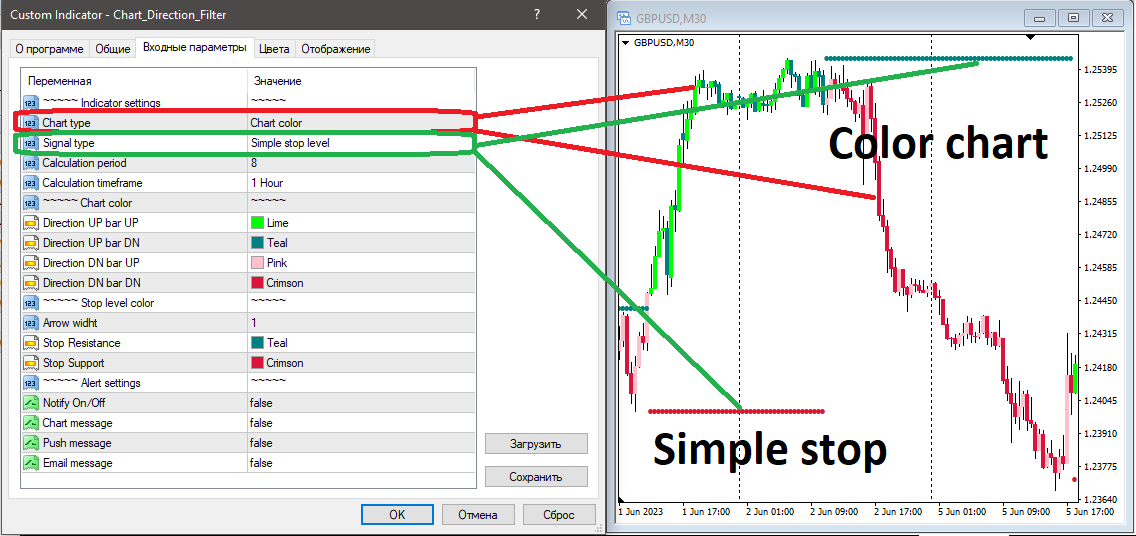
Two display types: "Chart default" или "Chart color"

For "Chart color" color customization available: "Bar color"

Two types stop levels: "Simple stop level" or "Dynamic stop level "

Color settings: "Stop level color"

Alerts available: "Chart message", "Push message", "Email message"

For EA:

direction

iCustom(_Symbol,timeframe,shot_name,0,Plain,Simple/Dynamic,period,timeframe,0,0);

more than "0" - Buy, less than "0" - Sell

stop levels

iCustom(_Symbol,timeframe,shot_name,0,Plain,Simple/Dynamic,period,timeframe,6,0);

stop Resistance

iCustom(_Symbol,timeframe,shot_name,0,Plain,Simple/Dynamic,period,timeframe,7,0);

stop Support
推荐产品
Introduction to Fractal Pattern Scanner Fractal Indicator refers to the technical indicator that makes use of the fractal geometry found in the financial market. Fractal Pattern Scanner is the advanced Fractal Indicator that brings the latest trading technology after the extensive research and development work in the fractal geometry in the financial market. The most important feature in Fractal Pattern Scanner is the ability to measure the turning point probability as well as the trend probabi
FiboPlusTrend
Sergey Malysh
4.5 (2)
A ready-made trading system based on automatic construction and maintenance of Fibonacci levels for buying and selling on any instrument (symbol) and on any period of the chart. Determination of trend direction (14 indicators). The display of the trend strength and the values of the indicators that make up the direction of the trend. Construction of horizontal levels, support and resistance lines, channels. Choosing a variant for calculating Fibonacci levels (six different methods). Alert system
Cloud Power
Andriy Sydoruk
Implementation of indication of trend movement with moments for potential stops in the Cloud Power indicator. The transition to the shadow warns of a possible reversal. The entry of the price inside the shadow speaks of a flat movement. The indicator tracks the market trend with unmatched reliability, ignoring sharp market fluctuations and noise around the average price. Simple, visual and efficient use. The indicator does not redraw and does not lag. It can be easily used as an independent t
本指标是实践实战交易完善的波浪自动分析的指标 !  案例... 注: 波浪分级用西方叫法不习惯,因受到缠论(缠中说禅)命名方式习惯的影响,我是将基础波浪命名为 笔 ,将二级波段命名为 段 ,同时具有趋势方向的段命名为 主趋段 (以后笔记中都是这种命名方式,先告知大家),但是算法上和缠论关系不大切勿混淆.反映的是本人分析盘面总结的 千变万化纷繁复杂的运行规律 . 对波段进行了标准化定义,不再是不同人不同的浪  ,    对人为干扰的画法进行了排除,在严格分析进场起到了关键的作用 . 使用这个指标,等于将交易界面提升美感,抛弃最原始的K线交易带你进入新的交易层次.如果不是为了交易,在宣传上也将使客户观感提升层次. 指标内容: 1. 基础波浪 (笔) : 首先我们找出了价格波动过程中的基础波动拐点,当然他的有序性低,为下一步的计算提供基础. 2. 二级波段( 段 ) :在基础波浪的基础上,通过算法分析得到层级更明显的二级波段,二级波段为波浪提供了分析基础 3. 波浪( 浪 ): 有着更清晰的趋势,更清晰直观的方向.分析一个波浪是否延续,需要看二级波段的形态,分析二级的构成,可以得出波浪
The indicator plots flexible support and resistance levels (dots). A special phase of movement is used for construction. Levels are formed dynamically, that is, each new candle can continue the level or complete it. The level can provide resistance or support to the price even where it is no longer there. Also, support and resistance levels can change roles. The importance of levels is affected by: the amount of time the level is formed and the number of touches. The significance of these lev
Boba Binary
Anthonius Soruh
5 (1)
Result look on  https://t.me/BonosuProBinary Pair : All Forex Pairs Time Frame : M1 Expaired : 1-2 Minutes Trade Time Once Time a Day Backtester, Alert Avaliable Average Signals Generate 5 - 20 Signals All Pair A Day Broker Time Zone GMT+3 Default Setting [Example Broker GMT+3 : Alpari, FBS, XM] Support Broker : Deriv, IQOption, Alpari, Binomo, Olymtrade, Qoutex, GCoption, etc Support Auto Trading : MT2 Trading, Binary Bot, Intrade Bot, Binomo Bot, Olymptrad Bot, MX2 trading, Price Pro, etc Ind

Cota Binary
Anthonius Soruh
5 (2)
Result look on  https://t.me/BonosuProBinary Pair : All Forex Pairs Time Frame : M1 Expaired : 1-2 Minutes Trade Time Once Time a Day Backtester, Alert Avaliable Average Signals Generate 5 - 20 Signals All Pair A Day Broker Time Zone GMT+3 Default Setting [Example Broker GMT+3 : Alpari, FBS, XM] Support Broker : Deriv, IQOption, Alpari, Binomo, Olymtrade, Qoutex, GCoption, etc Support Auto Trading : MT2 Trading, Binary Bot, Intrade Bot, Binomo Bot, Olymptrad Bot, MX2 trading, Price Pro, etc Ind
Note : The slow loading of the indicator issue has been addressed . This new version loads fast and does not slow the platform. Version 1.3 : We have updated the indicator to include an historical bar scanning option . So instead of scanning all bars in the history (which can make the indicator slow sometimes ) , you can select the maximum number of bars it can scan which can increase the performance and make the indicator faster. This indicator scans the 1-3 Trendline pattern . The indicator i
The trader uses the Trend for Neuro indicator to determine the market situation. This is a trending algorithm that is convenient to download, install and use. The algorithm with acceptable accuracy generates input signals and output levels. Strategy for trend trading, filtering and all the necessary functions built into one tool! By launching the indicator, the user will see only two types of arrows that can change color to blue during an uptrend, to red during a downtrend there is no uncertaint
Free Lotus
Christophe Godart
Due to the huge success of the limited free version, the now low priced LOTUS version will continue being updated in the future. Optimal for Binary Options and Forex. For beginners and intermediates. Lotus is 100% non repaint. The strategy is based on 4 ADX parameters, including pivot points and candle patterns.  It is recommendable to combine the arrow with an moving average, Elliot waves indicator or Parabolic SAR. The main goal was to  keep it as simple as possible ! No useless oscillators.
Forecast PRO MT4
Gesang Pangestu
ForecastPro is a price projection indicator based on historical pattern similarity. In simple terms, it searches for past price segments that closely resemble the current price pattern, then “borrows” the subsequent movement from that historical pattern and projects it forward. Key Features Data Source You can choose which price series is used for matching: Open, High, Low, Close, HL2, HLC3, or OHLC4. The better the source matches your analysis style, the more relevant the results. Training Data
Reversal Zone with Alert
Godwin Edward Enyali
ReversalZones Pro — 动态日内波动率与反转点分析指标 ReversalZones Pro 是一款专为 MetaTrader 4 设计的机构级日内波动率与枢轴点预测指标。与依赖移动平均线或平滑振荡器的传统滞后指标不同,ReversalZones 根据统计日幅扩展和斐波那契区间比例,在每个交易日开盘时即可精确计算并预测供需区和均值回归区域。 无论您是针对极值过度扩张进行 均值回归交易(反转) ,还是追踪突破动能的 突破延续交易 ,ReversalZones 都能结合机构级影线过滤机制,为您提供精确且不重绘的入场信号。 核心功能与优势 无滞后预测型区域绘制: 在开盘时根据日波幅( $High_{D1} - Low_{D1}$ )及斐波那契比例(38.2%、61.8% 和 100%)自动计算并绘制当日关键位置。 机构级拒绝影线过滤: 仅当价格触及关键边界 并且 收出强力拒绝影线(可通过 InpMinWickPercent 自定义)时才会触发信号,有效过滤盘整期的伪信号。 双重策略引擎(反转与突破): 反转信号: 当价格在 38.2% 触发线或 61.8%–100% 供需框受阻
Super trend is one of the best trend indicators in metatrader 4 (MT4). Triple SuperTrend indicator is an indicator that consist of three super trend indicator that can be aranged. This indicator is built by mql4 language and doesn't provided by MT4 platform. Highly recommended using EMA SuperTrend Strategy Indicator if you want to get better result in here: https://www.mql5.com/en/market/product/91664 This indicator is easy to use, power full and has many benefits, there are: Using three indic
FREE
Introduction to Harmonic Volatility Indicator Harmonic Volatility Indicator is the first technical analysis applying the Fibonacci analysis to the financial volatility. Harmonic volatility indicator is another level of price action trading tool, which combines robust Fibonacci ratios (0.618, 0.382, etc.) with volatility. Originally, Harmonic Volatility Indicator was developed to overcome the limitation and the weakness of Gann’s Angle, also known as Gann’s Fan. We have demonstrated that Harmonic
DayLevelsSignalPro
Vladimir Chebonenko
The MT4 " DayLevelsSignalPro " indicator . Signal Indicator – generates the most accurate buy / sell signals . Noise filtering indicator  – reduces false signals . Signal information with a clear , understandable and visually convenient view . User- friendly graphical interface ( colors , sound notifications , customization options ) . - Generation of a breakdown signal for significant peaks of the Current day . - Generation of a signal for the breakdown of the previous Day 's Level - Generation
A useful scanner/dashboard that shows the RSI values for multiple symbols and time-frames. It can be easily hidden/displayed with a simple click on the scanner man top left of the dashboard. You can input upper and lower RSI values and the colours can be set to show when above/below these values. The default values are 70 and 30. There are also input colours for when the RSI is above or below 50 (but not exceeding the upper/lower levels Symbols and time-frames are input separated by commas.
产品简介 Auto-Trading Plan Generator MAX 是一款专为   MT4 和 MT5   双平台设计的主图波段预示交易系统。它创新性地融合了自定义随机振荡器、真实强度指数(TSI)和相对强弱指标(RSI)三大分析引擎,构建了一套五层信号体系——低吸预警(Low Buy)、高抛预警(High Sell)、确认做多(Buy)、确认做空(Sell)和顶部警示(Top)。其中低吸和高抛作为前瞻性预警信号,帮助交易者提前感知超卖反弹和超买回落机会;Buy 和 Sell 作为经 TSI 动量确认的高置信度入场信号,触发时同步绘制完整的交易计划面板;Top 作为超买区回落警示,提醒持仓者注意风险。该指标将预警、确认、计划生成和风险管理融为一体,是构建多层次波段交易系统的理想主图工具。 核心功能 五层信号体系与分层决策架构 本指标最核心的设计理念是「预警先行、确认跟进、计划落地」。系统内部运行三大独立分析引擎:第一层为自定义随机振荡器,通过加权价格与近期极值的相对位置计算超卖超买状态,当快速线与慢速线在超卖区发生金叉时触发 Low Buy 预警(浅红色向上箭头),在超买区发生
MarketTrend
Ivan Simonika
This indicator will provide you with everything you need in order to overcome losses due to human emotions. The indicator determines the moments of a trend reversal and the direction of its movements. This development is equipped with the most modern, adaptable trading algorithms. The main secret of short-term trading is to have information on when to enter a deal. The indicator works great on all timeframes and informs the trader about the most successful moments of buying or selling a currency
My indicator is 1000%, it never repaints, it works in every time period, there is only 1 variable, it sends notifications to your phone even if you are on vacation instead of at work, in a meeting, and there is also a robot version of this indicator With a single indicator you can get rid of indicator garbage It is especially suitable for scalping in the m1 and m5 time frames on the gold chart, and you can see long trends in the h1 time frame.
RSI Divergence Finder
Segundo Calvo Munoz
RSI Divergence Finder Indicator will help you to find Classic Divergences between your typical RSI values and the Chart Prices as potential points of actual Trend Reversion or Pull Backs to increase your positions as per the current Trend. In some computer/VPS with old microprocessors or low RAM size, when you launch this Indicator (attach it, change settings, reset or even timeframe change) as it analyze the Chart to avoid refreshing what is not changing, it is possible to experience a bit of l
Introduction This indicator detects volume spread patterns for buy and sell opportunity. The patterns include demand and supply patterns. You might use each pattern for trading. However, these patterns are best used to detect the demand zone (=accumulation area) and supply zone (=distribution area). Demand pattern indicates generally potential buying opportunity. Supply pattern indicates generally potential selling opportunity. These are the underlying patterns rather than direct price action. T
VWAP indicator for MT4
Renaud Herve Francois Candel
Moving VWAP Indicator Moving VWAP is an important indicator drawing the Volume-Weighted Average Price (VWAP). The VWAP is a reference used by institutional traders and acts as a level of support / resistance. If price is above VWAP then means market is bullish. If price is below VWAP then means market is bearish. It can be used to enter in the market with low risk (near VWAP) and also identify the correct direction of the market. The Moving VWAP is as simple as a Simple Moving Average. The m
This product works by detecting trend opportunities. So as shown in the screenshot when The indicator shows an upward arrow it shows the market is on an uptrend and when the indicator Shows a downward arrow it shows the market is on a downward direction. What makes this indicator Special is that it has additional signals just below the arrow signals. It is up to the trader to be  Creative and combine these signals with the arrow signal to get accurate forecasts.
Dear traders I am happy to introduce to you my new tool called "Brilliant Oscillator" Indicator. This is one of the indicators that can be used as a stand alone indicator. WHAT I LIKE ABOUT THIS TOOL IS Fast and reliable signals Purpose The purpose of this tool is to assist both newbie and Advanced traders to analyze the market with high level of accuracy in both bearish and bullish market trends. The inputs In the input section you will be able to change colors of the indicator only. Currency p
Rsi bands indicator
Levi Kevin Midiwo
RSI bands indicator is a mt4 indicator that shows various levels to enter trades based on market conditions. It consists of the below buffers; Yellow buffer Blue buffer White buffer When the yellow buffer is above blue buffer the market is trending up good place to open buy order. When the blue buffer is above yellow buffer the market is trending downwards good time to place sell order. Also another alternative scenario is when yellow buffer is above upper white band buffer indicates strong uptr
In the context of trading,   Malaysia SNR   (Support and Resistance) refers to the technical analysis of   support and resistance levels   in financial markets, particularly for stocks, indices, or other assets traded. There are three type of Malaysia SNR level Classic , GAP and Flipped 1. Classic Support   is the price level at which an asset tends to stop falling and may start to rebound. It acts as a "floor" where demand is strong enough to prevent the price from dropping further. Resistance
The indicator determines a special pattern of Joe Dinapoli. It gives very high probability buy and sell signals. Indicator does not repaint. Indicator Usage Buy Signal ''B'' Entry : Market buy order at signal bar close Stop : Low of signal bar Take Profit : First swing high Sell Signal ''S'' Entry : Market sell order at signal bar close Stop : High of signal bar Take Profit : First swing low Indicator Parameters Fast EMA : External Parameter (should be kept as default) Slow EMA: External Parame
Drawing Pack
John Louis Fernando Diamante
4 (1)
This indicator provides several drawing tools to assist in various methods of chart analysis. The drawings will keep their proportions (according to their handle trendline) across different chart scales, update in real time, and multiple drawings are supported. # Drawing Option Description  1 Grid box draggable boxed grid, user defines rows x colums, diagonal ray option  2 Grid partial or fullscreen grid, sized by handle line  3 Grid flex a diagonal grid, sized and sloped by handle line  4 Cyc
MoveWave
Andriy Sydoruk
MoveWave - Moving waves are very handy indicators for determining pivot levels. Most Forex traders make decisions based on technical analysis. This type of analysis determines patterns and trends in the market. With the help of complex mathematical equations that are combined and made out in the form of this indicator, the trader will be able to more accurately determine the price reversal levels. Wave theory mathematically represents various behavioral models of the market. It is used as the ba
Swing High Low Fibonacci
Frank Wesley Iii Mccallister
This indicator identifies the major and minor swing high and low points on a chart. It then takes the most recent swing and draws a fibonacci pattern of retracement and extension levels to give you an idea of where price may move next. It allow allows you to set a pair of moving averages to help identify the direction of the overall trend. There are configuration parameters for the major and minor swing and the moving averages.
该产品的买家也购买
Trend SniperX MT4
Sarvarbek Abduvoxobov
5 (5)
Trend Sniper X 是一款用于 MetaTrader 5 的多周期趋势追踪指标,旨在帮助交易者清晰、精准地识别趋势方向及潜在的反转点。 适用于 MT5: https://www.mql5.com/en/market/product/181101 价格信息: 当前价格为促销价,随着后续更新和新功能的推出,价格可能会发生变动。 Code2Profit 频道 通过多周期分析掌控市场! 如何使用 Trend Sniper X 最大化胜率:关键规则与交易时段技巧 技术规格 交易平台 MetaTrader 5 指标类型 多周期趋势指标 运行时间周期 任意图表周期,支持独立选择更高周期(M1–MN1) 主要交易品种 外汇、黄金 (XAUUSD) 及其他 CFD 差价合约 推荐账户 任何账户类型 可视化呈现 彩色趋势 K 线(买入/卖出/弱势/转变)+ 买入/卖出信号箭头 附加模块 市场交易时段框(悉尼、东京、伦敦、纽约) 核心功能 多周期趋势分析: 将更高周期的趋势方向直接投影到当前图表上,提供清晰的宏观视角。 弱势/不确定 K 线检测: 高亮显示趋势状况不明确的 K 线,帮助交易者远离震
SR Liquidity
Oleg Rodin
5 (2)
SR Liquidity 是一款旨在揭示市场流动性高度集中且价格反应最剧烈的隐蔽区域的交易指标。这些特殊的流动性区域充当着强有力的支撑位与阻力位,为您清晰呈现市场最可能发生反转的位置。 SR Liquidity 指标并非简单地绘制常规的支撑/阻力线,而是通过分析实际的价格行为,识别买卖压力积聚的区域。这些区域实际上是推动市场真实波动的流动性池。通过在图表上直观呈现这些区域,该指标能助您在价格反应发生前预判走势——这意味着它实际上能够预测价格方向可能发生的变化。它将原始的价格行为转化为清晰且具实操价值的市场蓝图,标示出那些可能成为市场转折点的关键价位。 该指标适用于任何交易品种和时间周期——包括外汇、指数、金属、加密货币等。支持任意时间周期。 购买后请联系我,以获取交易指南及免费赠送的优质附加指标!
GoldRush Trend Arrow Signal
Kirk Lee Holloway
5 (2)
GoldRush 趨勢箭頭信號 GoldRush 趨勢箭頭信號 指標為 XAU/USD 中的高速、短期短線交易者提供精確、實時的趨勢分析。 專為1分鐘時間框架設計,此工具顯示方向箭頭以明確顯示入場點,使短線交易者能在波動市場中自信操作。 該指標包含主要和次要警示箭頭。主要信號為白色和黑色方向箭頭,用於指示趨勢方向的轉變;次要信號為藍色和紅色箭頭,用於確認主要箭頭指示的方向並提示潛在交易入場點。 注意:當趨勢方向發生變化後僅出現一個主要警報箭頭時,請注意可能會出現多個次要藍/紅箭頭。次要信號將在滿足信號標準的任何蠟燭圖後出現,因此在長期趨勢移動中,螢幕上將顯示大量次要箭頭(如附帶的截圖所示)。您可在設置中開啟或關閉任一箭頭類型。 以下是我使用此指標進行交易的方式: - 對於買入入場,我會耐心等待白箭頭在蠟燭收盤時出現,並在下一根可用蠟燭收盤時出現藍箭頭時進行買入交易。 - 對於賣出入場,我會耐心等待黑箭頭在蠟燭收盤時出現,並在下一根可用蠟燭收盤時出現紅箭頭時進行賣出交易。 - 獲利了結/止損設置由使用者自行負責,但我個人使用最低R:R為1:2,並發現這在倫敦/紐約開盤等
Atomic Analyst
Issam Kassas
5 (14)
Atomic Analyst — MetaTrader 4 如有产品、设置或技术支持方面的问题,请直接在 MQL5 上给我发消息。 该指标将复杂的市场计算转换为简单的视觉信号、彩色K线、趋势读数、止损水平和多个止盈区域,使交易者能够快速理解并应用于真实市场环境。 主要交易用途: 剥头皮和日内交易: 专为快速决策、清晰箭头、提醒、K线颜色和结构化进出场区域而设计。 日内交易和波段交易: 帮助交易者利用趋势方向、强度、动能和多周期分析跟随更大的市场波动。 主要功能: • 价格行为、强度和动能分析 • 多周期趋势扫描器 • 总体趋势百分比计算 • 买入和卖出箭头 • 止损和多个止盈水平 • 最多 5 个基于斐波那契的止盈水平 • 移动止损逻辑 • 用于趋势和动能的彩色K线 • 实时提醒到终端、手机和电子邮件 • 现代化用户友好面板 • 实时交易监控 • 买入和卖出潜力显示 • 总交易数量显示 • 每日、每周和总利润显示 • 每日佣金计算 • Bid、Ask 和点差显示 • K线计时器、本地时间和服务器时间 • 终端连接状态 • 账户货币显示 • 可直接从面板控制时间周期 • 可手动使用,
M1 Sniper
Oleg Rodin
4.97 (30)
M1 SNIPER 是一款易于使用的交易指标系统。它是一个专为 M1 时间框架设计的箭头指标。该指标可以作为独立的系统在 M1 时间框架下进行剥头皮交易,也可以作为您现有交易系统的一部分使用。虽然该交易系统专为 M1 时间框架交易而设计,但它也可以用于其他时间框架。我最初设计此方法是为了交易 XAUUSD 和 BTCUSD。但我发现这种方法在其他市场交易中也同样有用。 指标信号既可以顺势交易,也可以逆势交易。我教授一种特殊的交易技巧,帮助您利用指标信号进行双向交易。该方法基于使用特殊的动态支撑位和阻力位区域。 购买后,您可以立即下载 M1 SNIPER 箭头指标。此外,我还为所有 M1 SNIPER 工具用户免费提供下方屏幕截图所示的 Apollo Dynamic SR 指标!这两个指标的组合可以帮助您更轻松、更准确地利用 M1 时间框架进行交易。 购买后请联系我,免费获取交易提示和奖励指标! 祝您交易成功!
Smart Trend Trading System
Issam Kassas
4.8 (10)
Smart Trend Trading System 是适用于 MetaTrader 4 的图表指标,将趋势信息、入场和出场信号以及价格水平集中呈现在同一图表上。 它将 10 多种交易工具 整合到一个系统中,包括趋势检测、反转区域、Smart Cloud、移动止损逻辑、支撑与阻力、K线着色、提醒以及多周期分析。 该系统旨在帮助您应对不同的市场环境: 趋势市场: 识别主要趋势,发现回调,跟随动能,并通过止损指导和移动止损选项寻找更清晰的入场机会。 震荡市场: 识别区间震荡状态,寻找价格反应区域,并在价格触及重要水平时获得更清晰的信号。 剥头皮和日内交易: 使用快速信号、K线颜色、提醒和多周期确认,辅助短线交易决策。 主要功能: • 10 多个指标整合为一个交易系统 • 7 多种策略和信号组合 • 趋势跟随、反转、剥头皮、日内交易和波段交易模式 • 入场和出场箭头 • Smart Cloud • Smart Reversal Zones • 支撑和阻力水平 • Smart Trailing Stop • 多周期趋势分析 • 成交量、趋势和反转K线着色 • 手机、电子邮件和终端提醒 •
Miraculous Indicator Binary & Forex v3 StrategySafe Miraculous Indicator Binary & Forex v3 StrategySafe 是一款专业交易指标,适合希望获得清晰信号、强大确认工具以及结构化交易方式的 Binary 和 Forex 交易者。 v3 版本加入了 MIR Dashboard、Miraculous Confirmation Dashboard、GANN Law、Square of 9 水平线、GANN 角度以及更强的 Forex 分析模式。 核心功能 同时支持 Binary 和 Forex 交易模式。 MIR Dashboard 可快速读取市场状态。 Miraculous Confirmation Dashboard 用于确认交易机会。 GANN Law drawing lines 用于 Forex 市场结构分析。 Square of 9 线条、方向和关键价格水平。 1x1 GANN Angle 用于判断趋势压力。 Entry Information TP 帮助寻找合理止盈区域。 Strateg
PRO Renko System
Oleg Rodin
5 (31)
PRO Renko Arrow Based System for trading renko charts.  准确的信号交易任何外汇工具. 另外,我将免费提供系统的附加模块! PRO Renko系统是RENKO图表上高度准确的交易系统。该系统是通用的。 该交易系统可应用于各种交易工具。 该系统有效地中和了所谓的市场噪音,打开了获得准确反转信号的通道。 该指标易于使用,只有一个参数负责产生信号。 您可以很容易地使算法适应您感兴趣的交易工具和renko酒吧的大小。 我很乐意通过提供任何咨询支持来帮助所有客户有效地使用该指标。 祝您交易成功!购买后,立即写信给我! 我将与您分享我的建议和我的renko发电机。 另外,我将免费提供系统的附加模块!
Neuro Poseidon MT4
Daria Rezueva
4.74 (46)
Neuro Poseidon is a new indicator by Daria Rezueva. It combines precise trading signals with adaptive TP/SL levels - creating best possible trades as a result! Message me and get  Neuro Poseidon Assistant  as a gift to automize your trading process! What makes it stand out? 1. Proven profitability on all assets and timeframes 2. Only confirmed BUY and SELL signals present on the chart 3. Adaptive TP & SL levels generated by the software for each trade 4. Easy to understand - suitable for all
Elliott Wave Trend MT4
Young Ho Seo
4 (7)
Elliott Wave Trend was designed for the scientific wave counting. This tool focuses to get rid of the vagueness of the classic Elliott Wave Counting using the guideline from the template and pattern approach. In doing so, firstly Elliott Wave Trend offers the template for your wave counting. Secondly, it offers Wave Structural Score to assist to identify accurate wave formation. It offers both impulse wave Structural Score and corrective wave Structure Score. Structural Score is the rating to sh
Gann Made Easy
Oleg Rodin
4.84 (172)
Gann Made Easy 是一个专业且易于使用的外汇交易系统,它基于使用先生理论的最佳交易原则。 W.D.江恩。该指标提供准确的买入和卖出信号,包括止损和获利水平。您甚至可以使用推送通知在旅途中进行交易。 购买后请联系我,即可免费获得交易指导和超棒的额外指标! 您可能已经多次听说过江恩交易方法。通常 Gann 的理论不仅对于新手交易者而且对于那些已经有一定交易经验的人来说都是非常复杂的东西。这是因为江恩的交易方法在理论上并不那么容易应用。我花了几年时间来完善这些知识,并将最好的原则应用到我的外汇指标中。 该指标非常易于应用。您所需要的只是将其附加到您的图表并遵循简单的交易建议。该指标不断进行市场分析工作并寻找交易机会。当它检测到一个好的入口点时,它会为您提供一个箭头信号。该指标还显示止损和获利水平。 换句话说,当您像先生一样进行交易时,该指标会为您提供最佳江恩建议。江恩亲自告诉你此时此刻该做什么。但最好的部分是您不需要了解任何有关江恩交易原则的知识,因为该指标会为您完成整个市场分析工作。
PZ Divergence Trading
PZ TRADING SLU
5 (2)
棘手的发现和频率稀缺是最可靠的交易方案之一。该指标使用您喜欢的振荡器自动查找并扫描常规和隐藏的发散。 [ 安装指南 | 更新指南 | 故障排除 | 常见问题 | 所有产品 ] 容易交易 发现常规和隐藏的分歧 支持许多知名的振荡器 根据突破实现交易信号 显示适当的止损和获利水平 可配置的振荡器参数 可自定义的颜色和尺寸 按条形过滤大小差异 实现绩效统计 它实现了电子邮件/声音/视觉警报 为了提供广阔的市场前景,可以使用不同的振荡器在同一张图表中多次加载该指标,而不会产生干扰。该指标支持以下振荡器: RSI CCI MACD OSMA 随机 动量 很棒的振荡器 加速器振荡器 威廉姆斯百分比范围 相对活力指数 由于差异可能会扩大很多,尤其是在外汇市场中,因此该指标产生了转折:它在等待交易突破之前等待donchian突破确认差异。最终结果是带有非常可靠的交易信号的重新粉刷指示器。 输入参数 幅度:用于寻找差异的之字形周期 振荡器-选择要加载到图表的振荡器。 突破期-交易信号的突破期,以柱为单位。 发散类型-启用或禁用发散类型:隐藏,常规或两者。 最小散度单位为条形-最小散度单位为条形
Advanced Currency Strength28 Indicator
Bernhard Schweigert
4.91 (659)
目前40%的折扣 任何新手或专家交易者的最佳解决方案! 这个指标是一个独特的、高质量的、可负担得起的交易工具,因为我们纳入了一些专有的功能和一个新的公式。只需一个图表,你就可以读出28个外汇对的货币强度!想象一下,你的交易将如何得到改善,因为你的交易是在你的手中进行的。想象一下,你的交易将如何改善,因为你能够准确地确定新趋势或剥头皮机会的触发点? 用户手册:点击这里  https://www.mql5.com/en/blogs/post/697384 这是第一本,原版的! 不要买一个毫无价值的崇拜者的克隆品。 特别的 子窗口中的箭头显示强劲的货币势头GAP将指导你的交易! 当基础货币或报价货币处于超卖/超买区域(外盘斐波那契水平)时,在个人图表的主窗口中出现警告信号。 当货币力量从外围区间回落时,回撤/反转警报。 十字星模式的特别警报 可选择多个时间框架,以快速查看趋势! 货币强度线在所有的时间框架中都非常平稳,当使用较高的时间框架来识别总体趋势,然后使用较短的时间框架来确定精确的入口时,效果非常好。你可以根据自己的意愿选择任何时间框架。每个时间框架都由其自身进行了优化。
Fibonacci Trend Marker
Grigoriy Malychenko
斐波那契趋势标记 ( Fibonacci Trend Marker ) 是一种趋势指标,通过使用斐波那契回撤水平分析当前K线相对于前几根K线的最高-最低 (HL) 范围的行为。它通过K线颜色的变化,直观地跟踪趋势强度,提示可能的趋势减弱或反转。 特点: 专为趋势交易者设计,帮助基于斐波那契水平快速识别趋势变化。 在市场波动性充足且有3-5根K线形成明显趋势时,适用于任何时间框架。 K线大小自动适应图表比例,确保缩放时显示正确。 对趋势变化的高度敏感性源于对当前K线的实时分析,使其非常适合在M1和M5时间框架上进行剥头皮交易。 如何交易? 入场: 在前一根已关闭的K线颜色变化后开仓。例如,如果一根K线在红色后关闭为蓝色,表明上升趋势—开启买入 (Buy) 交易。 离场: 当前一根K线的颜色反转时平仓,或在达到目标时平仓,例如趋势方向上的1-2根K线,具体取决于市场波动性。 当前(未关闭)K线的颜色会随报价变化而改变,这对剥头皮交易者尤其有用,可在K线完成前提前平仓。 设置: 周期 (Period) — 设置用于计算的前几根K线的数量(例如3、5、10)。 斐波水平 (Fibo
Supply and Demand Dashboard PRO
Bernhard Schweigert
4.81 (21)
目前八折优惠! 这个仪表板是一个非常强大的软件,可用于多个符号和多达9个时间段。 它是基于我们的主要指标(最佳评论:高级供应需求)。 Advanced Supply Demand 该仪表板提供了一个伟大的概述。它显示。   筛选后的供需值,包括区域强度评级。 区间内和区间外的点位距离。 它突出了嵌套的区域。 在所有(9个)时间段内,它对所选符号发出4种警报。 它是高度可配置的,以满足您的个人需求! 您的利益! 对每个交易者来说,最重要的问题是。 什么是入市的最佳水平? 在强大的供应/需求区域内或附近进入你的交易,以获得最佳的成功机会和风险/回报。 我的止损的最佳位置是哪里? 把你的止损放在强势供应/需求区的下方/上方是最安全的。 我的最佳盈利目标是什么? 你的退出策略和你的进入策略一样重要,了解更高的时间框架图可以帮助你。对于买入,使用下一个供应区作为目标,对于卖出,使用下一个需求区作为目标。在回撤到供应区或需求区时进场,以确保有足够的利润空间,达到更高的时间框架的供应和需求,将增加你的利润。 为什么我们要过滤强区和弱区? 不平衡性越大,价格的变动就
M1 Arrow
Oleg Rodin
4.81 (21)
M1 Arrow 指标基于市场自然交易原则,包括波动性和成交量分析。该指标适用于任何时间框架和外汇货币对。指标中一个易于使用的参数即可让您根据想要交易的任何外汇货币对和时间框架调整信号。 除了基于买卖信号的主要算法外,该指标还内置了多种额外的策略,您可以在输入参数中选择。这些策略无需任何设置。指标会根据您在指标中使用的策略模式自动选择设置。 该算法基于对成交量和价格波动的分析,并使用额外的过滤器。该指标的智能算法仅在两个市场因素结合为一个时才发出信号。该指标计算特定范围的波动,并使用成交量分析来确认波动。 购买后请联系我,即可免费获得我的交易技巧和超棒的额外指标! 祝您在生活的各个方面都取得巨大成功,万事如意!
DayTrader PRO MT4
Davit Beridze
4.6 (10)
DayTrader PRO MT5:  https://www.mql5.com/en/market/product/186222 DayTrader PRO 是一款先进的交易指标,它结合了约翰·埃勒斯 (John Ehlers) 的 Laguerre 滤波器与强大的自动优化引擎。该指标不依赖固定的参数,而是根据最新的市场状况自动搜寻最佳设置,帮助您在无需手动调整的情况下适应不断变化的市场波动。 该指标可生成清晰的买入 (BUY) 和卖出 (SELL) 信号,并提供根据当前市场波动率计算得出的自适应止损 (Stop Loss) 和止盈 (Take Profit) 水平。内置的趋势、效率系数 (Efficiency Ratio)、波动率和蜡烛图过滤功能,有助于剔除低质量的交易设置,从而提高信号的准确性。 实时性能面板会显示当前已优化的设置、利润因子 (Profit Factor)、胜率 (Win Rate)、回撤 (Drawdown) 以及其他交易统计数据。DayTrader PRO 还支持弹出窗口、推送、邮件和声音提醒,确保您不会错过任何交易机会。 主要功能 全自动参数优化 自适应买入
KURAMA GOLD SIGNAL PRO(MT4)— 7层过滤 · 自动止盈止损 · 质量评分 · 信号历史保存 | 完整的XAUUSD交易系统 实时不重绘。信号出现的瞬间,箭头、入场、止盈、止损当场锁定,之后绝不移动。你交易的就是这个实时信号。而且在v7.20中,每一个真正发出的信号都会自动保存,并在重启后精确还原。 购买者专属赠品 购买永久授权,即可免费获得 AI Zone Radar(价值$59)+ 完整PDF手册。在产品价格之外,额外附赠价值$59的赠品。购买后在MQL5上给我留言即可。 AI Zone Radar: https://www.mql5.com/en/market/product/175834 在黄金交易者社区中被实际使用,因精度与易用性而广受好评。 你的难题 —— 以及解决方案 黄金一天波动$30–$50。你知道机会就在那里。但这些情况是否似曾相识: - 入场太早,价格逆行$10后才朝你的方
该指标可识别30多种日本烛台图案,并在图表上突出显示它们。这只是价格行为交易者不能没有的那些指标之一。 一夜之间增强您的技术分析 轻松检测日本烛台图案 交易可靠且通用的反转模式 使用延续模式安全跳入已建立的趋势 指示器不重涂并实施警报 该指标实现了一个多时间框架 仪表板 它检测到的模式太多,以至于图表看起来非常混乱,难以阅读。交易者可能需要禁用指标输入中的不良图案,以使图表更具可读性。 它检测1条,2条,3条和多条样式 它检测逆转,持续和弱点模式 模式可以启用或禁用 看涨模式用 蓝色 标记,空头模式用 红色 标记,中性模式用 灰色 标记。 检测到的烛台模式列表 从1到5小节的突破距离(又名线罢工) 法基(又名Hikkake) 反间隙 三名士兵/三只乌鸦 锤子/流星/吊人 吞没 外上/外下 Harami 由上至下 晨星/晚星 踢球者 刺穿/乌云 皮带托 从1到5小条上升三分/下降三分 田木峡 并排间隙 视窗 前进块/下降块 审议 Marubozu 挤压警报(又称主蜡烛) Dojis 设置 PaintBars 使用条形的颜色打开/关闭图案的突出显示。 DisplayLabels
This is a professional chart indicator designed for traders focused on stability and clear price action. It helps filter market noise and provides clear visual entry and exit zones for your trading decisions. Core Features: Strictly Non-Repainting: The system is built with strict non-repaint logic. What you see on the chart is the true historical performance. Confirmed Signals: Signals are triggered and confirmed only after the candle closes . Once a trading arrow appears on a closed candle, it
Quantum Naked SMC Prime is a streamlined Smart Money Concepts indicator designed for traders who prefer a clean chart, structured market analysis and clear visual trade setups without unnecessary complexity. The indicator combines market structure, liquidity behavior, institutional zones and confirmation logic into a compact analytical framework. Instead of flooding the chart with technical indicators, Quantum Naked SMC Prime focuses on the core elements of price action and Smart Money Concepts
Scalper Inside PRO
Alexey Minkov
4.74 (69)
Scalper Inside PRO 帮你分析日内趋势,在入场前就把交易规划好。核心是三套专属策略,让你更精准地读懂市场。信号一出现,指标就自动判断行情方向并计算关键价位,你能提前看到潜在入场点、预期的止损以及多个止盈位。详尽的绩效统计会展示不同品种和策略在历史上的表现,帮你根据当前行情挑选合适的资产。它既可以作为独立的剥头皮工具,也可以融入你的系统,或者作为你自己 EA 的基础。运行于 MetaTrader 4 平台。 指标会直接在图表上标出入场、三个止盈位 - TP1、TP2、TP3 以及一个可选止损。你甚至可以接入自己的箭头指标,检验它们的统计数据和盈利能力。 购买后请直接联系我,即可获得指标的专属附赠 add-ons、更多关于实盘运用的说明,以及把它正确接入你自己交易系统和 EA 的帮助。 指标主要功能 内置三套专属交易策略,可即时切换。 箭头信号出现后即时计算价位:入场以及 TP1、TP2、TP3 多级目标立刻显示,方便你提前规划交易。开启手动或自动计算后,会显示止损位。 三套策略均内置优化模块:自动把参数适配到当前品种和周期,帮你快速筛选资产(仅在实时状态下可用)。 HTF
The Super Arrow Indicator provides non-repainting buy and sell signals with exceptional accuracy. Key Features No repainting – confirmed signals remain fixed Clear visual arrows: green for buy, red for sell Real-time alerts via pop-up, sound, and optional email Clean chart view with no unnecessary clutter Works on all markets: Forex, gold, oil, indices, crypto Adjustable Parameters TimeFrame Default: "current time frame" Function: Sets the time frame for indicator calculation Options: Can be set
The Extreme point indicator helps in determining the probable price reversal points on the chart. The indicator facilitates the search for points to enter the market with greater accuracy. The indicator displays certain impulses, after which there is a high probability of the price continuing its movement in the same direction. The indicator can be used in conjunction with other indicators for a more accurate detection of the position entry points. The indicator can also be used independently. F
JSL Orderflow Footprint turns every candle into a price ladder that shows how much volume traded on the bid and on the ask at each price level. It highlights diagonal imbalances, stacked imbalance zones, absorption at candle extremes, cumulative delta (CVD), delta divergence and the daily session volume profile, then combines five of these order-flow conditions into a 0–100 confluence score. A signal is only issued on bar close when the score is high, clearly one-sided and confirmed by the candl
Quantum Breakout Indicator PRO
Bogdan Ion Puscasu
4.96 (26)
介绍     Quantum Breakout PRO   ,突破性的 MQL5 指标,正在改变您交易突破区域的方式!   Quantum Breakout PRO 由拥有超过 13 年交易经验的经验丰富的交易者团队开发,旨在通过其创新和动态的突破区域策略将您的交易之旅推向新的高度。 量子突破指标将为您提供带有 5 个利润目标区域的突破区域的信号箭头,以及基于突破框的止损建议。 它既适合新手交易者,也适合专业交易者。 量子 EA 通道:       点击这里 MT5版本:   点击这里 重要的!购买后请私信我领取安装手册。 建议: 时间范围:M15 货币对:GBPJPY、EURJPY、USDJPY、NZDUSD、XAUUSD 账户类型:ECN、Raw 或 Razor,点差极低 经纪商时间:GMT +3 经纪商:IC Markets、Pepperstone with Raw 和 Razor 的点差最低 规格: 不重漆! 最多 5 个建议利润目标区域 建议止损水平 可定制的盒子。您可以设置自己的 Box Time Start 和 Box Time End。 接触 如果您
Titan Z-Score Pro Titan Z-Score Pro, MetaTrader 4 için tasarlanmış profesyonel düzeyde bir istatistiksel göstergedir. Bu, mevcut fiyatın tarihsel ortalama değerinden kaç standart sapma uzaklaştığını kesin olarak hesaplar. İstatistiksel varyans kullanarak, gösterge yatırımcıların duygusal önyargıdan ziyade matematiksel olasılıklara dayalı aşırı yayılmış piyasa koşullarını ve yüksek olasılıklı ortalama geri dönüş bölgelerini belirlemesine yardımcı olur. Temel Özellikler: Akıllı V-Reversal Mantığı
Currency Strength Wizard
Oleg Rodin
4.85 (61)
货币强度向导是一个非常强大的指标,为您提供成功交易的一体化解决方案。该指标使用多个时间范围内所有货币的数据来计算这个或那个外汇对的力量。此数据以易于使用的货币指数和货币电力线的形式表示,您可以使用它们来查看这种或那种货币的力量。 您所需要的只是将指标附加到您要交易的图表上,该指标将向您显示您交易的货币的真实强度。该指标还向您显示买卖量压力的极值,您可以在顺势交易时利用这些压力。该指标还显示了基于斐波那契的可能目标。该指标可用于各种交易时间范围。该指标支持各种货币对的交易。 该指标为您提供所有类型的警报,包括推送通知。 购买后请联系我。我将与您分享我的交易技巧,并免费为您提供丰厚的红利指标! 祝您交易愉快,获利丰厚!
PTS Precision Index Oscillator V2
PrecisionTradingSystems
5 (1)
精密指数振荡器(Pi-Osc)由Precision Trading Systems的Roger Medcalf开发 版本2经过精心重新编码,以在您的图表上加载速度非常快,还加入了一些其他技术改进,以提高体验。 Pi-Osc旨在提供准确的交易定时信号,旨在找到极端的耗尽点,这些点是市场被迫去触及,以清理每个人的止损单。 该产品解决了一个古老的问题,即知道极端点在哪里,这使得交易员的生活变得更加简单。 这是一个高度复杂的共识指标,与行业标准的振荡器相比,具有一些强大的区别。 它使用的一些特征包括需求指数、资金流动、RSI、随机指标、模式识别、成交量分析、标准偏差极端点以及不同长度上述各种变化的分歧。 乍一看,对于未经培训的人来说,它似乎与任何其他振荡器没有什么不同,但当与其他振荡器(如RSI或动量等)相对比时,这个指标的真正威力开始显现。 据我所知,没有其他振荡器可以频繁地精确指出顶部和底部,具有相同的定期效率。 精密指数振荡器由许多不同的数学方程组成,用于测量多个时间框架采样中的价格和成交量变动,从而高度准确地预测趋势可能发生转折的位置。 PTS Pi-Osc V2非
Advanced Supply Demand
Bernhard Schweigert
4.91 (302)
现在优惠 30%! 任何新手或专业交易者的最佳解决方案! 该指标是一款独特、高质量、且价格合理的交易工具,因为我们已经整合了许多专有功能和新公式。 依据此更新,您将能够显示双重时间帧区域。 您不仅可以显示一个较高的时间帧,还可以同时显示图表时间帧,加上更高的时间帧:显示嵌套时区。 供需双方所有交易者都会喜欢它。 :) 重要信息披露 高级供需的最大潜力,请访问 https://www.mql5.com/zh/blogs/post/720245   想象您的交易如何得以改善,是因为您能够精准定位入场或目标位吗? 构建于新的底层算法,它可以更轻松地识别出买卖双方之间的潜在失衡。 这是因为它以图形方式展示供需最强劲区域,及其过去的表现(显示旧区域)。 这些功能旨在帮助您更轻松地发现最佳入场区域和价位。 现在您可以针对您的交易品种和时间帧来优化和编辑区域强度! 高级供需指标适用于所有产品和时间帧。 它是一个新的公式,非常新的功能是两个区域强度函数可由用户输入进行调整! 这在交易中是一大优势。 当您学习如何使用专有功能,例如带有价格游离最小 X 因子的区域强度时,您能够判断该区域强劲与否。 供需
作者的更多信息
Separate Chart Symbol
Tretyakov Rostyslav
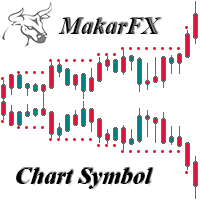
该指标创建一个带有在设置中选择的交易品种图表的子窗口 Currency pair  ......... 显示指定条数的高低水平 Period resistance & support ........ 可调整大小 Width resistance & support ........ 显示的可用历史限制 Month limiting history / false-all available  ........ 可定制颜色 Bullish candle & resistance color ........ Bearish candle & support color ........ Bars & Bid line color  .......... 显示带有每根蜡烛信息的弹出窗口
Price Ratio
Tretyakov Rostyslav
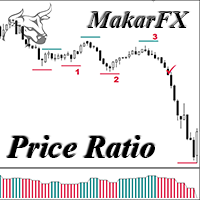
Oscillator MTF & NRP The indicator calculates the price ratio between two timeframes Selecting timeframes in the settings First timeframe for analysis Second timeframe for analysis The oscillator shows the change in the price ratio Calculates support and resistance levels and shows them on the chart Displays pop-up windows with the price of the current level I found a bearish pattern for myself (fig. 1) and a bullish pattern (fig. 2) You can find patterns to your liking Can be used to de
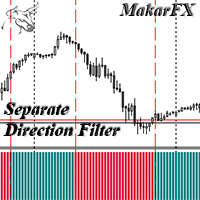
The indicator shows the Buy/Sell direction. The calculations use the opening prices and their rate of change for the billing period - "Calculation period" MTF indicator - "Calculation timeframe", no repaint - NRP. Two display types: "Simple histogram" or "Histogram level crossing" Alerts available: "Chart message", "Push message", "Email message" Two types of signals: "Change direction" or "Crossing level" Level settings: "Crossing UP level" and "Crossing DN level" Color settings. For EA: iCusto
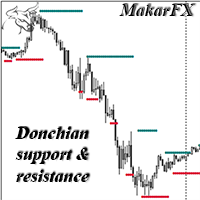
Support and resistance level indicator based on the Donchian channel. The most famous example of trading through the Donchian channel is an experiment with a group of turtles, who earned one hundred and twenty-five million dollars in five years. This indicator can be used as a standalone tool, as well as an additional confirmation. There is MTF,  NRP. There are color and thickness settings.
筛选:
无评论
回复评论