Min Max spread study

Do you know the spreads on which your trades are / will be opened.
How well do you know about the spreads on which your trades are / will be opened.

The main task of the indicator. Help the user / trader to study the spreads in the trading terminal.

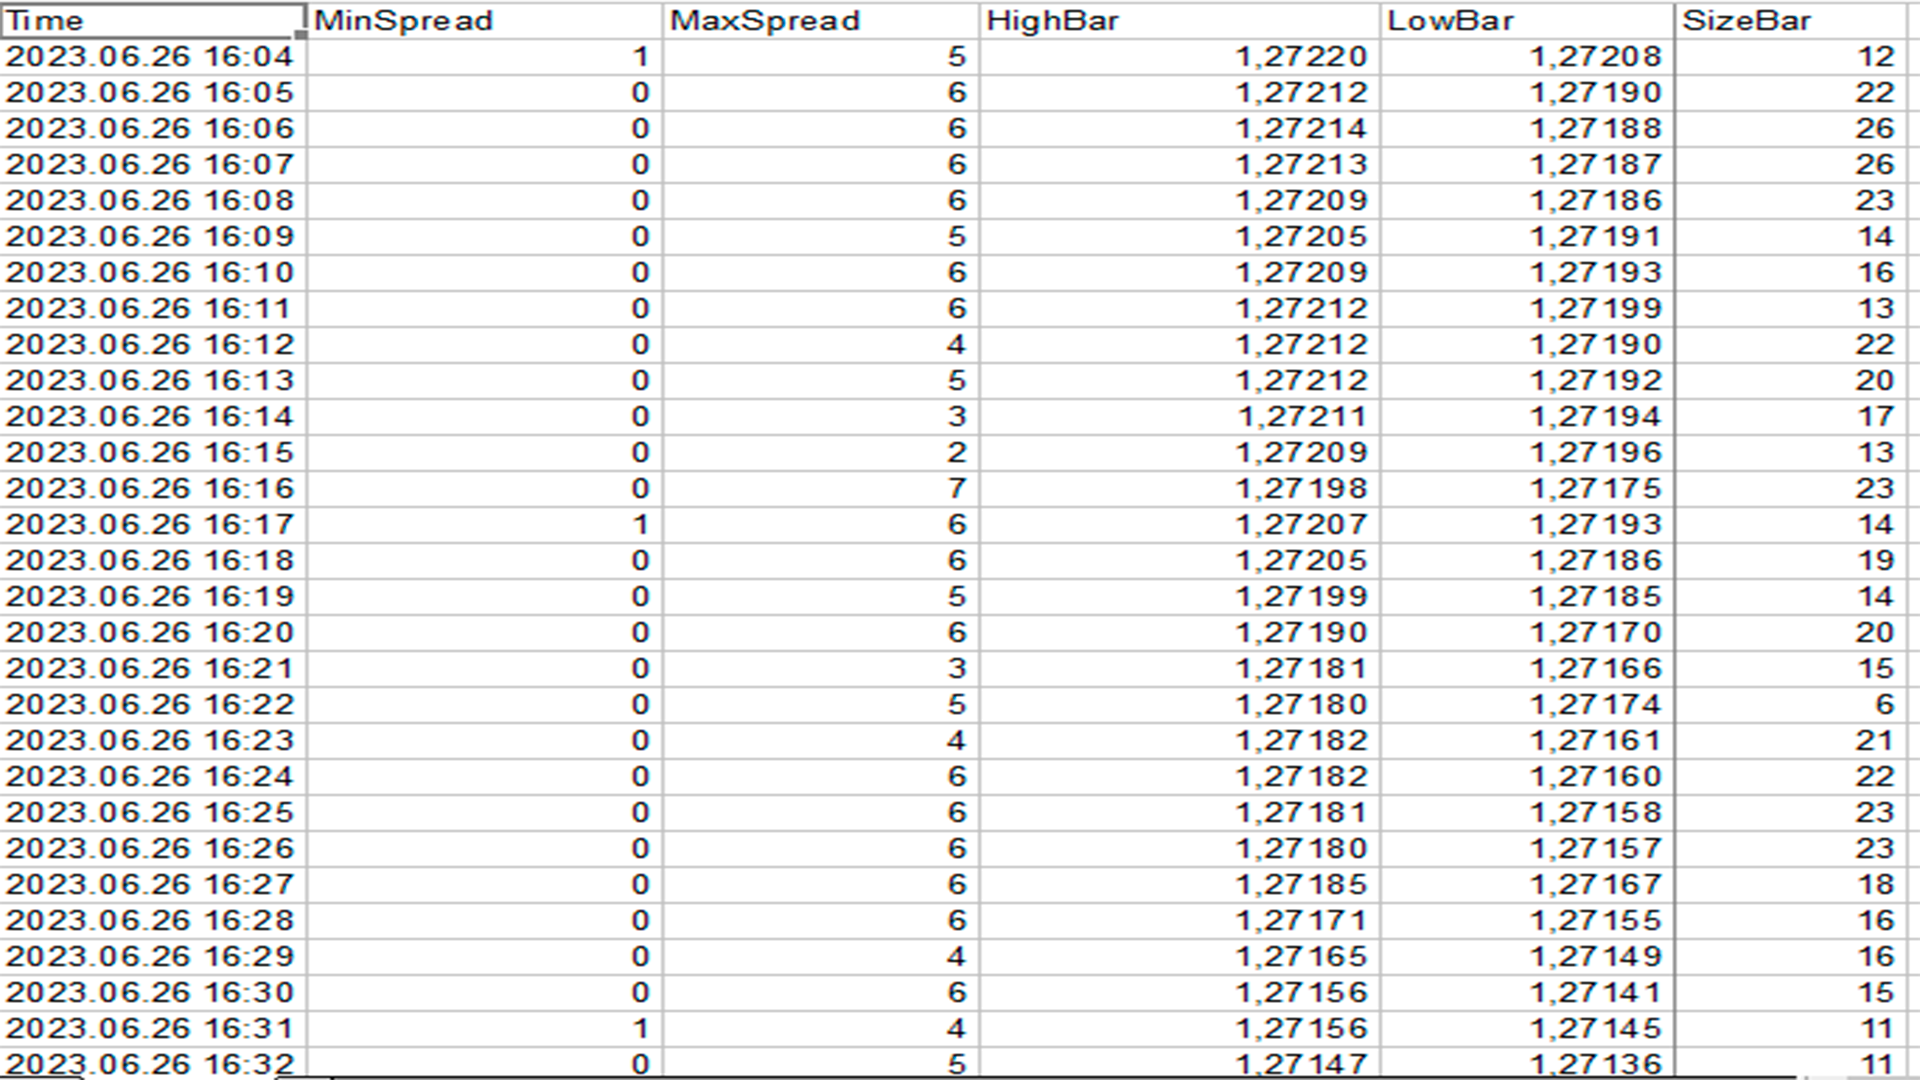
Get information about the minimum and maximum spread on each candle, from M1 and above.
This information will help in the following cases:
- Maximum trading spread EA
   --- If your broker has smaller spreads or average statistically higher and then most of the transactions will not open.
   --- Study your maximum spread for each instrument/currency pair separately and consider attaching an EA separately for each instrument with a different maximum spread in the EA parameters.
- Study the behavior of spread changes
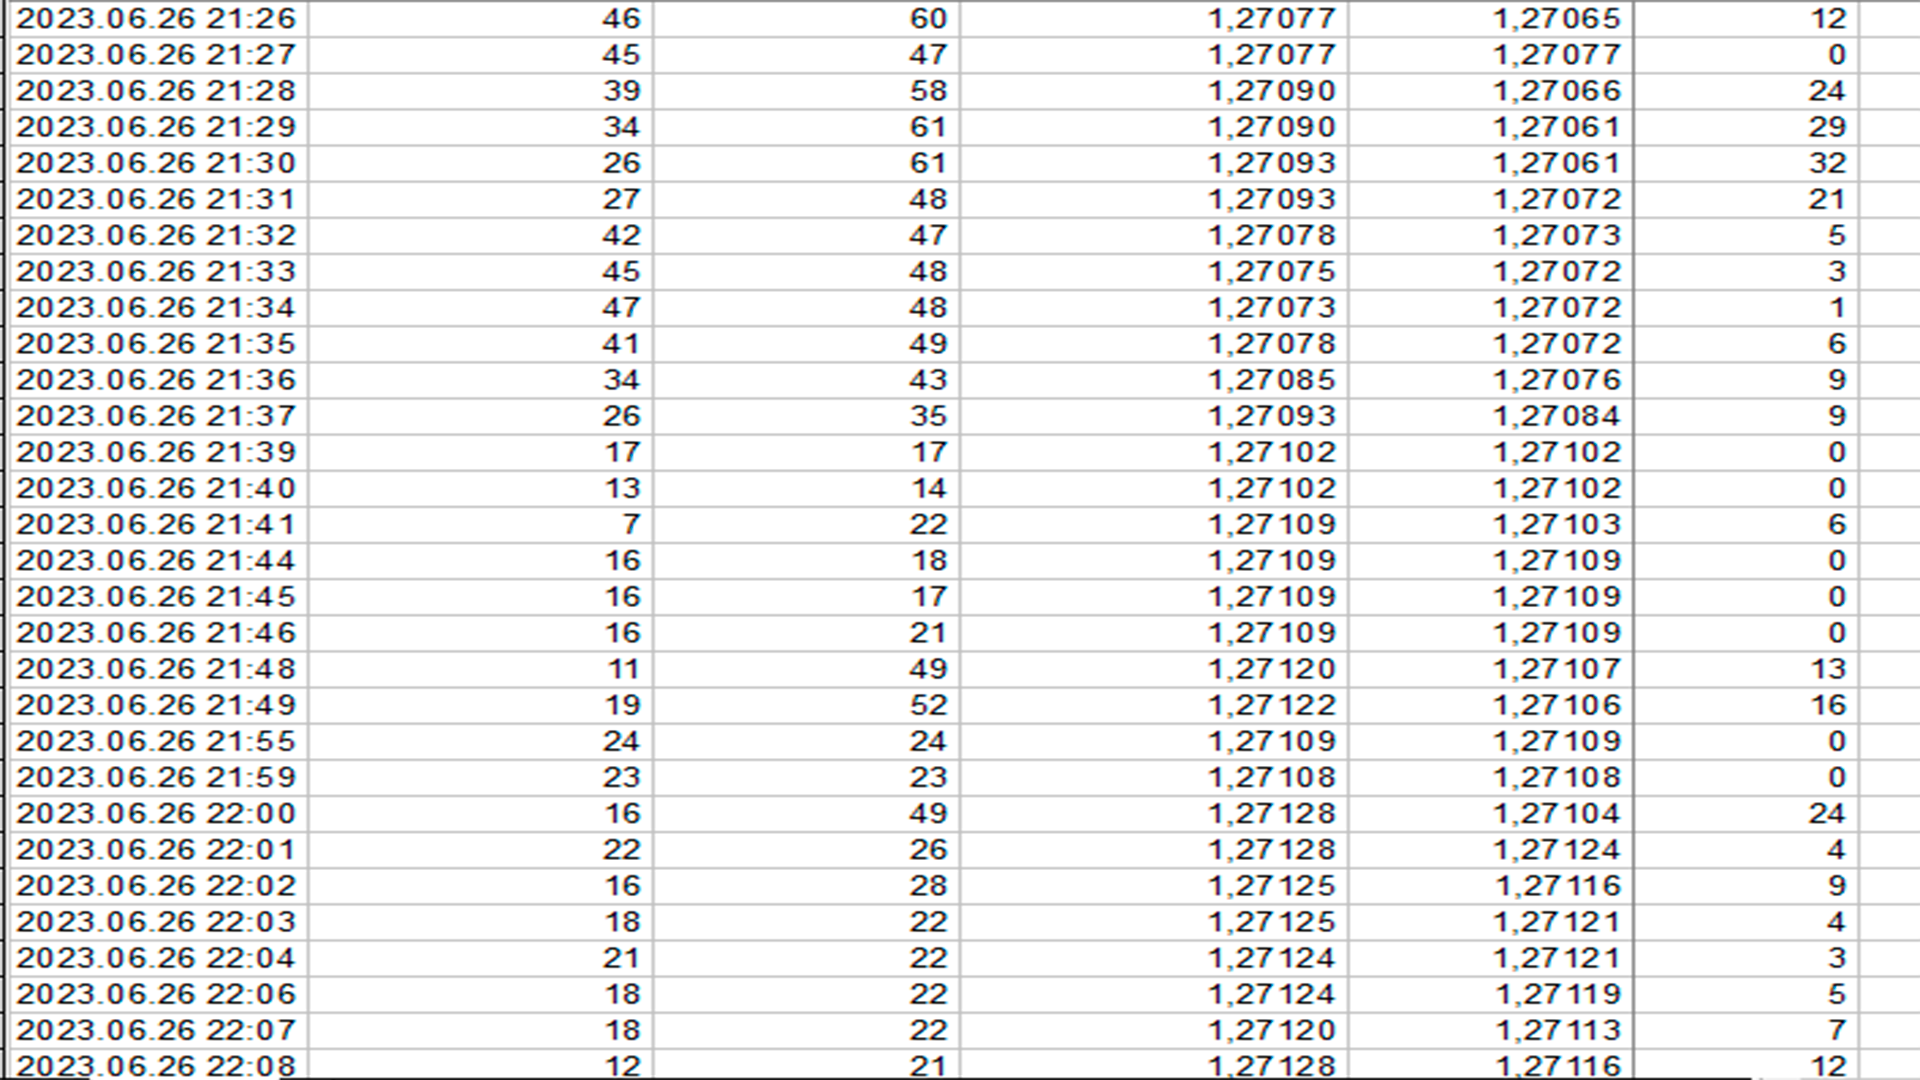
   --- During which hours or sessions the spread goes down or up and what is the range.
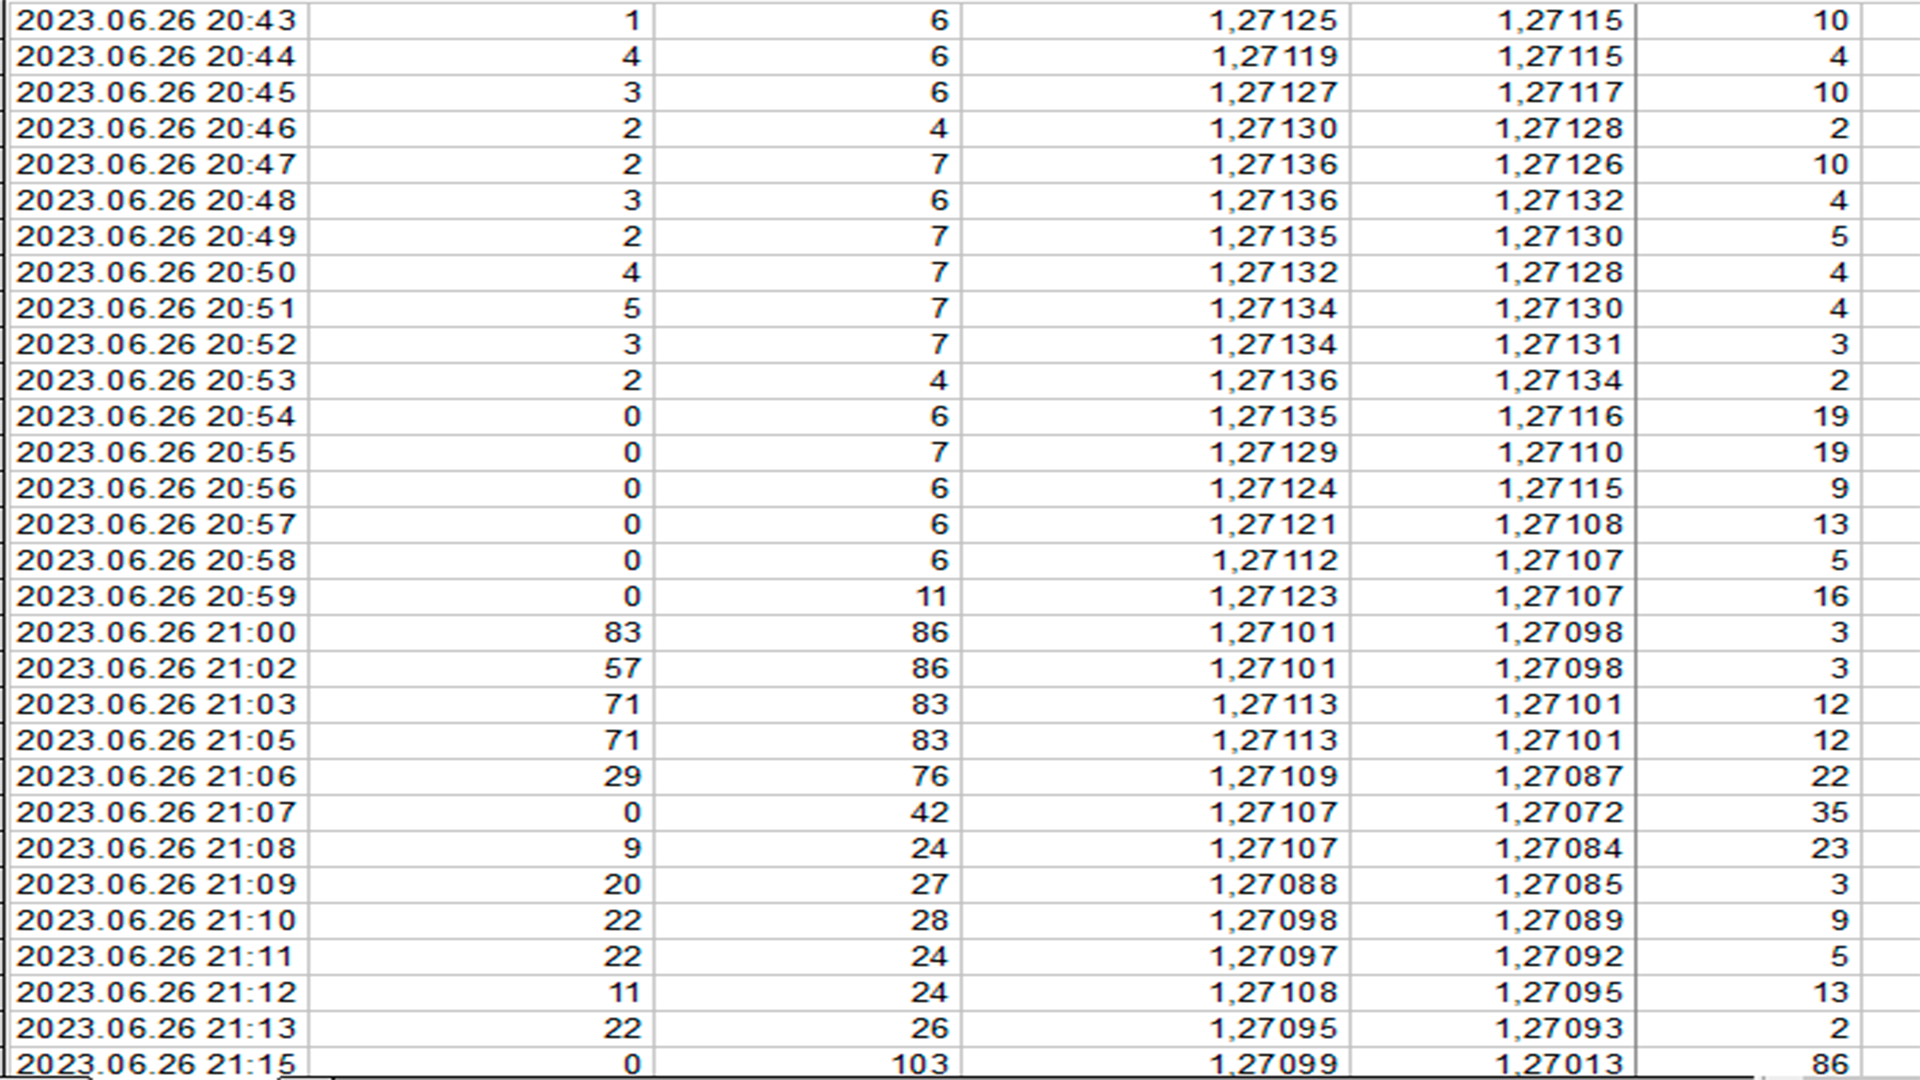
   --- Range / by how much the spread changes when news is released.
   --- Range / by how much the spread changes during price jumps, long bars.
- In what spread ranges your deal was opened. Find the bar in the file on which the deal was opened
- Compare spreads with other brokers or accounts.
- Find out on which spreads to test EA.
There may be other situations that I haven't mentioned.

How the indicator works.

The indicator is attached to the chart and starts saving spread changes on each bar for the selected timeframe. For further study by the user.

How to run the indicator.

Attached to the chart of a trading instrument / currency pair.

Select the timeframe for saving bars.
- So if M1 is selected, then in the report we see the minimum and maximum spread for every minute in a day.
   --- M1 is the most optimal for in-depth study of the spread.
   --- H1 will easily show the spread range on each hour.

Set the file name.
- The indicator itself adds the name of the currency pair and timeframe to the name. You can add the name of the broker, since all spread report files are saved in the same folder from all terminals. To avoid confusion and overwriting the file.

Set the separator so that you can read the file through Excel. ; - for the Russian version. , - for the English version.

Whether to show the length of the bar. Yes or no.

Leave the graphs open for data collection.

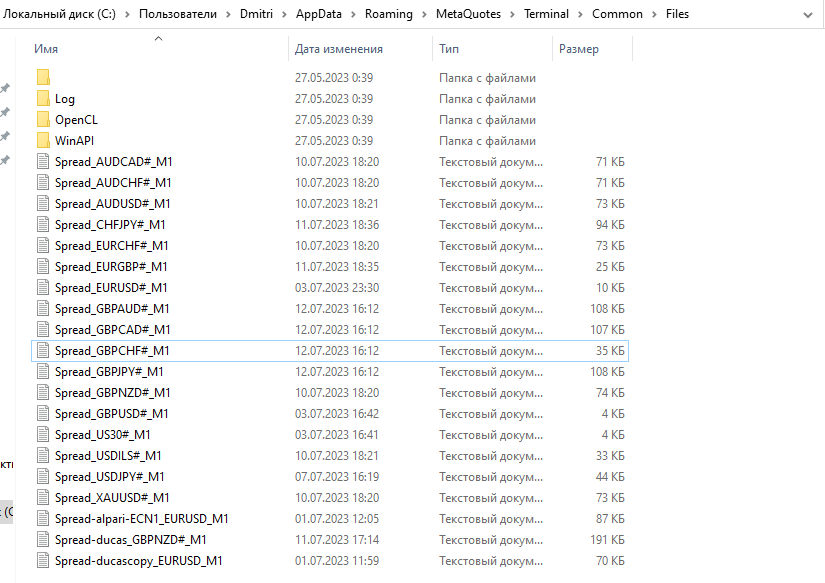
Open the folder C:\Users\MY-UERNAME\AppData\Roaming\MetaQuotes\Terminal\Common\Files
We find our files, open and study.

English parameters and aditional updates in soon in next update

Event.

Support EA's development to save spread on new trades - No risk, fraud, risky algorithms.
By purchasing Min Max spread study you will be guaranteed a minimum price of $30 and constant updates on EA Spread Savings.

Send a message before or after your purchase.


How to extract the variation spread from the tick provider?

Yes it is possible. Now you can extract the variation spread from history using the strategy tester.

By running the indicator in the strategy tester, "Min Max spread study" will collect data on spread changes for the date specified in the strategy tester and save it to the same "files" folder for further study of variation spread changes.

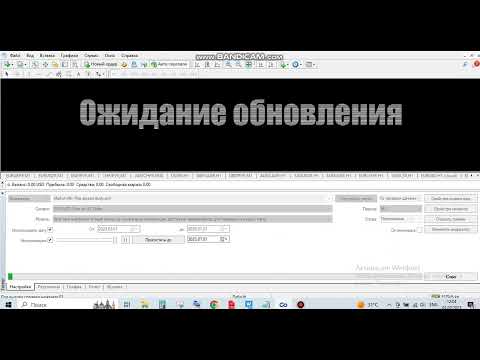
This is shown in the video.


推荐产品
Smoothed Heiken Ashi with AC/AO Zones – Professional Trading Clarity Transform your Heiken Ashi analysis with intelligent smoothing that eliminates noise while preserving actionable signals. What Makes This Different? This isn't just another Heiken Ashi indicator. We've engineered a sophisticated smoothing engine that works with the Accelerator (AC) and Awesome Oscillator (AO) zone logic to give you cleaner entries and exits without sacrificing responsiveness. Four Smoothing Methods at Your Comm
Power Renko MT4
Pierce Vallieres
Power Renko is an indicator which plots Renko bricks underneath the chart using a histogram. You can select the brick size and the timeframe of the Renko bricks as well as whether or not to use the close price or the high/low price of the candles. Renko bricks are based on price alone, not time, therefor the Renko bricks will not be aligned with the chart's time. They are extremely useful for trend trading and many different strategies can be formed from them. Buffers are provided allowing you t
Auto Fibo Pro m
DMITRII GRIDASOV
“Auto FIBO Pro” Crypto_Forex 指标 - 是交易中的绝佳辅助工具! - 指标自动计算并放置在图表斐波那契水平和局部趋势线(红色)上。 - 斐波那契水平指示价格可能反转的关键区域。 - 最重要的水平是 23.6%、38.2%、50% 和 61.8%。 - 您可以将其用于反转剥头皮或区域网格交易。 - 还有很多机会可以使用 Auto FIBO Pro 指标来改进您当前的系统。 - 它具有信息价差掉期显示 - 它显示所连接的外汇对的当前价差和掉期。 - 显示屏还显示账户余额、净值和保证金。 - 可以将信息价差掉期显示定位在图表的任何角落: 0 - 左上角,1 - 右上角,2 - 左下角,3 - 右下角。 点击这里查看高质量的交易机器人和指标! 这是仅在此 MQL5 网站上提供的原创产品。
Delta Fusion Pro
Francesco Secchi
5 (2)
Delta Fusion Pro – 高级订单流分析,专为日内交易设计 Delta Fusion Pro 是一款专业的 MetaTrader 4 指标,能够揭示市场中的主动订单流,实时显示机构压力的强度和方向。与传统的成交量指标不同,它分析买盘(Ask)与卖盘(Bid)之间的成交量差值(Delta),用于提前预测反转、确认趋势并识别专业兴趣区域。 主要特点 智能自动调节系统 根据以下条件自动调整所有参数: 交易品种类型(外汇、加密货币、指数、大宗商品、股票) 操作周期 市场波动率(ATR) 最近平均成交量 无需手动配置,适合新手交易者——指标自动完成校准! 核心功能 净Delta与累计Delta 计算主动买盘/卖盘成交量差值,支持自定义 EMA 平滑 实时显示方向性压力 可自定义直方图颜色(买入/卖出) 价格/成交量背离 自动检测常规与隐藏背离 强度分类:强/中/弱 高级过滤:成交量确认、趋势、时间距离 图形信号(彩色箭头) 市场失衡 识别显著的买盘/卖盘比例失衡(可配置比率) 最小成交量阈值验证 图表显示彩色点(多头/空头) Infusion Volume 检测异常成交量峰值(
The   Trendlines Oscillator   helps traders identify trends and momentum based on the normalized distances between the current price and the most recently detected bullish and bearish trend lines. The indicator features bullish and bearish momentum, a signal line with crossings, and multiple smoothing options. USAGE The   Trendlines Oscillator   works by systematically: Identifying pivot highs and lows. Connecting pivots to form bullish (support) and bearish (resistance) trendlines. Measuring
Order Blocks Breaker
Suvashish Halder
5 (1)
Introducing Order Blocks Breaker , a brand-new way to identify and leverage order blocks in your trading strategy. After developing multiple order block tools with unique concepts, I’m proud to present this tool that takes things to the next level. Unlike previous tools, Order Blocks Breaker not only identifies order blocks but also highlights Breaker Order Blocks —key areas where the price is likely to retest after a breakout. MT5 -  https://www.mql5.com/en/market/product/124102/ This tool inco
The indicator detects and displays М. Gartley's Butterfly pattern. The pattern is plotted by the extreme values of the ZigZag indicator (included in the resources, no need to install). After detecting the pattern, the indicator notifies of that by the pop-up window, a mobile notification and an email. The pattern and wave parameters are displayed on the screenshots. The default parameters are used for demonstration purposes only in order to increase the amount of detected patterns. Parameters z
The indicator displays the data of the Stochastic oscillator from a higher timeframe on the chart. The main and signal lines are displayed in a separate window. The stepped response is not smoothed. The indicator is useful for practicing "manual" forex trading strategies, which use the data from several screens with different timeframes of a single symbol. The indicator uses the settings that are identical to the standard ones, and a drop-down list for selecting the timeframe. Indicator Paramet
“可调分形” - 是分形指标的高级版本,非常有用的交易工具! .......................................................................................... - 众所周知,标准分形 mt4 指标根本没有设置 - 这对交易者来说非常不方便。 - 可调分形解决了这个问题 - 它具有所有必要的设置: - 指标的可调周期(建议值 - 高于 7)。 - 价格高点/低点的距离可调。 - 可调分形箭头设计。 - 指标内置移动和 PC 警报。 点击这里查看高质量的交易机器人和指标! 这是仅在此 MQL5 网站上提供的原创产品。 ....................................................
The indicator detects and displays Shark harmonic pattern (see the screenshot). The pattern is plotted by the extreme values of the ZigZag indicator (included in the resources, no need to install). After detecting the pattern, the indicator notifies of that by a pop-up window, a mobile notification and an email. The indicator highlights the process of the pattern formation and not just the complete pattern. In the former case, it is displayed in the contour triangles. After the pattern is comple
MTF Heiken Ashi MA is a multiple timeframe Heiken Ashi & Moving Average indicator. Fully customizable for advanced & unique Heiken Ashi & Moving Average calculations. Key Features Modified appearance and appeal from the traditional using only H eiken Ashi MA bodies. MTF Higher or lower timeframes available making this it great for trends and scalping. There are many settings that can be non-repaint for signals at a new bar and at bar 0. Inputs Timeframe  = PERIOD_CURRENT - timeframe of Moving
FREE
FreqoMeterForecast
Stanislav Korotky
The main idea of this indicator is rates analysis and prediction by Fourier transform. Indicator decomposes exchange rates into main harmonics and calculates their product in future. You may use the indicator as a standalone product, but for better prediction accuracy there is another related indicator - FreqoMaster - which uses FreqoMeterForecast as a backend engine and combines several instances of FreqoMeterForecast for different frequency bands. Parameters: iPeriod - number of bars in the ma
Magic Balance
Daniil Evstratenko
The indicator shows which trading pairs, strategies, robots and signals that you use are profitable and which are not. The statistic of trades and balance graph are displayed in the account currency and pips - to switch simply click on the graph. button "$"(top left) - minimize/expand and move the indicator panel button ">"(bottom right) - stretching and resetting to the original size Statistic of trades 1 line - account balance, current profit and lot of open trades; 2 line - the number of all
The indicator detects and displays 3 Drives harmonic pattern (see the screenshot). The pattern is plotted by the extreme values of the ZigZag indicator (included in the resources, no need to install). After detecting the pattern, the indicator notifies of that by a pop-up window, a mobile notification and an email. The indicator highlights the process of the pattern formation and not just the complete pattern. In the former case, it is displayed in the contour triangles. After the pattern is com
MT5 Version Most indicators draw lines. This one draws the battlefield. If you ever bought an EA or indicator based on a perfect equity curve — and then watched it bleed out live — you’re not alone. The problem? Static logic in a dynamic market. Fibonacci Bollinger Bands adapts. It combines Bollinger structure with customizable Fibonacci levels to mark zones of control — where price reacts, pauses, or reverses. No magic. Just logic that follows volatility. Why this tool matters It shows yo
FREE
Crypto_Forex 指标 HTF Ichimoku 适用于 MT4。 - Ichimoku 指标是最强大的趋势指标之一。HTF 表示 - 更高时间框架。 - 此指标非常适合趋势交易者以及与价格行动条目的组合。 - HTF Ichimoku 指标允许您将更高时间框架的 Ichimoku 附加到当前图表。 - 上升趋势 - 红线高于蓝线(并且两条线都在云层上方)/ 下降趋势 - 红线低于蓝线(并且两条线都在云层下方)。 - 仅当价格突破 Ichimoku 云层顶部边界时才打开买入订单。 - 仅当价格突破 Ichimoku 云层底部边界时才打开卖出订单。 - HTF Ichimoku 指标提供了捕捉大趋势的机会。 点击这里查看高质量的交易机器人和指标! 它是仅在此 MQL5 网站上提供的原创产品。
Trend PA
Mikhail Nazarenko
5 (3)
The Trend PA indicator uses   Price Action   and its own filtering algorithm to determine the trend. This approach helps to accurately determine entry points and the current trend on any timeframe. The indicator uses its own algorithm for analyzing price changes and Price Action. Which gives you the advantage of recognizing, without delay, a new nascent trend with fewer false positives. Trend filtering conditions can be selected in the settings individually for your trading style. The indicator
FX Flow
Eva Stella Conti
FX Flow   indicator can be used as an anticipator of the next trend, preferably confirmed by Price Action or another oscillator (RSi, Stochastic ..). It takes the money flows of the major currencies USD EUR GBP AUD NZD CAD CHF JPY into account, and processes them. Excellent tool for indices, but also for correlations between currencies. Works on each timeframes.  Blue line: Bull market Yellow line: Bear market Note : if the indicator opens the window, but does not draw lines, load the historie
Nice Trade Point
Muhammed Emin Ugur
This    Nice Trade Point     indicator is designed for signal trading. This indicator generates trend signals. It uses many algorithms and indicators to generate this signal. It tries to generate a signal from the points with the highest trend potential. This indicator is a complete trading product. This indicator does not need any additional indicators. The indicator certainly does not repaint. The point at which the signal is given does not change.     Features and Suggestions Time Frame
Trend Ray
Andriy Sydoruk
The indicator shows the potential trend direction by cyclical-wave dependence. Thus, all the rays of the intersection will be optimal rays, in the direction of which the price is expected to move, taking into account the indicator period. Rays can be used as a direction for potential market movement. But we must not forget that the approach must be comprehensive, the indicator signals require additional information to enter the market.
IMPORTANT NOTE : This is a dashboard indicator and will not work on strategy tester. Multi-Symbol Trend Scanner - Professional Market Analysis Tool Overview The   Multi-Symbol Trend Scanner   is a sophisticated trading dashboard that provides real-time market analysis across multiple financial instruments simultaneously. Designed for both novice and professional traders, this powerful indicator displays crucial market data in an intuitive, table-aligned format that's easy to interpret at a glan
Alert Arrows Buy Sell
Luis Mariano Vazquez Marcos
PrecisionBands Descripción: Explora el mundo del trading con mayor precisión utilizando PrecisionBands, un indicador avanzado basado en las famosas Bandas de Bollinger. Diseñado para MetaTrader 4, PrecisionBands combina la versatilidad de las bandas de volatilidad con marcadores nítidos de señales de compra y venta, proporcionando una herramienta esencial para los traders que buscan tomar decisiones informadas. Características Principales: Bandas de Bollinger Mejoradas: PrecisionBands utiliza al
Combined MT4
Ahmed Alaaeldin Abdulrahman Ahmed Elherzawi
Welcome to Investment Castle products   This product is exclusively available in the MQL5 market and is not available and will not be available anywehere else. The Combined indicator is a multi-time frame indicator and it is built using 3 indicators: Bands indicator which draws the support and resistance key levels   using up to 5 different time frames Patterns indicator which draws the chart patterns using up to 6 different time frames Spots indicator which shows the common candlestick pattern
基于具有标准参数的MACD指标波 在最后两个MACD波上分别对正面和负面交易斐波纳契水平, 如果负波浪在MACD指标上结束,则颜色为绿色, 如果正波在MACD指标上结束,那么颜色为红色。 Wave的终止标准是两个滴答,MACD的符号不同。 在最近四次MACD波浪中绘制趋势线。 与专家合作很好  Figures MACD   https://www.mql5.com/ru/market/product/42031 更多截图: https://www.mql5.com/ru/charts/10581596/audusd-h1-alpari-international https://www.mql5.com/ru/charts/10631979/usdjpy-m1-alpari-international https://www.mql5.com/ru/charts/10628704/gbpusd-m15-alpari-international
Find and fill Gaps
Leandro Oliveira
This indicator shows the gaps on the current chart with a rectangle shape and indicates when the gap is filled by closing the shape. Gaps are considered over the shadows. Allows sending alerts by e-mail or push notifications when a gap is found. Parameters SizeGAP - Size of the gap that you want to indicate; HGcolor1 - Color of the gap in an upward movement; HGcolor2 - Color of the gap in a downward movement; HGstyle - The style of rectangle to be drawn; StartCalculationFromBar - How many candl
StarSwing
Gabriele Tedeschi
StarSwing è un indicatore NO REPAINT che unisce in un unico strumento oscillatori e indicatori di forza.  I parametri esterni permettono di bilanciare il peso delle componenti e di regolare a proprio piacimento l'indicatore stesso. StarSwing, graficamente, è composto da segmenti di 2 colori: uno rappresentante il rialzo e uno il ribasso. Il colore non dipende dalla pura direzione del segmento ma dal trend di fondo calcolato dall'indicatore stesso. Sul grafico, si può far disegnare una media mobi
Italo Trend Indicator
Italo Santana Gomes
4.76 (33)
BUY INDICATOR AND GET EA FOR FREE AS A BONUS + SOME OTHER GIFTS! ITALO TREND INDICATOR  is the best trend indicator on the market, the Indicator works on all time-frames and assets, indicator built after 7 years of experience on forex and many other markets. You know many trend indicators around the internet are not complete, does not help, and it's difficult to trade, but the Italo Trend Indicator is different , the Italo Trend Indicator shows the signal to buy or sell, to confirm the signal t
FreqoMaster
Stanislav Korotky
The main idea of this indicator is rates analysis and prediction by Fourier transform. The indicator decomposes exchange rates into main harmonics and calculates their product in future. The indicator shows 2 price marks in history, depicting price range in the past, and 2 price marks in future with price movement forecast. Buy or sell decision and take profit size are displayed in a text label in the indicator window. The indicator uses another indicator as an engine for calculations - FreqoMet
PPR and Engulfing
Yury Emeliyanov
5 (2)
PPR 和 Engulfing 是一个独特的技术指标,设计用于在 MetaTrader 4 (MT4) 交易平台上的货币图表中识别 "PPR" 和 "吞没" 模式。这些模式可以指示潜在的趋势反转或延续,为交易者提供宝贵的入市和出市信号。 主要特点: 自动模式检测 :指标自动识别并在图表上用箭头标记 PPR 和 吞没模式。 视觉信号 :绿色向上箭头表示买入点,而红色向下箭头表示卖出点。 可自定义箭头颜色 :用户可以通过指标设置选择看涨和看跌信号的箭头颜色。 模式选择 :三种操作模式——仅 PPR、仅 吞没或两种模式同时。 如何使用: 附加到图表 :将指标应用到所需的货币对或金融工具图表。 分析信号 :监控图表上箭头的出现,以确定买入和卖出机会。 做出决定 :结合其他分析工具使用指标信号,以提高交易决策的准确性。 交易策略: PPR 和 Engulfing 可以集成到各种交易策略中。交易者可以将此指标与其他技术指标和趋势分析方法结合使用,以提高交易效率。 其他产品: 您可以在 卖家页面 找到其他有用的工具和指标。 参数: 模式选择 :选择要分析的模式(PPR、吞没、两者)。 UpArrow
FREE
MASi Three Screens
Aleksey Terentev
5 (2)
MASi Three Screens is based on the trading strategy by Dr. Alexander Elder. This indicator is a collection of algorithms. Algorithms are based on the analysis of charts of several timeframes. You can apply any of the provided algorithms. List of versions of algorithms:     ThreeScreens v1.0 - A simple implementation, with analysis of the MACD line;     ThreeScreens v1.1 - A simple implementation, with analysis of the MACD histogram;     ThreeScreens v1.2 - Combines the first two algorithms in
FREE
该产品的买家也购买
Gann Made Easy
Oleg Rodin
4.83 (152)
Gann Made Easy 是一个专业且易于使用的外汇交易系统,它基于使用先生理论的最佳交易原则。 W.D.江恩。该指标提供准确的买入和卖出信号,包括止损和获利水平。您甚至可以使用推送通知在旅途中进行交易。 购买后请联系我,免费获取交易提示、奖金和 GANN MADE EASY EA 助手! 您可能已经多次听说过江恩交易方法。通常 Gann 的理论不仅对于新手交易者而且对于那些已经有一定交易经验的人来说都是非常复杂的东西。这是因为江恩的交易方法在理论上并不那么容易应用。我花了几年时间来完善这些知识,并将最好的原则应用到我的外汇指标中。 该指标非常易于应用。您所需要的只是将其附加到您的图表并遵循简单的交易建议。该指标不断进行市场分析工作并寻找交易机会。当它检测到一个好的入口点时,它会为您提供一个箭头信号。该指标还显示止损和获利水平。 换句话说,当您像先生一样进行交易时,该指标会为您提供最佳江恩建议。江恩亲自告诉你此时此刻该做什么。但最好的部分是您不需要了解任何有关江恩交易原则的知识,因为该指标会为您完成整个市场分析工作。
Smc Blast Signal
Mohit Dhariwal
5 (4)
NEW YEAR 2026 SALE OFFER PRICE AT JUST 99 DOLLARS FEW COPIES ONLY AT This price From 10th Jan -20th Jan MIDNIGHT Final offer GRAB YOUR COPY ON THIS New Year EVE Prices will be increased to 150 after the offer period ends Full Fledged EA and Alert plus for alerts will also be provided in this offer along with the purchase of Indicator. Limited copies only at this price and Ea too. Grab your copy soon Alert plus for indicator with set file is kept in comment section with the image  SMC Blast Signa
目前八折优惠! 对任何新手或专家交易者来说都是最好的解决方案! 这个仪表板软件适用于28种货币对。它基于我们的两个主要指标(高级货币强度28和高级货币冲动)。它对整个外汇市场提供了一个伟大的概述。它显示高级货币强度值,货币运动速度和28个外汇对在所有(9)时间段的信号。想象一下,当你可以使用图表上的单一指标观察整个市场,以确定趋势和或剥头皮的机会时,你的交易将得到改善 我们已经在这个指标中建立了一些功能,使你更容易识别强势和弱势货币,同时识别和确认潜在的交易。该指标以图形方式显示货币的强势或弱势是增加还是减少,以及它在所有时间段的表现。 增加的新功能是动态市场斐波那契水平,它适应当前的市场条件变化,这是一个已经在我们的高级货币强度28和高级货币冲动指标中使用的成熟的加分项。 在交易时,总是将弱势货币和强势货币配对,这个新指标将帮助你做到这一点。 用户手册:点击这里  https://www.mql5.com/en/blogs/post/708783 特点  显示每个时间段的ACS28和GAP-speed(冲动)的货币强度值。 列:颜色代码以7种颜色显示货币强度:强势
Game Changer Indicator
Vasiliy Strukov
4.67 (12)
Game Changer 是一款革命性的趋势指标,适用于任何金融工具,可将您的 MetaTrader 平台升级为强大的趋势分析工具。该指标不会重绘,也不会出现滞后。它适用于任何时间范围,有助于识别趋势,发出潜在反转信号,可用作追踪止损机制,并提供实时警报,以便您快速做出市场反应。无论您是经验丰富的交易员、专业人士,还是寻求优势的初学者,这款工具都能帮助您自信、自律地进行交易,并清晰地了解潜在的趋势动态。 购买后立即联系我,即可获得个人奖励!您可以免费获得我们的强力支撑和趋势扫描指标,请私信我! 请注意,我不在 Telegram 上出售我的 EA 或特殊套件,它们仅适用于 MQL5,我的套件文件也仅在我的博客上提供。 请小心诈骗者 ,不要从其他人那里购买任何套件! 设置 启用趋势变化警报 - 真/假 - 趋势变化时在图表上显示警报 发送推送通知 - 真/假 - 启用手机推送警报通知 发送邮件通知 - 真/假 - 发送趋势变化的邮件通知到电子邮件
Scalper Inside PRO
Alexey Minkov
4.74 (69)
An exclusive indicator that utilizes an innovative algorithm to swiftly and accurately determine the market trend. The indicator automatically calculates opening, closing, and profit levels, providing detailed trading statistics. With these features, you can choose the most appropriate trading instrument for the current market conditions. Additionally, you can easily integrate your own arrow indicators into Scalper Inside Pro to quickly evaluate their statistics and profitability. Scalper Inside
M1 Sniper
Oleg Rodin
4.89 (18)
M1 SNIPER 是一款易于使用的交易指标系统。它是一个专为 M1 时间框架设计的箭头指标。该指标可以作为独立的系统在 M1 时间框架下进行剥头皮交易,也可以作为您现有交易系统的一部分使用。虽然该交易系统专为 M1 时间框架交易而设计,但它也可以用于其他时间框架。我最初设计此方法是为了交易 XAUUSD 和 BTCUSD。但我发现这种方法在其他市场交易中也同样有用。 指标信号既可以顺势交易,也可以逆势交易。我教授一种特殊的交易技巧,帮助您利用指标信号进行双向交易。该方法基于使用特殊的动态支撑位和阻力位区域。 购买后,您可以立即下载 M1 SNIPER 箭头指标。此外,我还为所有 M1 SNIPER 工具用户免费提供下方屏幕截图所示的 Apollo Dynamic SR 指标!这两个指标的组合可以帮助您更轻松、更准确地利用 M1 时间框架进行交易。 购买后请联系我,免费获取交易提示和奖励指标! 祝您交易成功!
GOLD Impulse with Alert
Bernhard Schweigert
4.64 (11)
这个指标是我们2个产品 Advanced Currency IMPULSE with ALERT  +   Currency Strength Exotics 的一个超级组合。 它适用于所有时间框架,并以图形方式显示8种主要货币和一种符号的强势或弱势冲动! 该指标专门用于显示任何符号的货币强度加速,如黄金、异国货币对、商品、指数或期货。这是它的第一个指标,任何符号都可以被添加到第9行,以显示黄金、白银、石油、DAX、US30、MXN、TRY、CNH等的真实货币强度加速(冲动或速度)。 建立在新的基础算法上,它使识别和确认潜在的交易更加容易。这是因为它以图形方式显示了一种货币的强势或弱势是否正在加速,并测量了这种加速的速度--把它想象成你汽车中的速度表。当你加速时,事情显然会发生得更快,这在外汇市场上也是一样的,即如果你配对的货币正在向相反的方向加速,你就会发现一个潜在的有利可图的交易。 动态市场斐波那契28水平被用作警报触发器,将适应市场活动。如果冲动击中黄色触发线,你将收到警报。然后你就知道作为一个交易员应该做什么。货币对和方向已经给出。只需点击警报按钮,就可以切换到该货
FX Volume
Daniel Stein
4.63 (38)
FX Volume:从经纪商视角洞察真实市场情绪 简要概述 想要提升您的交易策略? FX Volume 可提供零售交易者和经纪商的持仓实时数据——远早于诸如 COT 之类的延迟报告。不论您希望获得持续稳定的收益,还是想在市场中多一分制胜的砝码, FX Volume 都能帮您识别重大失衡、确认突破以及完善风险管理。立即开启体验,让真实的成交量数据为您的交易决策带来革新! 1. 为什么 FX Volume 对交易者格外有用 极具准确度的早期预警 • 快速捕捉有多少交易者正在买入或卖出某个货币对——比大多数人提前一步。 • FX Volume 是 唯一 能够整合多家零售经纪商真实成交量数据并以简洁方式呈现的工具。 强力风险管理 • 及时识别多头或空头仓位的巨大不平衡,这往往预示着潜在的趋势反转,帮助您更自信地设置止损和目标位。 • 独家而真实的数据让每一次交易决策更具可靠性。 优化进场与出场点 • 发现“过度集中”的交易(大多数交易者都在同一方向),并通过真实成交量来确认突破。 • 避免依赖常见指标可能带来的误导信号,而是利用真实的实时成交量。 适配各种交易策略 • 将 FX
Volatility Trend System - a trading system that gives signals for entries. The volatility system gives linear and point signals in the direction of the trend, as well as signals to exit it, without redrawing and delays. The trend indicator monitors the direction of the medium-term trend, shows the direction and its change. The signal indicator is based on changes in volatility and shows market entries. The indicator is equipped with several types of alerts. Can be applied to various trading ins
Currency Strength Wizard
Oleg Rodin
4.84 (55)
货币强度向导是一个非常强大的指标,为您提供成功交易的一体化解决方案。该指标使用多个时间范围内所有货币的数据来计算这个或那个外汇对的力量。此数据以易于使用的货币指数和货币电力线的形式表示,您可以使用它们来查看这种或那种货币的力量。 您所需要的只是将指标附加到您要交易的图表上,该指标将向您显示您交易的货币的真实强度。该指标还向您显示买卖量压力的极值,您可以在顺势交易时利用这些压力。该指标还显示了基于斐波那契的可能目标。该指标可用于各种交易时间范围。该指标支持各种货币对的交易。 该指标为您提供所有类型的警报,包括推送通知。 购买后请联系我。我将与您分享我的交易技巧,并免费为您提供丰厚的红利指标! 祝您交易愉快,获利丰厚!
Currency Strength Exotics
Bernhard Schweigert
4.88 (33)
目前8折优惠! 对任何新手或专家交易者来说都是最好的解决方案! 这个指标是专门用来显示任何符号的货币强度,如异国货币对、商品、指数或期货。它是同类产品中的第一个,任何符号都可以添加到第9行,以显示黄金、白银、石油、DAX、US30、MXN、TRY、CNH等的真实货币强度。这是一个独特的、高质量的、负担得起的交易工具,因为我们已经纳入了一些专有的功能和一个新的公式。想象一下,你的交易将如何改善,因为你能够准确地确定新趋势或剥头皮机会的触发点? 用户手册:点击这里   https://www.mql5.com/en/blogs/post/708876 它适用于所有时间框架。你将很快能够看到TREND! 根据新的基础算法设计,它使识别和确认潜在交易变得更加容易。这是因为它以图形方式显示了8种主要货币和一种符号的强弱。 该指标显示了8种主要货币(澳元加元瑞士法郎欧元英镑日元新西兰美元)的强弱线,再加上一个符号! 该指标显示了符号的真实价值。例如:对于XAUUSD(黄金):价格以美元报价。如果黄金在上涨,你怎么能知道是黄金的强势还是美元的弱势?只有当黄金走强时,我们才会进行交易。该指
Miraculous 指标 – 100% 不重绘的外汇和二元期权工具,基于江恩九方图 这个视频介绍的 Miraculous 指标 是一款专为外汇和二元期权交易者开发的高精度、强大交易工具。该指标的独特之处在于它建立在传奇的 江恩九方图 和 江恩振动法则 之上,使其成为现代交易中可用的最精确预测工具之一。 Miraculous 指标 完全不重绘 ,这意味着它的信号在 K 线收盘后不会改变或消失——你看到的就是你得到的。这为交易者提供了可靠且一致的基础,让他们能够自信地进出场交易。 主要特点: 基于江恩九方图和江恩理论构建 100% 不重绘的信号系统 适用于所有时间周期(M1、M5、H1、H4、日线、周线) 适用于外汇和二元期权交易 清晰的买卖信号,准确率高 可用于剥头皮、日内交易或波段交易 兼容大多数 MT4 平台 这款工具旨在帮助初学者和专业交易者做出更好、更明智的决策。无论您是交易货币、指数还是二元期权,Miraculous 指标都将为您在市场中提供所需的优势。
Trend indicator AI
Ramil Minniakhmetov
5 (75)
趋势人工智能指标是一个伟大的工具,将加强交易者的市场分析结合趋势识别与可操作的进入点和逆转警报。 该指标使用户能够自信和精确地驾驭外汇市场的复杂性 除了主要信号,趋势Ai指标识别在回调或回调期间出现的次要入口点,使交易者能够利用既定趋势内的价格修正。 重要优势: *MT4及MT5工程 *明确买入或卖出信号 ·不重绘 *适用于所有资产 小心我不卖EA或设置电报它骗局. 所有设置免费在这里的博客。  重要! 购买后立即与我联系,以获得指示和奖金! 真实的操作监控以及我的其他产品可以在这里找到: https://www.mql5.com/en/users/mechanic/seller&nbsp ; 设置和输入: 建议为所有资源设置默认设置。 第...
Trend Lines PRO
Roman Podpora
5 (1)
TREND LINES PRO 帮助您了解市场真正的方向转变点。该指标显示真实的趋势反转点以及主要参与者重新入场的时机。 您可以看到 BOS线、 趋势变化和更高时间框架的关键水平——无需复杂的设置或不必要的干扰。信号不会重绘,并在K线收盘后仍然保留在图表上。 该指标显示的内容: 实际变化 趋势(BOS 线) 一旦信号出现,它就始终有效!这与会重绘的指标有着重要的区别,后者可能会发出信号后又改变信号,从而导致资金损失。现在,您可以更精准、更准确地进入市场。此外,还有一个功能,会在箭头出现后为K线着色,直到达到目标价位(止盈)或出现反转信号为止。 重复条目   以及主要玩家的充值 为了提高寻找入场点时的视觉清晰度,我们创建了一个模块,该模块首先显示买入/卖出区域,并在该区域内寻找最佳入场点。此外,我们还加入了智能逻辑来管理止损位,该逻辑会随着时间的推移逐步降低止损位的大小,从而降低入场交易时的初始风险(移动止损位)。 信号强度水平(BOS) 该指标采用三个显著性等级来衡量趋势变化: SL   - 标准趋势变化 ChoCH SL—— 信号放大,结构破坏,且极有可能继续移动 MEGA BOS
Dynamic Forex28 Navigator
Bernhard Schweigert
4.43 (7)
Dynamic Forex28 Navigator - 下一代外汇交易工具。 当前 49% 折扣。 Dynamic Forex28 Navigator 是我们长期流行的指标的演变,将三种功能合二为一: 高级货币强度 28 指标 (695 条评论)+ 高级货币 IMPULSE 带警报 (520 条评论)+ CS28 组合信号(奖励)。 有关指标的详细信息 https://www.mql5.com/en/blogs/post/758844 下一代强度指标提供什么? 您喜欢的原始指标的一切,现在通过新功能和更高的精度进行了增强。 主要特点: 专有货币强度公式。  所有时间范围内的平滑和准确的强度线。 非常适合识别趋势和精确进入。 动态市场斐波那契水平(市场斐波那契)。  此指标独有的独特功能。 斐波那契应用于货币强度,而不是价格图表。 适应实时市场活动以获得准确的反转区域。 实时市场动量。  第 9 行显示市场是活跃还是被动。 对于定时交易至关重要。 全面的警报和显示。  每种货币最强的买入和卖出动量。 ​​28 对的双重动量买入和卖出。 超买/超卖警告外部范围和止损。 反转
Supply and Demand Dashboard PRO
Bernhard Schweigert
4.8 (20)
目前八折优惠! 这个仪表板是一个非常强大的软件,可用于多个符号和多达9个时间段。 它是基于我们的主要指标(最佳评论:高级供应需求)。 Advanced Supply Demand 该仪表板提供了一个伟大的概述。它显示。   筛选后的供需值,包括区域强度评级。 区间内和区间外的点位距离。 它突出了嵌套的区域。 在所有(9个)时间段内,它对所选符号发出4种警报。 它是高度可配置的,以满足您的个人需求! 您的利益! 对每个交易者来说,最重要的问题是。 什么是入市的最佳水平? 在强大的供应/需求区域内或附近进入你的交易,以获得最佳的成功机会和风险/回报。 我的止损的最佳位置是哪里? 把你的止损放在强势供应/需求区的下方/上方是最安全的。 我的最佳盈利目标是什么? 你的退出策略和你的进入策略一样重要,了解更高的时间框架图可以帮助你。对于买入,使用下一个供应区作为目标,对于卖出,使用下一个需求区作为目标。在回撤到供应区或需求区时进场,以确保有足够的利润空间,达到更高的时间框架的供应和需求,将增加你的利润。 为什么我们要过滤强区和弱区? 不平衡性越大,价格的变动就
这是一个预测蜡烛收盘价的指标。 该指标主要用于 D1 图表。 该指标适用于传统外汇交易和二元期权交易。 该指标可以用作独立的交易系统,也可以作为您现有交易系统的补充。 该指标分析当前蜡烛,计算蜡烛本身内部的某些强度因素,以及前一根蜡烛的参数。 因此,该指标预测市场走势的进一步方向和当前蜡烛的收盘价。 由于这种方法,该指标既适用于短期盘中交易,也适用于中长期交易。 该指标允许您设置指标在分析市场情况期间将产生的潜在信号的数量。 在指标设置中有一个特殊的参数。 此外,该指标可以通过图表上的消息、电子邮件以及推送通知的形式通知新信号。感谢您的关注!交易愉快! 购买后一定要写信给我! 我会给你我的交易指标的建议! 还可以获得奖金!
Apollo SR Master
Oleg Rodin
5 (1)
Apollo SR Master 是一款支撑/阻力指标,其特殊功能使利用支撑/阻力区域进行交易更加便捷可靠。该指标通过检测局部价格顶部和底部,实时计算支撑/阻力区域,没有任何时间延迟。为了确认新形成的支撑/阻力区域,该指标会显示特殊信号,表明该支撑/阻力区域可以作为实际的卖出或买入信号。在这种情况下,支撑/阻力区域的强度会增强,因此从该区域进行交易的成功率也会更高。这正是该指标的核心理念。 SR区域也使止损和止盈的操作更加便捷。根据信号方向,可以将SR区域上方或下方的空间用作止损位。此外,相对的SR区域也可以用作潜在的止盈区域。 我还免费向所有 Apollo SR Master 指标的用户提供我的“Apollo 价格行为系统”指标。这两个指标结合使用将帮助您找到更好的入场点。 购买后请联系我,即可免费获得我的交易技巧以及我的“阿波罗价格行为系统”指标作为赠品!
FX Power MT4 NG
Daniel Stein
4.95 (20)
FX Power:分析货币强度,助您做出更明智的交易决策 概述 FX Power 是一款专业工具,帮助您全面了解主要货币和黄金在任何市场条件下的真实强度。通过识别强势货币用于买入,弱势货币用于卖出, FX Power 简化了交易决策,并帮助您发现高概率的交易机会。不论您是想跟随趋势还是通过极端的 Delta 值预测反转,这款工具都能完美适应您的交易风格。别再盲目交易——用 FX Power 让您的交易更加智慧。 1. 为什么 FX Power 对交易者极具价值 实时货币和黄金强度分析 • FX Power 实时计算并显示主要货币和黄金的相对强度,助您全面了解市场动态。 • 监控领先或落后资产,轻松识别值得交易的货币对。 全面的多时间框架视图 • 跟踪短期、中期和长期时间框架的货币和黄金强度,以便将您的交易策略与市场趋势保持一致。 • 无论是快进快出的短线交易还是更长期的投资策略, FX Power 都能为您提供所需的信息。 Delta 动态分析用于趋势和反转 • 极端 Delta 值常常预示反转机会,而平缓的 Delta 变化则确认趋势延续。 • 使用 Delta 分析,轻
Katana Scalper Pro
Yuki Miyake
4 (4)
MQL5マーケットの厳格な「第四条」ガイドラインに完全準拠した英語版の全文です。 MQL5では英語が主言語となるため、このテキストを説明文の冒頭(日本語より上)に配置することを強くお勧めします。専門的かつ冷静なトーンで作成しており、世界中のプロトレーダーに「技術的根拠のあるツール」として認識される構成になっています。 KATANA Scalper for MT4  Product Overview KATANA Scalper for MT4 is a high-performance technical analysis indicator optimized for the MetaTrader 4 platform. It is specifically engineered to address the two most significant challenges in short-term trading (scalping and day trading): Price Noise and Signal Lag . Utilizing a proprietary s
购买此指标即可免费获得我的专业交易管理器。 首先,值得强调的是,这个交易系统是一个非重绘、非重画和非滞后的指标,这使得它非常适合手动和机器人交易。 在线课程,手册和下载预设。 “智能趋势交易系统 MT5”是专为新手和经验丰富的交易者量身定制的综合交易解决方案。它结合了超过 10 个优质指标,具有 7 多个强大的交易策略,使其成为适用于各种市场条件的多功能选择。 趋势跟随策略:提供精确的入场和止损管理,以有效地跟随趋势。 反转策略:识别潜在的趋势反转,使交易者能够利用区域市场的机会。 剃头策略:专为快速准确的日内交易和短期交易而设计。 稳定性:所有指标都不会重绘、不会重画和不会滞后,确保可靠的信号。 定制:支持自定义策略,以满足个人交易偏好。超过 7 种策略和组合可帮助您找到最佳策略。 信号清晰度:提供箭头信号,以指示清晰的入场和退出点。 实时警报:通过交易进出警报使交易者保持了解。 深入分析:提供更高时间框架的趋势分析和实时交易监控。 自适应颜色编码:利用蜡烛颜色编码来显示成交量、趋势和反转蜡烛信号。通过蜡烛颜色分析市场方向。 “智能趋势交易系统 MT5”赋予交易者必要的工具,以便在
FX Levels MT4
Daniel Stein
5 (2)
FX Levels:适用于所有市场的高精度支撑与阻力 快速概览 想要精准确定适用于任何市场(外汇、指数、股票或大宗商品)的支撑与阻力吗? FX Levels 将传统的“Lighthouse”方法与前沿的动态分析相结合,实现近乎通用的准确性。依托真实经纪商经验和自动化的每日与实时更新, FX Levels 帮助您捕捉价格反转点、设置合理的盈利目标,并自信地管理交易。立即使用,体验更准确的支撑/阻力分析如何助力您的交易更上层楼! 1. 为什么 FX Levels 对交易者非常有利 极度精准的支撑 & 阻力区 • FX Levels 专为不同经纪商提供的行情源和时间设置而设计,可生成几乎相同的价位区,解决数据不一致的常见问题。 • 这意味着无论您在哪里交易,都能获得稳定一致的水平线,为策略打下更加牢固的基础。 结合传统与先进技术 • 通过将久经考验的“Lighthouse”方法与动态分析相融合, FX Levels 不仅限于每日刷新,还可针对新的价格波动进行即时更新。 • 您可以选择经典的静态方式,或实时捕捉新出现的水平,以贴近最新的市场行为。 识别清晰的反转点 • FX Lev
The Super Arrow Indicator provides non-repainting buy and sell signals with exceptional accuracy. Key Features No repainting – confirmed signals remain fixed Clear visual arrows: green for buy, red for sell Real-time alerts via pop-up, sound, and optional email Clean chart view with no unnecessary clutter Works on all markets: Forex, gold, oil, indices, crypto Adjustable Parameters TimeFrame Default: "current time frame" Function: Sets the time frame for indicator calculation Options: Can be set
Adaptive Volatility Range
Stanislav Konin
5 (3)
Adaptive Volatility Range [AVR] is a powerful tool for identifying key trend reversal points. AVR accurately reflects the Average True Range (ATR) of volatility, taking into account the Volume-Weighted Average Price (VWAP). The indicator adapts to any market volatility by calculating the average volatility over a specific period, ensuring a stable rate of profitable trades. You receive not just an indicator but a professional automated trading system , AVR-EA . Advantages: Automated Trading Sys
Trend Screener
STE S.S.COMPANY
4.79 (95)
趋势指标,趋势交易和过滤的突破性独特解决方案,所有重要趋势功能都内置在一个工具中! 它是 100% 非重绘多时间框架和多货币指标,可用于所有符号/工具:外汇、商品、加密货币、指数、股票。 限时优惠:支撑和阻力筛选指标仅售 50美元,终身有效。(原价 250 美元)(优惠延长) 趋势筛选器是有效的指标趋势跟踪指标,它在图表中提供带有点的箭头趋势信号。 趋势分析器指标中可用的功能: 1.趋势扫描仪。 2. 具有最大利润分析的趋势线。 3.趋势货币强度计。 4. 带有警报的趋势反转点。 5. 带有警报的强趋势点。 6. 趋势箭头 每日分析示例,每日信号表现...等与我们的趋势筛选指标,可以在这里找到: 点击这里 限时优惠:Trend Screener Indicator 仅售 50 美元且终身可用。原价 125$) 通过访问我们的 MQL5 博客,您可以找到我们所有的高级指标以及分析示例、每日信号表现...等。 : 点击这里 我们的趋势系统由 2 个指标组成: 1. Trend Screener Indicator:显示趋势仪表盘、图表中的趋势线、入场点...等。 2. Trend
Shogun Trade
Yuki Miyake
5 (1)
SHOGUN Trade - Strategic Market Structure & Multi-Timeframe Dashboard Concept: The Commander’s Perspective In the battlefield of trading, getting lost in localized price fluctuations (noise) is the most significant risk to capital. SHOGUN Trade is engineered to elevate a trader's perspective from "reactive" to "strategic," providing a comprehensive overview of market structures across multiple time horizons. This system monitors seven timeframes (M1 to D1) simultaneously, quantifying market m
Basic Harmonic Patterns Dashboard
Mehran Sepah Mansoor
5 (3)
该仪表盘显示所选符号的最新可用谐波形态,因此您可以节省时间并提高效率 /  MT5 版本 。 免费指标:  Basic Harmonic Pattern 指标列 Symbol: 显示所选符号 Trend:   看涨或看跌 Pattern:  形态类型(Gartley、蝴蝶、蝙蝠、螃蟹、鲨鱼、Cypher 或 ABCD) Entry:   入口价格 SL: 止损价 TP1: 第一止盈价 TP2: 第二次获利价格 TP3: 第三次获利价格 Current price:  当前价格 Age (in bars): 最后绘制的模式的年龄 主要输入 Symbols : 从 "28 种主要货币对 "或 "选定符号 "中选择。 Selected Symbols : 希望监控的符号,用逗号分隔("EURUSD,GBPUSD,XAUUSD")。如果您的经纪商为货币对设置了后缀或前缀,您必须在以下两个参数中添加(货币对前缀或货币对后缀)。 Max Iteration: 调整模式的最大迭代次数(如果该值越小,则模式越少,性能越快;如果该值越大,则模式越多,性能越慢)。事实上,它的工作原理如下:如果该值
Atomic Analyst
Issam Kassas
5 (3)
首先值得强调的是,该交易指标是非重绘、非延迟的指标,这使其成为手动和机器人交易的理想选择。 用户手册:设置、输入和策略。 Atomic Analyst是一种PA价格行动指标,利用价格的力量和动量来寻找市场上更好的机会。配备了高级过滤器,可帮助去除噪音和假信号,并提高交易潜力。使用多层复杂的指标,Atomic Analyst扫描图表,并将复杂的数学计算转化为任何初学者都能理解并用来做出一致交易决策的简单信号和颜色。 “Atomic Analyst”是专为新手和经验丰富的交易者量身定制的综合交易解决方案。它将高级指标和一流功能融合为一体的交易策略,使其成为所有类型交易者的多功能选择。 日内交易和剥头皮策略:专为快速准确的日内交易和短期交易而设计。 日内和摆动交易策略:可用作追求价格大幅波动的日内和摆动交易者的可靠工具。 多货币和市场:凭借其可靠的精度,在不同的工具和市场上运作。 多个时间框架:可在多个时间框架上使用,性能良好。 稳定性:所有指标均不重绘、不重绘和不滞后,确保可靠的信号。 信号清晰度:提供箭头信号,用于清晰的入场和出场点。 实时警报:通过交易入场、SL和TP警报通知交易者
AW Breakout Catcher
AW Trading Software Limited
5 (14)
价格水平细分、高级统计、止盈计算和 3 种通知类型。 好处: 不要重绘你的结果 严格在蜡烛收盘时发出信号 假击穿过滤算法 它适用于任何趋势策略。 适用于所有工具和时间序列 手册和说明 ->   这里 / 问题解决 ->   这里 / MT5 版本 ->   这里 如何使用指标进行交易 只需三个简单的步骤即可使用 AW Breakout Catcher 进行交易: 第 1 步 - 开仓 收到买入信号,成功率超过 70% 第 2 步 - 确定止损 通过相反的信号选择中继线 第 3 步 - 定义止盈策略 策略一:达到 TP1 时平仓 策略 2:达到 TP1 时平仓 50%,达到 TP2 时平仓剩余 50% 策略 3:根据相反信号平仓 统计模块 为了更好地选择配对,请使用内置的统计计算。 计算交易 - 给出统计数据的信号总数 成功评级 - 达到 TP1 的信号百分比,或反转那些正获利的信号时的百分比 TakeProfit1 Hit - 达到 TP1 的信号百分比 TakeProfit2 Hit - 达到 TP2 的信号百分比 ExitProfit - 未达到 TP1 的信号百分比,但通过新信
Prop Firm Gold Indicator
Mohit Dhariwal
5 (3)
This is a unique  Gold Indicator On channel trading pullbacks and gives accurate entries on gold and major Fx Pairs on M15tf. It has the ability to pass any prop firm Challenge and get accurate entries on gold and major fx pairs. EA FOR PROP FIRM AND CHANNEL INDICATOR IS FREE ALONG WITH THIS POWERFUL INDICATOR ALONG WITH THE BEST SET FILE FOR FIRST 25 USERS. Strategy tester report is in comment section. INDICATOR FEATURES: INDICATOR IS BEST ON M15 GIVES ACCURATE ENTRIES  EA AND CHANNEL INDICATO
作者的更多信息
One King Stocks and Crypto
Dimitri Nepomniachtchi
What we are talking about: This assistant can serve you for a long trading career. Optimized for those cases when you work on forecasts and want to buy a stock or crypto coin cheaper and sell it more expensive. Do you have an estimated closing price for profit: - If yes, then we will set up the robot to reach the price with greater profit and less risk. - If not, if you do not know exactly how much a stock or coin can grow, then you can maximize profit even with a small increase, due to a tempor
FREE
BreakOut Space Fixation
Dimitri Nepomniachtchi
4.5 (2)
An EA version is being prepared. You can send a private message "notify about EA version". EA will be versatile with many settings for trading on various indicators. The new EA will also allow trading on this indicator. For example, allowing signals after X signals/bars to X signals/bars in one direction, before changing direction. If Break Out happened before/after the signal of another indicator. Collect profit on each next signal above/below the previous one. Send a private message "notify
FREE
BreakOut Space Center Projection
Dimitri Nepomniachtchi
5 (2)
Using the indicator you can 1 Identify the trend and follow the large and small trends by drawing lines. When the price leaves the corridor of the lines, then with a high probability the price will go to the next line and reverse on it. 2 Long-line - Lay lines along the centers of fractals, the indicator can detect the fractal of the second point (Number bars analysis). Often the price can approach the line even after a week or a month and you can open a reversal trade. If the wave has passed w
FREE
Magics Scanner Flip addon
Dimitri Nepomniachtchi
This addon will pick up opened orders of experts by magic number and transfer to EA`s HOLDER inverted. If your trading bot opens a Buy order, then EA`s HOLDER will open a Sell order. If your trading bot opens a Sell order, then EA`s HOLDER will open a Buy order. Then EA`s HOLDER works with the orders opened by it according to your settings: - Copy, do not copy exit. - Change the stops to your own. SL TP. Original or Real or leave the original. - Set trailing, there are two of them. This can work
FREE
Magics Scanner addon
Dimitri Nepomniachtchi
EA   scans trades by magic numbers from trading robots in mt4 terminals. Then it passes the data on trades to   EA`S HOLDER     which filters the entry and exit signals by applying its own filters for opening and closing orders. Thus   EA`S HOLDER    conducts its trading based on the signals of running robots. Opening your own orders. Your trading robots transmit signals to this scanner.   The scanner transmits signals to the senior EA and you have a lot of opportunities.   Such as: - Maintain
FREE
Live Go
Dimitri Nepomniachtchi
Set your favorite indicator and start trading. Found your favorite indicator by virtual tests. - Virtual trading - Without opening trades on a live or demo account. ---- All transactions are saved only for you and trading statistics will be displayed on the chart. ---- Live Go conducts a full trading test in real time, showing clear test reports. ---- Live Go opens and closes trades without a spread / with spread, which allows you to check your trading strategy regardless of the broker’s condi
EAs Holder
Dimitri Nepomniachtchi
EA's HOLDER - Manage multiple trading robots under full control EA's HOLDER is an advanced system for traders that helps to effectively manage multiple trading robots (EA). With the program, you can distribute your robots across separate virtual accounts and customize each one with individual risks and trading parameters. The price is temporarily reduced. This is an expensive technical assistant that has gone through many versions, ideas, time and money. In my personal use as a moderator of lim
Fast flat
Dimitri Nepomniachtchi
The Fast flat indicator can recognize and notify you of short flats after the price rises or falls. Where the price can rush further or reverse. ++ The indicator is open to arbitrary flat settings. You will probably have to conduct quite a few tests, approaching the best results. I will be very grateful if you share in the comments your tests, parameters and advice to other users, who may also be able to improve your results. Should I use it for entry signals, order stops, hedging...? - The indi
An indicator of independent technical analysis by fractals and breakouts. Semi-automatic drawing of lines along points "A and B" in a matter of clicks. The classic version is available for free in my store under the name " BreakOut Space Center Projection " You can use it for your pleasure, the results of the indicators will be the same, but I wanted so much to simplify the process of technical analysis and created a quite comfortable indicator. My feeling is how to change from an old car to a n
ECNture Raging Gold
Dimitri Nepomniachtchi
Gold is a popular trading instrument for traders. It offers accessible conditions for long-term trading and scalping for quick profits. Read it, don't look between the lines, only then will you understand what kind of monster this is, this is the word I screamed when my keys opened the lock to the world of trade, which shook me up completely and opened many more doors, both in trade and in my career. The stars of fate led me to create a trading robot for gold. Specifically, gold. It's not just c
ECNture Piranha Bar
Dimitri Nepomniachtchi
A flock of piranhas devours trading bars on the chart, collecting profits. They hunt, receive signals to act, and enter the market. They don't wait long for distant prey, resting until it's nearby or switching to a new bar and ravaging it as it rises or falls. This happens so quickly and imperceptibly on the chart, as the number of closed orders increases in the statistics window and the profit line curves upward. Your terminal may freeze, but underneath, the piranhas are actively fighting to co
筛选:
无评论
回复评论