Speed Meter MT5

🚀 XP Speed Meter MT5: Measure True Market Momentum 📈

Description

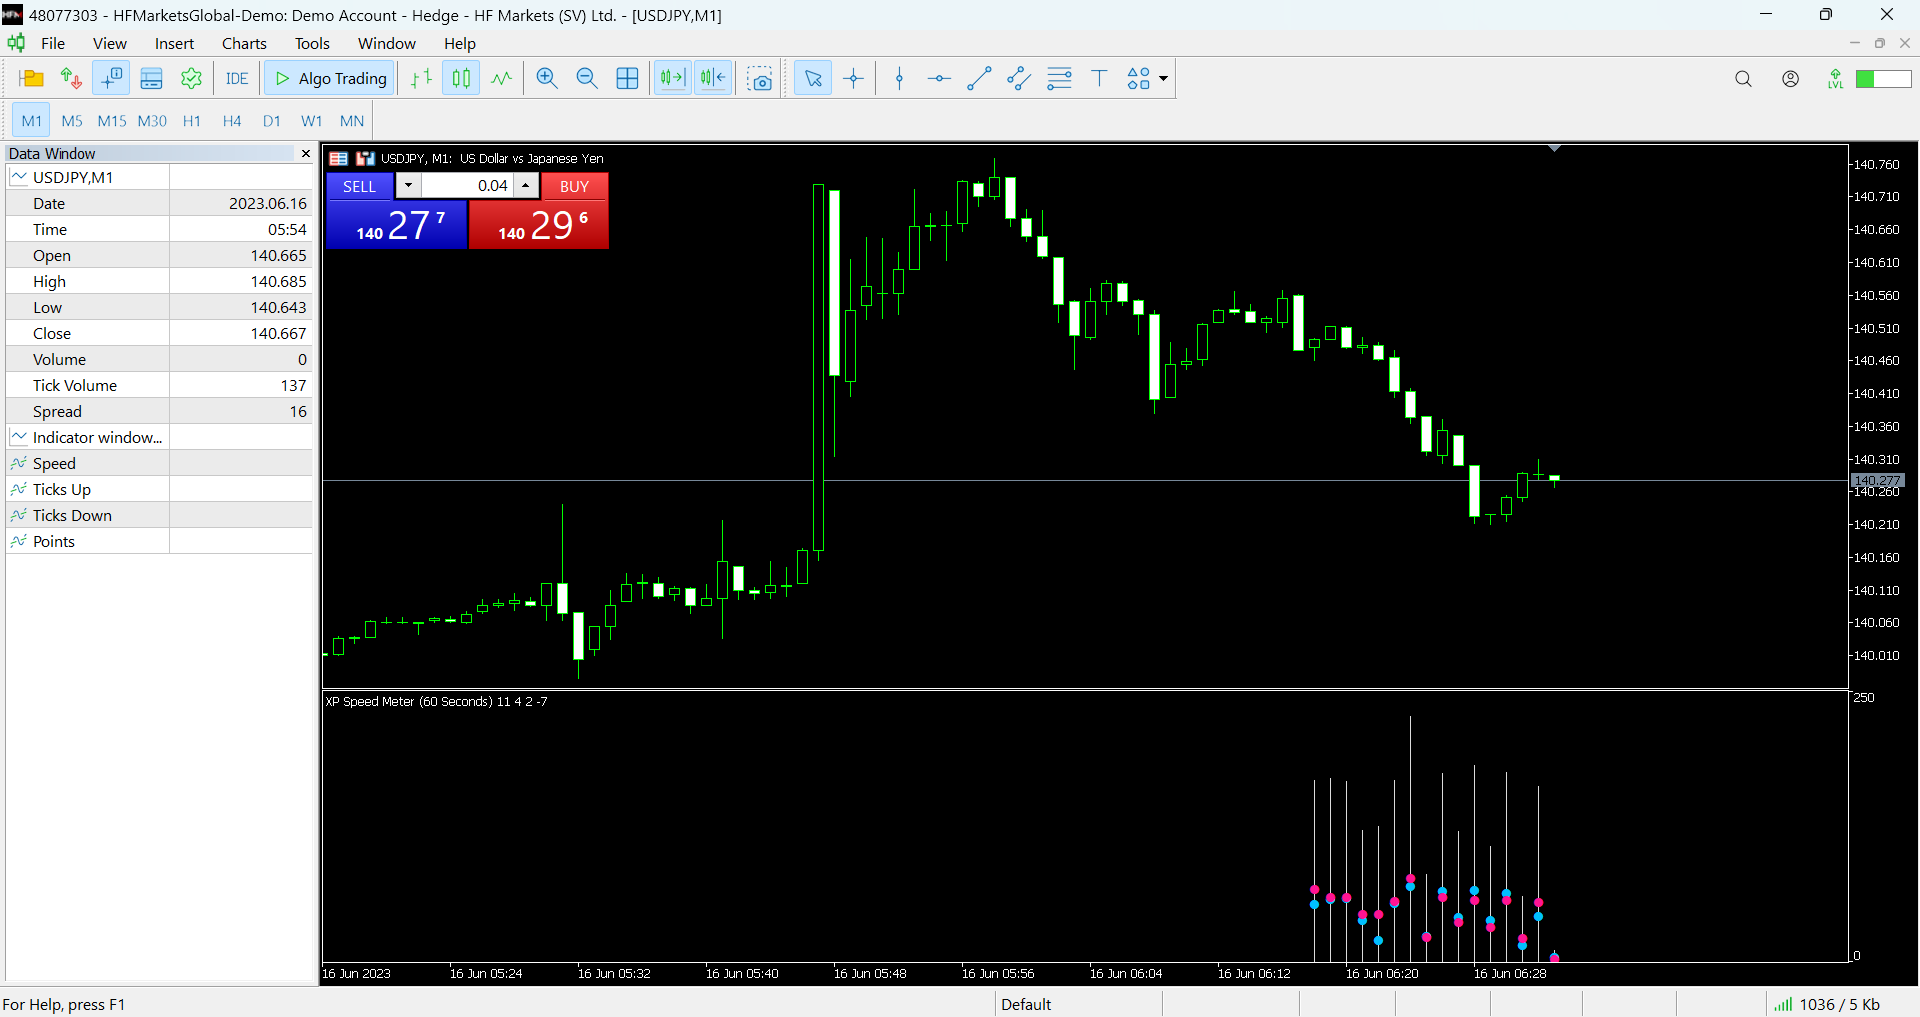
The XP Speed Meter MT5 is a unique and powerful custom indicator designed to reveal the true speed and momentum of price movement. Unlike standard indicators that rely on chart-bar closing prices, the Speed Meter dynamically calculates the volume of bullish and bearish ticks, and the resulting price movement, over a specific, user-defined time period.

This innovative approach allows you to cut through the noise of standard timeframes (like M5, H1, etc.) and focus on the raw velocity of the market, giving you a critical edge in identifying explosive moves before they happen.

Key Features & Trading Benefits

Custom Time-Based Volatility

  • Define Your Own Bar: Set the indicator to measure speed over a specific period in Seconds, Minutes, or Hours .

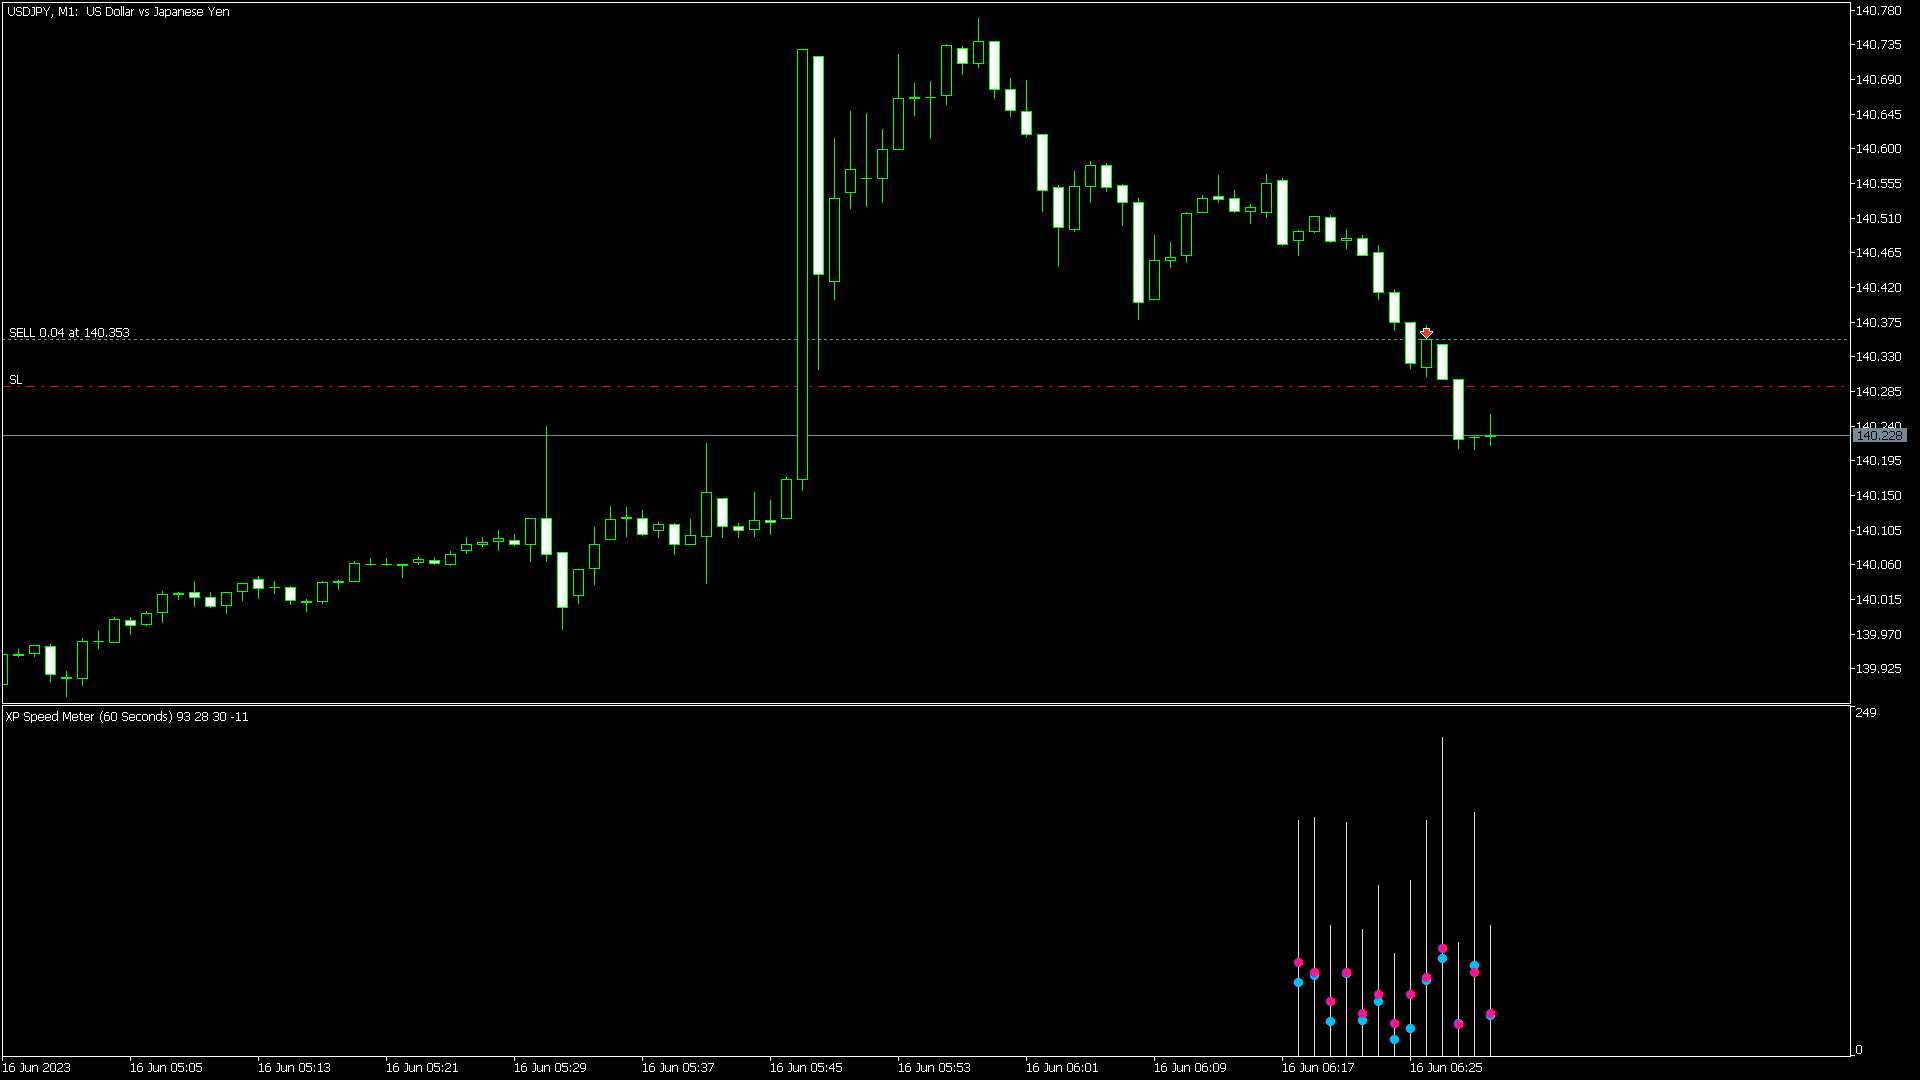
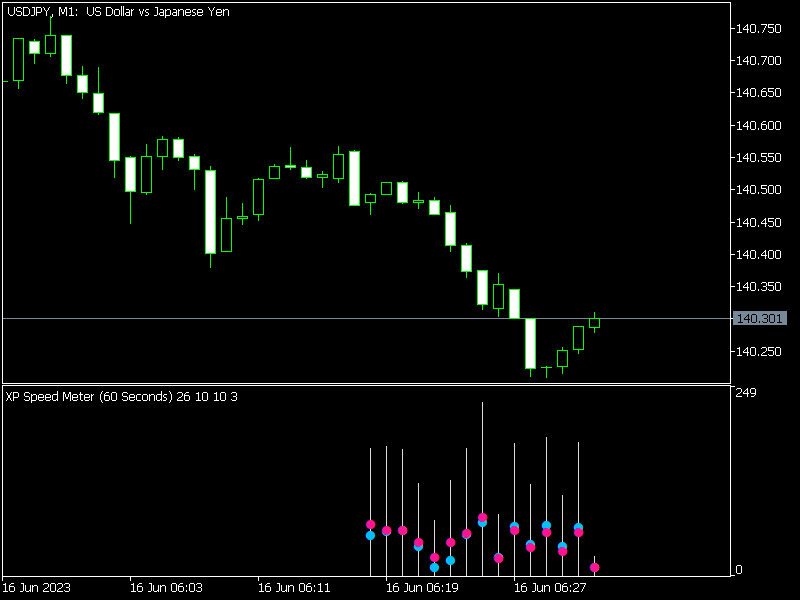
  • Raw Momentum Display: The indicator plots a histogram (Speed buffer ) that represents the velocity of price movement within your custom period.

  • Tick Analysis: Tracks the total number of Ticks Up and Ticks Down within the measurement period, providing a clear view of micro-momentum shifts.

Actionable Momentum Alerts

  • Points-Based Alert System: Calculate the total price movement (Points ) within the custom period.

  • Explosive Move Notifications: Instantly receive alerts when the measured price movement (in points) exceeds a customizable threshold (Alert Points ), signaling a significant breakout or surge in momentum.

  • Directional Alerts: Alerts clearly distinguish between strong Buy momentum (+AlertPoints) and strong Sell momentum (−AlertPoints) .

Comprehensive Alert Options

Never miss a high-speed opportunity with multi-channel alerts:

  • Pop-up Alerts (Visual on platform)

  • Mobile Notifications (Push to your MQL5 app)

  • Email Notifications (For monitoring away from the screen)

Clean & Customizable Display

  • Separate Window: Runs in its own sub-window, keeping your main chart clean .

  • Control History: Set the Max Bars to limit the indicator's calculation and display history.

  • Bar Synchronization: Option to Wait New Bar to ensure calculations align with the main chart's new bar opening.

Perfect For

  • Breakout Traders: Identify the exact moment momentum surges to confirm a breakout.

  • Scalpers and Day Traders: Pinpoint high-velocity moves that lead to quick profits.

  • Volatility-Focused Traders: Gauge market acceleration and deceleration with unprecedented precision.

Technical Details

  • Platform: MetaTrader 5 (MT5)

  • Version: 1.1

  • Developer: Coders Guru (XPWORX.COM)

  • Indicator Name: XP Speed Meter

⚡ Gain an unfair advantage by trading with speed! Get the XP Speed Meter MT4 and quantify true market momentum!

You can download a demo version (works only with EURUSD) from here:

https://www.mql5.com/en/blogs/post/753147


推荐产品
Pure Diamond Trend Exhaustion Pure Diamond Trend Exhaustion 指标旨在识别市场动能枯竭区域及潜在的价格反转点。核心算法基于价格极值和蜡烛图影线结构分析,能够精准识别超买和超卖水平,且无需使用传统的滞后型振荡指标。 技术特性: 无重绘 (No Repaint): 指标信号(菱形)在当前蜡烛关闭后立即固定。一旦信号形成,不会随价格后续波动而消失或改变位置。 噪声过滤算法: 程序分析蜡烛实体与影线的比例,有效过滤既定价格区间内的虚假波动。 通用性: 指标适用于所有资产类型,包括外汇 (Forex)、加密货币、股指和商品。可在任何时间周期内使用。 极简界面: 采用图形化符号显示,避免占用交易者过多的图表空间,便于与其他技术分析方法结合。 使用方法: 该指标生成两种类型的信号: 粉色菱形 (Pink Diamond): 形成于局部高点,指示上涨动能枯竭。 蓝色菱形 (Blue Diamond): 形成于局部低点,指示下跌动能枯竭。 默认设置: 指标自带的预设参数已针对 M15 和 M30 时间周期进行了优化。这些设置在信号准确性与出现频率
E2C Lines
Eduardo Cristian De Carvalho
Descubra o poder do nosso indicador de alta precisão, projetado para identificar as regiões de alvo e exaustão de qualquer ativo. Testado e validado por mais de 3 anos nos mercados de mini dólar e mini índice, ele oferece confiabilidade e eficácia incomparáveis. Transforme sua estratégia de trading e alcance novos patamares de sucesso com nossa ferramenta inovadora.
Squeeze Momentum Pro — Volatility Compression and Momentum Indicator Squeeze Momentum Pro is a versatile MetaTrader 5 indicator designed to identify periods of market compression and the momentum that may follow. It compares two different views of market volatility to detect when price movement becomes unusually tight. These compression phases often indicate that energy is building before a larger market move. When the compression ends, the indicator helps traders observe whether momentum is de
FREE
FFXMV Forex Dashboard Indicator MT5
Opengates Success International
FULL FOREX MARKET VIEW 仪表盘指标 MT5 这是一个为 MT5 平台开发的自定义指标,旨在为交易者提供对市场的全面了解。它使用实时数据来分析市场,并显示成功交易所需的所有信息。 安装: 在将此指标附加到图表窗口之前,请进入 MT5 的“市场报价”面板,隐藏所有不需要或不交易的货币对,只保留你交易的那些。原因是 FFMV 仪表盘会显示 MT5 市场报价中的所有货币对,最多可显示 26 种。如果超过 26 种,FFMV 仪表盘上的字体和图像会变得模糊并失真!将无法正确显示。 用途: 单一交易 组合交易(请参阅截图) 也可用于多订单交易 用于确认来自你交易系统的信号等 组件: 时间框架:从 M1 到 MN1 当前蜡烛状态(买/卖) 趋势:货币整体趋势 影响:货币波动的幅度/波动性(见下): Build-up: 货币刚开始形成趋势 Good: 货币走势逐渐增强 High: 值得关注 Strong: 方向应予以考虑 Very strong: 接近完美 Excellent: 信号达到最佳,可以交易 变化:货币横盘、上涨或下跌 评级:交易可靠性 如何使用仪表盘: 所有时间框架从
Vision:产品说明 Quant Atlas 的 Vision 是一款多组件反转信号指标,旨在识别流动性市场中的短期看涨和看跌衰竭点。该模型整合了多个独立的技术证据层,包括动量行为、均值回归压力、基于波动率的条件、趋势互动、时机结构,以及与移动平均线相关的确认因素。最终结果会直接转换为图表上的可视化信号强度标记。 该指标主要用于反转分析。它的目标是突出价格可能已经过度延伸、结构上变得脆弱,或正在接近潜在方向转换的区域。Vision 最适合作为决策辅助层,与价格行为、市场结构、蜡烛图行为、支撑与阻力、流动性区域,以及更广泛的趋势背景结合使用。 信号理念 Vision 不会以相同方式处理所有反转条件。每个信号都会根据其背后的证据数量和质量进行分类。 只有当模型的综合评分达到预设的信号强度区域时,信号才会生成。内部组件之间的一致性越强,信号分类的重要性就越高。 该指标使用三个实用的信号强度等级: 蓝色三角形:中等信号强度 蓝色三角形代表中等反转信号强度。 这些信号表示模型已经检测到有意义的看涨或看跌反转条件,但证据还不足以将其归类为高强度信号。 当模型检测到中等看涨反转倾向时,蓝色看涨三角
AlphaPulse Quant (脉冲动能反转系统) ​ 策略简介 ​AlphaPulse Quant 是一款专为捕捉市场机构洗盘及极端超买超卖拐点而设计的智能化量化交易系统。策略放弃了传统指标的滞后性跟随,转而采用多维动能脉冲算法,在趋势精疲力竭、散户疯狂追涨杀跌时逆向布局。配合独特的时间锁仓过滤器与绝对风控模型,旨在打造高逻辑容错率、低回撤的长期资产增值曲线。 ​ 核心技术优势 ​1. 脉冲动能拐点识别 ​系统内置双重动态频率感知器。当市场在短期内爆发不合理拉升或恐慌性抛盘,导致双重频率发生非线性偏离与交叉时,系统将其识别为“机构诱多/诱空”信号。EA 将在散户情绪最高昂的拐点果断进行反向伏击,实现真正的高胜率“摸顶吃底”。 ​2. 动态时间锁仓过滤器 ​频繁交易是爆仓的元凶。AlphaPulse 独创平仓冷却锁(Time-Lock)机制。当一笔交易获利结清或触及风控后,系统会自动对当前图表的时间周期进行“动态断层隔离”,强制进入冷静期。该技术能彻底阻断震荡行情中的连续扫损以及单边行情中的过早二次入场,让账户永远具备呼吸空间。 ​3. 绝对风险控制矩阵 ​本策略绝不在市
ICT Timings Macros Liquidity Map
Janardo St Jude Williamson
ICT Timings & Macros + Liquidity Map draws the full ICT session toolkit on your chart in one indicator, so you're not stacking five separate tools to see your timing framework. Everything is anchored to the 18:00 EST daily reset and fully configurable — colors, styles, widths, fonts, label positions, and history depth — down to the individual line. Session Dividers (12h / 6h / 3h) 18:00 EST-anchored vertical dividers at the 12-hour, 6-hour, and 3-hour level, each independently enabled. Every div
Trade Vision Panel
Abderrahmane Benali
IMPORTANT! After your purchase, please contact me. Overview: Trade Vision Panel is a premium, lightweight trading dashboard for MetaTrader 5 designed to display your key trading information directly on the chart. It combines performance analytics, open-position monitoring, and a real-time news filter — all in one smart, elegant interface. Perfect for traders who want to see everything
Divergent Stochastic Filter II Catch Reversals Early, Filter Noise, Trade with Confidence The Edge: Why This Stochastic is Different  Every trader knows the Stochastic oscillator. But knowing when to trust its signals, that's the real challenge. The Divergent Stochastic Filter II transforms this classic indicator into a precision reversal detection system by adding critical elements: divergence intelligence, signal filtering and exhaustion detection.  While standard Stochastic oscillators fire s
CapitalSol Forex MTF Scanner MetaTrader 5 多时间框架外汇趋势扫描器 CapitalSol Forex MTF Scanner 是一款多品种、多时间框架市场分析指标,旨在直接通过 MetaTrader 5 提供结构化的外汇市场方向概览。 交易者无需逐个打开并检查多个货币对图表。扫描器可以在一个紧凑的仪表板中显示所选外汇品种,并同时分析多个时间框架上的市场方向。 标准仪表板使用 M15、H1、H4 和 D1,并将每个市场和时间框架分类为 BULL、BEAR、NEUTRAL 或 LOADING。 该指标的目的并不是自动做出交易决策,而是帮助交易者更高效地识别不同时间框架之间的趋势一致性和多时间框架共振。 工作原理 趋势分类基于 EMA 20 和 EMA 50。 BULL: EMA 20 位于 EMA 50 上方。 BEAR: EMA 20 位于 EMA 50 下方。 NEUTRAL: 当前没有有效的方向分类。 LOADING: 所需的历史数据或指标数据尚未完全加载。 扫描器使用已经确认并收盘的K线进行分析。因此,趋势分类不会
Stochastic Dashboard PRO – Multi-Timeframe Trend & Signal Analyzer Short Description: A professional Stochastic Dashboard that displays %K and %D values across multiple timeframes, highlighting overbought/oversold conditions for quick trend analysis. Perfect for traders seeking clarity and speed. Full Description: The Stochastic Dashboard PRO is a powerful tool designed for traders who want instant access to multi-timeframe stochastic signals without switching charts. It displays %K and %D val
Order Block & FVG Confluence PRO builds on the base OBF indicator with one genuine upgrade: delta volume confirmation. Every BOS/Order Block/FVG signal is checked against the day's real cumulative order flow before it fires — fewer, higher-conviction signals, not more noise. What's new in PRO: - Delta-confirmed signals — a BUY only fires when the day's cumulative delta volume (an approximation of buy vs. sell pressure derived from where each candle closes within its range) is net positive; a S
DriftStrike
Okechukwu Maxwell Okeke
DriftStrike — Breakout Confirmation Indicator When momentum confirms the break. DriftStrike is a MetaTrader 5 technical indicator designed to highlight potential directional continuation opportunities following confirmed price breakouts. Built for traders who prefer selective signals and uncluttered charts, DriftStrike identifies qualifying bullish and bearish setups without requiring complicated configuration. Key Features Bullish and bearish confirmation arrows Selective breakout and continuat
Omega Matrix Pro
Mahdi Abbas Ahmed Ali Alrayes
Omega Matrix Pro Advanced Multi-Indicator Confirmation System for MetaTrader 5 Omega Matrix Pro is a professional MT5 indicator designed to help traders identify high-probability BUY and SELL opportunities by combining confirmations from multiple technical indicators into a single intelligent decision. Instead of relying on one indicator, Omega Matrix Pro analyzes market conditions using a complete confirmation matrix, providing a clear visual dashboard, entry arrows, confidence score, and insta
在真的发生什么之前,它一直闭着嘴。Volatility Explosion MTF度量动量在K线之间的变化,只有当它同时越过两个阈值时才报告:一条布林带的宽度,以及由一百根K线的真实波幅搭起的死区。同时越过两者的那根K线,是一次带方向的真实波动率扩张,而在它们之下的一切,什么都不是。它是免费的:没有试用期,没有锁定功能,没有升级页面。 喷发是这根K线的MACD与上一根K线的MACD之差,再乘以一个把它放到价格尺度上的灵敏度。爆发阈值是收盘价上一条布林带的宽度,也就是乘数的两倍乘以标准差。死区取自该方法的第二版:在一百根K线上按Wilder方式平滑的真实波幅,乘以它自己的乘数。 当喷发的幅度同时高于阈值和死区时,这根K线被算作爆发性的,而喷发的符号说明是哪个方向。信号是一次爆发的开始,也就是它第一次同时越过两者的那根K线。强度倍数只是把它评为2而不是1;真正起过滤作用的只有爆发阈值本身,与原作完全一致。 图表上显示的内容 在独立窗口里:爆发阈值和死区画成两条线,喷发画成柱状图,它的方向就是它的符号,浓淡则说明它在扩大还是在消退。背离在喷发序列上寻找,而不是在阈值上,因为阈值没有方向,在它
FREE
Xtrade Trend Detector
Dago Elkana Samuel Dadie
Xtrade Trend Detector is an indicator capable of finding the best opportunities to take a position in any stock market. Indeed, it is a great tool for scalpers but also for Daytraders. You could therefore use it to identify areas to trade, it fits easily on a chart. I use it to detect trends on Big timeframes and take positions on Small timeframes. Don't hesitate to give me a feedback if you test it.
SuperSmooth WMA Trading System Pro 是一套结构化、基于规则的专业交易系统,旨在过滤低质量和随机信号,帮助交易者只在高概率条件下进行操作。系统要求趋势方向、动能强度、市场结构以及高周期趋势完全一致,只有在四个独立过滤条件全部满足时才会生成信号。 每一个入场信号都经过严格的多层验证,避免在震荡或无趋势环境中产生错误交易。系统通过清晰的箭头提示多头入场、空头入场以及对应的离场信号,并结合智能K线着色功能,使交易者能够在不查看其他指标的情况下快速判断市场状态。 绿色K线表示多头完全一致,红色K线表示空头完全一致,灰色K线表示WMA带宽过窄,市场处于震荡阶段,应保持观望。 该系统适用于外汇、指数、商品及加密货币市场,并兼容所有时间周期。推荐在H1、H4或日线周期使用以获得更稳定的信号质量。
Power House
Sabrina Hellal
PowerHouse v3 MT5 – Advanced Smart Money Concepts, KAMA Ribbon & MTF Matrix Short Summary: An institutional-grade SMC & ICT trading system featuring confirmed CHoCH/BOS market structure breaks, a 7-factor confluence engine (Grade A/B/C), adaptive trend ribbon, automated trade plans with live Won/Lost points metrics, and a 6-timeframe dashboard. Product Overview PowerHouse v3 is a professional-grade analytical indicator built for disciplined Forex, Indices, and Crypto traders on MetaTrader 5. Eng
Multi-Timeframe Breakout Pressure and Confirmation Dashboard TAGLINE Track compression, stored pressure, breakout direction, and confirmation in one dashboard. PRODUCT OVERVIEW BreakoutPulse Navigator MT5 is a professional multi-timeframe breakout dashboard for MetaTrader 5. It is designed to detect two different stages of a breakout: 1. Pressure building before the breakout 2. Directional confirmation after price leaves the channel The indicator combines: - Bollinger Band squeeze - ATR
FREE
Trade Replay Exit Optimizer 用不同的出场方式回测你自己的交易 你的入场可能没问题,但出场也许正在悄悄拖累你的收益。Trade Replay Exit Optimizer 会读取你真实的 MetaTrader 5 账户历史记录, 保留完全相同的入场 ,并在策略测试器中用不同的出场规则重新回放,让你终于能看清更好的止损、止盈、跟踪止损或时间出场是否能提升你的结果。 无需订阅,不会将你的交易上传给第三方,也无需学习新平台。一切都在你已经在用的 MetaTrader 5 内运行,使用你自己的经纪商数据。 专为 MetaTrader 5 打造。 它会根据你的成交历史,按仓位编号(position id)重建每一笔已平仓的持仓,包含成交量加权的入场价和出场价、佣金、库存费(swap),以及原始的止损和止盈。在策略测试器中,它会按真实的价格和时间重新注入每一笔入场,套用你替代的出场规则,并逐笔比较结果。结果以并排表格显示,并写入 CSV 文件以及包含两条资金曲线的 HTML 报告。由于优化标准是公开的,MetaTrader 5 优化器甚至可以搜索出对你的入场最有效的出场
RED ZONE Monitor Loss-Cut & Break-Even Risk Monitor for Averaging Traders (MT5) RED ZONE Monitor is a risk management indicator for traders who use averaging, scaling-in, or multiple open positions . It visually displays: The loss-cut (liquidation) risk zone The break-even price Based on current open positions, lots, and margin conditions This indicator does not provide entry signals. It does not promise profits. It shows where your account actually fails if price moves against you. What RED ZO
SkyGeniX
ʿAsm Mhmd Samy Asmaʿyl Rmdan
SkyGeniX: Innovative Solutions for Intelligent Automation SkyGeniX is a cutting-edge tool designed to simplify and enhance your workflows with intelligent automation. Whether you're managing complex tasks or optimizing performance, SkyGeniX offers a seamless, user-friendly experience tailored to your needs. Key features include: Smart Optimization : Enhance efficiency and achieve your goals faster with advanced algorithms. Customizable Settings : Tailor the tool to your specific requirements for
FREE
Wall of worry MT5
Illia Zhavarankau
Description: The Wall of Worry indicator allows you to assess market sentiment and possible reversals. The indicator represents three lines that are displayed in a separate window. Black line (trend) - the amount of volumes in the candle body. Red line (bears) - the amount of volumes in the upper shadow of the candlestick. Blue line (bulls) - the amount of volumes in the lower shadow of the candle. The idea is based on "Wall of Worry" - this is the periodic tendency of financial markets to
Canal de Máximos y Mínimos en Escalera Indicador avanzado para MT5 diseñado para analizar el rango diario del precio y construir niveles dinámicos en forma de escalera. El indicador calcula los máximos y mínimos reales de cada día, obtiene una distancia promedio histórica y la divide según el valor configurado en INPUT_Distancia . Con esa distancia genera niveles superiores e inferiores que sólo aparecen cuando el precio los alcanza. La línea amarilla representa el centro del canal. Desde ese pu
RSI Dashboard Pro
Abderrahmane Benali
RSI Dashboard PRO is a multi-symbol, multi-timeframe RSI monitoring indicator designed to help traders analyze Relative Strength Index values efficiently within a single panel. The indicator displays real-time RSI readings for selected symbols and timeframes, using a clear color scheme to highlight overbought, oversold, and neutral conditions. This allows users to quickly compare market states and identify areas of interest without switching charts. RSI Dashboard PRO includes interactive contro
Bober Real MT5
Arnold Bobrinskii
4.88 (16)
Bober Real MT5 是一个全自动的外汇交易智能交易系统(EA)。该机器人创建于 2014 年 ,在此期间完成了大量盈利交易,在我的个人账户上实现了超过 7000% 的收益增长 。经过多次更新, 2019 年版本 是最稳定、最优秀的。机器人可用于任何交易品种,但在 EURGBP、GBPUSD(M5 周期) 上表现最佳。使用错误的参数会导致较差结果。 真实账户的 set 文件仅提供给购买者。 ️ 主要优势 无马丁格尔、无对冲、无加仓,始终使用 SL/TP 。 高速测试与优化。 可选 Dynamic Take-Profit ,自动适应价格通道高低点。 内置 新闻日历过滤器 ,自动避开重大事件。 自动检测 GMT 偏移 。 针对实盘交易长期优化,结果稳定。 设置后可自动运行,无需干预。 参数说明 Core / Trading type_order — 订单执行类型 (默认 ORDER_FILLING_FOK)。 ReverseTrade — 反转交易方向。 ToolEnter — 入场工具 (RSI 或 None)。 RSI304 / NoRSIbars — RSI 周期与
Trend Sentinel V2
Dawid Aaron Zinserling
Trend Sentinel V2  — The Ultimate Directional Guard Trend Sentinel V2  is a powerful, visually intuitive indicator designed to give you a crystal-clear view of the market trend across any asset class . Whether you are trading Spike Markets (Boom, Crash, Step, Bull, Bear, Pain, Gain), Forex pairs , Indices , Commodities , or Crypto , the Sentinel provides a single, clean, dynamically colored midline that tells you exactly who is in control of the market—the buyers or the sellers. Instead of cl
FREE
IchimokuStructure
Venicius Soares Da Silva
Ichimoku Structure S/R is a chart-window dashboard for M1: it classifies price vs Tenkan / Kijun / cloud as bullish, bearish, or range, shows the nearest Ichimoku level as a live S/R reference, flags impulsive breaks against that structure with historical context, and optionally monitors deal execution vs quotes plus a live structure-episode validation panel. It draws no classic Ichimoku lines (display is labels/panel). Research baseline baked into the tool is EURUSD M1 (2016-08-17 → 2026-06-09)
This indicator is based on a mathematical formula which gives you the possibility to seek and find the right frequency of the movement, and to determine its key level; just adjust the frequency parameter! Simple and highly effective; using this indicator you can easily predict the next support and  resistance    levels of the day. Also, this indicator determines the range and the next two importants levels of the movement outside this range so far. SGFL3 and RGFL3  are levels with high certainty
TMA Centered Bands Indicator
Irina Cherkashina
5 (1)
The TMA Centered Bands Indicator for MT5 draws bands on the chart and shows the overall price trend. It displays three bands - the lower and upper boundaries of the channel and the median.   The bands are made up of moving averages, and each of them has an MA period. The name TMA comes from triangular moving averages, as the indicator draws triangular bands.   The price will fluctuate between these ranges whenever the trend changes direction, thus creating entry and exit points.   How to trade
FREE
该产品的买家也购买
Trend Sniper X
Sarvarbek Abduvoxobov
4.86 (44)
Trend Sniper X 是一款适用于 MetaTrader 5 的多周期趋势跟踪指标,可帮助交易者清晰精准地识别趋势方向和潜在的反转点。 适用于 MT4: https://www.mql5.com/en/market/product/193245 价格信息: 当前价格为促销价,随着后续更新和新功能的推出,价格可能会有所变动。 赠品优惠: 购买后联系作者,即可免费获取该指标的 Auto-Trade Assistant EA(自动交易助手 EA)。 Code2Profit 频道 通过多时间框架分析掌控市场! 如何使用 Trend Sniper X 最大化您的胜率:核心规则与交易时段技巧 技术规格 平台 MetaTrader 5 指标类型 多时间周期趋势指标 运行时间周期 任何图表时间周期,可独立选择更高的时间周期 (M1–MN1) 主要交易品种 外汇、黄金 (XAUUSD) 及其他差价合约 (CFD) 推荐账户 任何账户类型 可视化 彩色趋势蜡烛 (买入/卖出/微弱/变化) + 买入/卖出箭头 附加模块 交易时段方框 (悉尼、东京、伦敦、纽约) 主要功能 多时间周期趋势分析: 直接在
全新王者降临 - 指标 + 订单管理提示(TP1 + TP2 + TP3)+ 可选 Telegram 信号发送器 INCLUDED(免费) (完整交易与信号系统) 我们最强的黄金 EA: Gold Slayer 该指标包含先进的交易策略、可自定义订单管理系统,以及结合 Envelope 扩展的均值回归系统,并通过 RSI 等多重智能确认过滤器进行验证,以捕捉高概率反转入场机会,提供 BUY 与 SELL 信号。 你不仅能够学习如何交易,还能学会如何高效管理多个仓位,并利用之前盈利的持仓来覆盖亏损交易。 专为 M5 周期打造并优化,在 BTCUSD 和 XAUUSD 上表现尤为出色,因为这些市场的流动性能够让信号更加干净、可靠。 该指标会自动生成清晰的多头(Long)与空头(Short)信号,同时基于 ATR 自动计算入场位、止损位和止盈位,让风险管理从一开始就融入系统之中。 多 TP 系统设有三个渐进式目标位,你可以在 TP1 锁定部分利润、在 TP2 继续持仓,并在更大的行情中将仓位持有至 TP3,而这正是平均风险回报比真正开始大放异彩的地方。 默认参数开箱即用,已经针对稳定表现进行
Entry Points Pro for MT5
Yury Orlov
4.55 (152)
Entry Points Pro 会在您下单之前,告诉您在哪里入场、止损放在哪里、用多大的手数交易。 价格 现在 199 USD,按此价格出售 8 份,之后为 249 USD。最终价格为 349 USD。 我靠交易市场赚钱,并公开展示,所以我不需要把这个指标卖给所有人。它是为独立思考的交易者准备的工具,而不是一个神奇按钮。 没有突破,就没有交易。灰色箭头表示信号已取消:价格没有突破信号K线,因此没有入场,也没有亏损。 箭头在 K 线收盘时出现,并且不会重绘。只有两项设置:您的本金和每笔交易的风险。 付款前先验证:免费演示版可在 MT5 策略测试器中运行,只需两分钟。购买后,我会亲自帮您完成设置。 2019 年,我向全世界展示了这款指标的能力。我按它的信号手动交易,用的是真实账户,全程公开——账户在 Myfxbook 上接受监控,我还在 Facebook 上详细记录了这次实验。结果:10,000 美元在四个月内变成了 941,411 美元。风险是我有意设得极高的——回撤一度达到 54%,因为在我们这一行,利润和风险总是相伴而行。Myfxbook 的截图就是图库中的第一张图片。 看来
Ultra Indicator
Ihor Otkydach
5 (1)
ULTRA 是一項採用「一站式」運作模式的技術指標——它能獨立分析市場、產生交易訊號、顯示設定停損單的價位,並建議何時平倉以鎖定獲利或將損失降至最低。 換句話說,無論您是否懂得分析市場、判定價位(該將停損設在哪裡),或是對資金管理感到棘手,都無妨。ULTRA 會為您處理所有這些事情! 買家專屬好禮 : 購買 ULTRA 指標後,請透過私訊聯繫我,即可免費獲贈「ULTRA BOT」。這是一款特別設計的工具,能協助您根據該指標發出的訊號來管理已開倉的交易(它會為每筆交易設定停損點,並依照策略規則自動平倉,以爭取最佳交易結果)。 我還會為買家提供各種資產的預設參數,讓該指標能發揮最大效能。請透過私訊聯繫我,免費獲得這些超級好處! ULTRA 策略的運作方式 ULTRA 指標會分析歷史價格數據(涵蓋約過去 4 年),並自動學習辨識波段反轉,以便在實際交易中為您創造最大利潤。 該指標的訊號絕不會重新繪製!!一切都盡可能做到真實且直觀! ULTRA 指標運用特殊的虛擬化演算法,根據歷史數據計算所有訊號的結果,並將其交易成果顯示於儀表板上。這意味著您甚至在開始交易之前,就能預先了解 ULTRA 指標
Gann Made Easy MT5
Oleg Rodin
5 (13)
Gann Made Easy   是一个专业且易于使用的外汇交易系统,它基于使用先生理论的最佳交易原则。 W.D.江恩。该指标提供准确的买入和卖出信号,包括止损和获利水平。您甚至可以使用推送通知在旅途中进行交易。 购买后请联系我,即可免费获得交易指导和超棒的额外指标! 您可能已经多次听说过江恩交易方法。通常 Gann 的理论不仅对于新手交易者而且对于那些已经有一定交易经验的人来说都是非常复杂的东西。这是因为江恩的交易方法在理论上并不那么容易应用。我花了几年时间来完善这些知识,并将最好的原则应用到我的外汇指标中。 该指标非常易于应用。您所需要的只是将其附加到您的图表并遵循简单的交易建议。该指标不断进行市场分析工作并寻找交易机会。当它检测到一个好的入口点时,它会为您提供一个箭头信号。该指标还显示止损和获利水平。 换句话说,当您像先生一样进行交易时,该指标会为您提供最佳江恩建议。江恩亲自告诉你此时此刻该做什么。但最好的部分是您不需要了解任何有关江恩交易原则的知识,因为该指标会为您完成整个市场分析工作。
SuperScalp Pro
Van Minh Nguyen
4.54 (37)
SuperScalp Pro - Professional Multi-Layer Confluence Scalping System SuperScalp Pro 是一款先进的剥头皮交易指标,在经典 Supertrend 的基础上加入了多种智能确认过滤器。它可以帮助您识别成功概率更高的 Buy/Sell 交易机会,同时显著减少虚假信号。 清晰的 Buy 和 Sell 箭头会直接显示在图表上,并实时自动计算基于 ATR 的 Stop Loss 和 Take Profit 水平。 购买后,请通过 MQL5 给我发送消息,即可免费获取 SuperScalp Pro Auto Trader EA、用户指南以及私人群组的访问权限。 下载推荐的设置文件: [Set File] 完整文档请参阅产品博客: [User Guide] 加入官方频道,获取最新更新: [Official Channel] SuperScalp Pro 如何工作? 只有当多个确认层同时满足条件时,指标才会生成信号(趋势 + 动量 + 成交量 + 波动率 + 高时间周期趋势)。 Multi-Timeframe (MTF)
Boba Analysis Suite
Trade Ready Solutions LLC
5 (2)
Boba Analysis Suite Boba Analysis Suite 是一款适用于 MetaTrader 5 的分析指标。它将市场结构、关键价格区域和整体市场背景整合到同一图表视图中。 该指标源于交易及交易教学的实践经验,旨在帮助用户建立有条理的分析流程:评估市场方向、识别重要价位,并结合多个时间周期进行分析。 结合市场背景进行分析 单个信号的意义取决于市场背景。Boba Analysis Suite 帮助用户将当前图表状况与更大范围的市场结构相结合,并根据预先制定的规则评估交易思路。 分析功能包括: **趋势与市场结构:**评估市场方向及相关结构背景。 **关键价格区域与价位:**在图表上直观标示值得进一步分析的重要区域。 **多时间周期:**整合不同时间周期的信息,评估整体市场背景。 **可视化分析流程:**直接在图表上查看分析信息。 自主做出交易决策 Boba Analysis Suite 适合希望系统分析图表并结合多个时间周期信息的交易者。 该指标用于辅助分析,不会开仓或平仓,也不能替代交易策略或风险管理。每一笔交易的决策均由用户自行做出。 使用与许可 平台:Meta
FX Power MT5 NG
Daniel Stein
5 (33)
FX Power:分析货币强度,助您做出更明智的交易决策 概述 FX Power 是一款专业工具,帮助您全面了解主要货币和黄金在任何市场条件下的真实强度。通过识别强势货币用于买入,弱势货币用于卖出, FX Power 简化了交易决策,并帮助您发现高概率的交易机会。不论您是想跟随趋势还是通过极端的 Delta 值预测反转,这款工具都能完美适应您的交易风格。别再盲目交易——用 FX Power 让您的交易更加智慧。 1. 为什么 FX Power 对交易者极具价值 实时货币和黄金强度分析 • FX Power 实时计算并显示主要货币和黄金的相对强度,助您全面了解市场动态。 • 监控领先或落后资产,轻松识别值得交易的货币对。 全面的多时间框架视图 • 跟踪短期、中期和长期时间框架的货币和黄金强度,以便将您的交易策略与市场趋势保持一致。 • 无论是快进快出的短线交易还是更长期的投资策略, FX Power 都能为您提供所需的信息。 Delta 动态分析用于趋势和反转 • 极端 Delta 值常常预示反转机会,而平缓的 Delta 变化则确认趋势延续。 • 使用 Delta 分析,轻
Azimuth Pro
Ottaviano De Cicco
5 (7)
Azimuth Pro V2:MT5合成分形结构分析与确认入场 概述 Azimuth Pro 是 Merkava Labs 推出的多层级波段结构指标。四层嵌套波段层级、锚定波段的VWAP、ABC形态识别、三时间框架结构过滤以及收盘确认入场——一个图表,一个从微观波段到宏观周期的完整工作流程。 这不是盲目的信号产品。它是一个以结构为先的工作流程,专为重视位置、背景和时机的交易者打造。 1. V2的变化 合成多时间框架引擎 高时间框架分析从零开始重建,采用与Meridian Pro相同的专有合成架构。更清晰的HTF背景、稳定的实时行为、无经典MTF同步问题。合成引擎还解锁了 固定比率时间框架级联 (x2、x3、x4、x6)——不再在经纪商的固定时间框架之间任意跳转,您可以按图表时间框架的固定倍数分析结构,在每个尺度上保持相同的分形关系。 确认入场箭头 作为稳定且可恢复的执行层而设计的收盘确认箭头。当ABC设置形成且自适应确认逻辑在收盘K线上验证方向时,箭头会写入下一根K线的开盘,并设计为在刷新、切换时间框架、重新加载指标或重启终端等正常图表生命周期事件后仍能一致恢复。 这些不是独立的买
FiboSniper Pro
Van Minh Nguyen
5 (4)
FiboSniper Pro – Multi-Filter Fibonacci System with Auto SL/TP and Control Panel FiboSniper Pro 是一款技术指标,将动态 Fibonacci Envelopes 与多个确认过滤器相结合,以生成经过筛选的 Buy 和 Sell 信号。Fibonacci 水平基于 Moving Average 和 ATR 计算,然后通过 ADX、EMA、RSI、ATR、Volume、Time 和 Candle 结构进行过滤。该指标直接在图表上显示基于 ATR 自动计算的 Stop Loss 和 Take Profit 水平,并提供交互式控制面板,以便快速调整参数。 购买后,请通过 MQL5 给我发送消息,即可免费获取 Auto Trader X,以及有关如何将该指标的交易信号自动化的说明。 用户指南和设置文件: [Click here] 完整文档请参阅产品博客: [Click here] 加入官方频道获取最新更新: [Click here] 专为偏好结构化入场和清晰风险管理的交易者设计,适用于 Gold (XAU
M1 Sniper MT5
Oleg Rodin
5 (7)
M1 SNIPER   是一款易于使用的交易指标系统。它是一个专为 M1 时间框架设计的箭头指标。该指标可以作为独立的系统在 M1 时间框架下进行剥头皮交易,也可以作为您现有交易系统的一部分使用。虽然该交易系统专为 M1 时间框架交易而设计,但它也可以用于其他时间框架。我最初设计此方法是为了交易 XAUUSD 和 BTCUSD。但我发现这种方法在其他市场交易中也同样有用。 指标信号既可以顺势交易,也可以逆势交易。我教授一种特殊的交易技巧,帮助您利用指标信号进行双向交易。该方法基于使用特殊的动态支撑位和阻力位区域。 购买后,您可以立即下载 M1 SNIPER 箭头指标。此外,我还为所有 M1 SNIPER 工具用户免费提供下方屏幕截图所示的 Apollo Dynamic SR 指标!这两个指标的组合可以帮助您更轻松、更准确地利用 M1 时间框架进行交易。 购买后请联系我,免费获取交易提示和奖励指标! 祝您交易成功!
SQN Max indicator for MT5 by ITC
Renaud Herve Francois Candel
Sqn Max Indicator Sqn Max is an exclusive indicator to trade the market with high effectiveness. The indicator is based on price action, volatility and trend. This indicator is as simple as possible but not too simple. The indicator can generate alerts to ease the trading process. You don't have to stay all day in front of your screen. The indicator can be used with any class of assets and with any time frame. It is possible to achieve better results trading our list of selected assets. We achi
Auto Optimized SpeedAngle 是一款机构级的动量向量化系统,通过持续的前瞻优化(Walk-Forward Optimization, WFO)彻底消除了曲线拟合(curve-fitting)。该指标没有采用在市场 状态转换时容易失效的静态输入参数,而是利用出样外验证(Out-of-Sample, OOS) dynamically 动态重新校准设置,从而确保显示的 信号代表真正的统计优势,而非历史巧合。 核心机构级架构 前瞻优化引擎(Walk-Forward Optimization Engine): 核心算法持续扫描数千种回溯周期(lookback)与阈值组合,严格将数据划分为样本内(in-sample)和样本外(out-of-sample)。只有当参数配置在未知数据环境中证明具备数学优越性时,系统才会对其进行 adoption。 量化目标函数(Quantitative Objective Functions): 优化引擎不一味追求绝对毛利,而是聚焦于机构级的稳定性指标。用户可针对系统质量数(SQN)、期望值(每笔交易的平均 R 倍数)或净 R 值进行优化,从而优
Apex Patterns PRO 购买指标 — 免费获取基于该指标的 Expert Advisor。 自我优化的图表形态与突破分析智能 传统的形态扫描器依赖固定输入,在市场波动和结构发生变化时通常表现不佳。 Apex Patterns PRO 旨在适应不断变化的市场条件,将结构性图表形态识别、动量过滤和统计自我优化结合到一个分析框架中。 适应性扫描引擎 自我优化形态模式 在近期历史数据中自动搜索合适的形态参数,使指标能够根据当前市场行为调整其结构检测,而不是使用静态配置。 智能突破过滤 将经典形态识别与动量、成交量和价格行为指标相结合。引擎不会同等对待每次突破,而是评估潜在的市场结构,以识别符合当前统计环境的交易设置。 主要功能 固定的、不重绘的实时信号 自我优化的形态检测参数 丰富的图表结构库(顶部/底部、头肩顶/底、三角形、楔形) 基于动量和成交量的突破过滤 基于市场结构的动态止损和止盈水平 图表信号和实时性能指标 标准的推送、电子邮件和平台提醒 专为适应不断变化的市场条件而设计,而非依赖永久固定的参数 核心理念 目标不是将静态的几何形状强加于动态的市场。 目标是让历史市场数据
Adaptive Price Action Engine 买指标,免费送EA 自适应多时间框架趋势与K线形态智能分析系统 市场环境始终在变化,不同的市场阶段中,并非所有 Price Action 形态都具有相同的参考价值。 Adaptive Price Action Engine 旨在适应不断变化的市场条件,将 趋势结构、多时间框架分析、K线形态与统计优化 整合到一个统一的分析框架中。 两种自适应模式 Dual Alpha Trend Mode(双 Alpha Trend 模式) 自动搜索适合的 Alpha Trend 参数,并结合低周期与高周期市场结构,使指标能够根据近期市场行为动态调整趋势识别。 Candlestick + Alpha Mode(K线 + Alpha 模式) 将 Alpha Trend 市场状态与 22种多空K线形态 相结合。系统不会简单地对所有形态一视同仁,而是对不同的形态组合进行统计评估,并识别在特定市场环境下表现出更强历史统计特征的配置。 主要功能 趋势参数自动优化 多时间框架市场状态分析 22种多头与空头 Price Action K线形态 对数千种可能
下一次更新 — 版本 2.52 即将推出![全新功能] 准备迎接 4 项重大新功能,全面提升您的市场分析能力与交易流程! 我们将通过 4 项全新功能,进一步提升市场分析水平,满足您的交易需求。现为您介绍: 1. TRADE OVERVIEW DASHBOARD 2. CONFLUENCE AT ZONE 3. STRONG & WEAK HIGH/LOW 4. OTE 1. TRADE OVERVIEW DASHBOARD 一个帮助您更轻松地了解整体市场状况的仪表盘,为您的交易决策提供参考指引,帮助您系统地分析市场并规划交易,所有信息尽在一个屏幕中。 多时间周期市场概览(Multi-Timeframe Market Overview) 更清晰地了解市场方向与价格结构 快速查看市场状况 为系统化市场分析和入场规划提供指引。 2. CONFLUENCE AT ZONE 当价格进入关键区域时……您将了解有多少项支持因素相互吻合。 关键区域是交易决策至关重要的地方。但仅仅是价格进入某个区域还不够。此功能可帮助您在入场交易前,识别相互吻合的因素,包括信号及其他相关因素,从而进行更全面的分析,并
Divergence Bomber
Ihor Otkydach
4.89 (94)
购买该指标的每位用户将额外免费获得以下内容: 原创工具“Bomber Utility”,该工具会自动跟踪每一笔交易,设置止损和止盈点,并根据策略规则自动平仓; 适用于不同交易品种的指标设置文件(Set 文件); 三种不同风险模式下的 Bomber Utility 设置文件:“最低风险”、“平衡风险” 和 “观望策略”; 一套详细的 视频操作手册,帮助您快速完成安装、配置并开始使用本交易系统。 注意: 要获取以上所有赠品,请通过 MQL5 的私人消息系统联系卖家。 我为您介绍原创的自定义指标 “Divergence Bomber”(背离轰炸机),它是一套基于 MACD 背离交易策略 的“全功能”交易系统。 该技术指标的主要任务是识别 价格与 MACD 指标之间的背离,并发出交易信号(包括推送通知),指示未来价格可能的运动方向。平均而言,这些信号的准确率超过 98%。有关该指标如何工作的详细说明,请观看本页面上的视频演示。 该系统使用 止损订单 和 动态回撤平仓机制 来管理交易。 Divergence Bomber 指标的主要特点: 支持交易的品种: AUDCAD、AUDCHF、AUDS
Power Candles MT5
Daniel Stein
4.58 (12)
Power Candles V3 - 自我优化的强度指标 Power Candles V3 把货币与品种的强度直接转化为图表上可执行的交易方案。指标不再仅根据强度给K线着色,而是在后台持续运行实时自动优化,为您正面对的品种给出最佳 Stop Loss、Take Profit 与信号阈值。一键采用,Entry、Stop Loss、Take Profit 线就以精确价格绘制在图表上,提醒消息中直接包含方向。 本工具是 Stein Investments 生态系统的一部分 - 18+ 款工具,加上 Max,您的一对一 AI 交易导师。  随时在线,深入了解每一款指标,在您需要梳理思路的那一刻就在那里。  立即认识他: https://stein.investments 每根收盘K线运行 3,000+ 次交易模拟。9 种强度状态。2 种策略并行测试。一键采用最优配置。 为什么需要这个 大多数强度指标只给您一个数值,然后留下三个问题:相信哪个阈值、用哪个 Stop Loss、走哪个交易方向。Power Candles V3 在每根收盘K线上自动回答这些问题。结果就是一个完整的交易方案 -
货币强度向导是一个非常强大的指标,为您提供成功交易的一体化解决方案。该指标使用多个时间范围内所有货币的数据来计算这个或那个外汇对的力量。此数据以易于使用的货币指数和货币电力线的形式表示,您可以使用它们来查看这种或那种货币的力量。 您所需要的只是将指标附加到您要交易的图表上,该指标将向您显示您交易的货币的真实强度。该指标还向您显示买卖量压力的极值,您可以在顺势交易时利用这些压力。该指标还显示了基于斐波那契的可能目标。该指标可用于各种交易时间范围。该指标支持各种货币对的交易。   该指标为您提供所有类型的警报,包括推送通知。 购买后请联系我。我将与您分享我的交易技巧,并免费为您提供丰厚的红利指标! 祝您交易愉快,获利丰厚!
Naked Forex Tweezer Pro Indicator Tweezer Pro Indicator is a pattern recognition indicator for Forex, Stocks, Indices, Futures, Commodities and Cryptos. The standard Tweezer is a two bar pattern. Our enhanced version is a multi-bar pattern. We filter the patterns for you so that you only get the     best and most effective patterns   and ignore the noise. The Tweezer pattern is a simple and effective pattern to trade. The strategy that comes with the Tweezer is based on price action. The Twe
FX Levels Premium indicator for MT5
Renaud Herve Francois Candel
Fx Levels Premium Indicator Support and Resistance are important concepts in trading. Fx Levels Premium was created to easily draw important levels of support and resistance for the active trader. The indicator will give you all important levels (support/resistance) to watch for a wide range of assets. Trading without these levels on your chart is like driving a car for a long journey without a roadmap. You would be confused and blind. Support and resistance levels should be used as guideline
ARICoins
Temirlan Kdyrkhan
ARICoin is a powerful trading companion designed to generate high-probability entry signals with dynamic TP/SL/DP levels based on volatility. Built-in performance tracking shows win/loss stats, PP1/PP2 hits, and success rates all updated live. Key Features: Buy/Sell signals with adaptive volatility bands Real-time TP/SL/DP levels based on ATR Built-in MA Filter with optional ATR/StdDev volatility Performance stats panel (Success, Profit/Loss, PP1/PP2) Alerts via popup, sound, push, or email Cust
Crystal Heikin Ashi Signals
Muhammad Jawad Shabir
5 (5)
Crystal Heikin Ashi Signals—Professional Trend & Signal Detection Indicator Advanced Heikin Ashi Visualization with Intelligent Signal System for Manual & Automated Trading Final Price: $149 ---------> Price goes up $10 after every 10 sales . Limited slots available — act fast . Overview User Guide PDF Crystal Heikin Ashi Signals is a professional-grade MetaTrader 5 indicator that combines pure Heikin Ashi candle visualization with an advanced momentum-shift detection system. Designed for both m
FX Trend MT5 NG
Daniel Stein
5 (6)
FX Trend NG:新一代多市场趋势智能分析工具 概述 FX Trend NG 是一款专业的多时间周期趋势分析与市场监控工具,帮助您在几秒钟内全面了解市场结构。 无需在多个图表之间来回切换,您可以立即看到哪些品种处于趋势中、哪里动能正在减弱,以及哪些时间周期之间存在强烈共振。 限时发布优惠 – 仅需 $30(6个月) 或 $80 终身授权 即可拥有 FX Trend NG 。 已经是 Stein Investments 客户? -> 发送消息 以获取专属客户群访问权限。 需要帮助或安装指导? -> 请访问 Stein Investments 官方页面 。 1. FX Trend NG 的核心优势 三状态趋势逻辑 —— 不只是 Buy 或 Sell • 大多数指标仅显示两种状态:Buy 或 Sell。 • FX Trend NG 增加第三种状态: Fade 。 • Fade 表示趋势强度正在减弱,在完全反转之前提前发出信号。 这种结构化逻辑让您看到趋势变化过程,而不仅仅是简单方向信号。 多时间周期分析(M1 至 MN1) • 从短线交易到中长线交易全面覆盖。 • 快速识别趋势
PZ Swing Trading MT5
PZ TRADING SLU
5 (5)
Swing Trading 是第一个旨在检测趋势方向的波动和可能的反转波动的指标。它使用在交易文献中广泛描述的基准摆动交易方法。该指标研究多个价格和时间向量,以追踪总体趋势方向,并检测市场超卖或超买并准备好进行修正的情况。 [ 安装指南 | 更新指南 | 故障排除 | 常见问题 | 所有产品 ] 市场波动的利润不会被窃取 指示器始终显示趋势方向 彩色价格带代表机会基准 彩色虚线表示可能的反转波动 该指标分析其自身的质量和性能 它实现了一个多时间仪表板 可定制的趋势和波动周期 它实现了电子邮件/声音/推送警报 指示器为非重涂或重涂 什么是摇摆交易 摇摆交易是一种尝试在一天到一周内从证券中获得收益的交易方式,尽管某些交易最终可以保持更长的寿命。摇摆交易者使用技术分析来买入弱点和卖出力量,并有耐心等待这些机会的发生,因为在发生一波抛售浪潮之后购买证券而不是陷入抛售更有意义。 机会基准 关于历史数据的大量研究证明,适合于波动交易的市场倾向于在基线价格带上下交易,基线价格带由图表显示,使用平均真实区间计算得出。波动交易者使用基线,该策略是购买常态和卖出躁狂,或做空常态并掩盖沮丧。在没有疲
FX Volume MT5
Daniel Stein
4.79 (24)
FX Volume:从经纪商视角洞察真实市场情绪 简要概述 想要提升您的交易策略? FX Volume 可提供零售交易者和经纪商的持仓实时数据——远早于诸如 COT 之类的延迟报告。不论您希望获得持续稳定的收益,还是想在市场中多一分制胜的砝码, FX Volume 都能帮您识别重大失衡、确认突破以及完善风险管理。立即开启体验,让真实的成交量数据为您的交易决策带来革新! 1. 为什么 FX Volume 对交易者格外有用 极具准确度的早期预警 • 快速捕捉有多少交易者正在买入或卖出某个货币对——比大多数人提前一步。 • FX Volume 是 唯一 能够整合多家零售经纪商真实成交量数据并以简洁方式呈现的工具。 强力风险管理 • 及时识别多头或空头仓位的巨大不平衡,这往往预示着潜在的趋势反转,帮助您更自信地设置止损和目标位。 • 独家而真实的数据让每一次交易决策更具可靠性。 优化进场与出场点 • 发现“过度集中”的交易(大多数交易者都在同一方向),并通过真实成交量来确认突破。 • 避免依赖常见指标可能带来的误导信号,而是利用真实的实时成交量。 适配各种交易策略 • 将 FX
Apollo SR Master 是一款支撑/阻力指标,其特殊功能使利用支撑/阻力区域进行交易更加便捷可靠。该指标通过检测局部价格顶部和底部,实时计算支撑/阻力区域,没有任何时间延迟。为了确认新形成的支撑/阻力区域,该指标会显示特殊信号,表明该支撑/阻力区域可以作为实际的卖出或买入信号。在这种情况下,支撑/阻力区域的强度会增强,因此从该区域进行交易的成功率也会更高。这正是该指标的核心理念。 SR区域也使止损和止盈的操作更加便捷。根据信号方向,可以将SR区域上方或下方的空间用作止损位。此外,相对的SR区域也可以用作潜在的止盈区域。 我还免费向所有 Apollo SR Master 指标的用户提供我的“Apollo 价格行为系统”指标。这两个指标结合使用将帮助您找到更好的入场点。 购买后请联系我,即可免费获得交易指导和超棒的额外指标!
Astral Volume
Ottaviano De Cicco
Astral Volume 从更广的背景解读成交量加权动量。 首发特惠 — $78 · 立省35% · 首发优惠后为$120。 当前周期的强劲走势,在更高周期中可能呈现不同面貌。对于结合价格与成交量进行分析的交易者,Astral Volume 将当前读数与更广的周期背景汇集在一起,供您在评估方向变化前查看。 结合背景判断走势。 观察基于 tick 量加权的动量,并将其强度与近期历史进行比较。 识别一致与分歧。 在当前读数旁查看两个更高周期,无需在脑中拼接多个独立图表。 设定一致的确认规则。 选择哪些周期必须方向一致,才接受方向变化信号。 当您的方法需要结合动量、相对强度和周期一致性时,可使用 Volume。它采用经纪商的 tick 量,并非集中市场的实际成交量或已成交订单流。 结合背景解读市场 Volume: 当前图表周期。柱状图显示振荡器,曲线提供平滑参考,整个窗口的背景跟随当前方向状态。 Context: 选定的第一个更高周期,显示在指标窗口底部两条色带中的上方色带。 Macro: 所选的第二个更高周期,显示在下条色带。两条色带高度相同。 紧凑面板标识各周期及其看涨、看跌或中性状态
DayTrader PRO
Davit Beridze
5 (4)
DayTrader PRO DayTrader PRO 是一款先进的交易指标,它结合了约翰·埃勒斯 (John Ehlers) 的 Laguerre 滤波器与强大的自动优化引擎。该指标不依赖固定的参数,而是根据最新的市场状况自动搜寻最佳设置,帮助您在无需手动调整的情况下适应不断变化的市场波动。 该指标可生成清晰的买入 (BUY) 和卖出 (SELL) 信号,并提供根据当前市场波动率计算得出的自适应止损 (Stop Loss) 和止盈 (Take Profit) 水平。内置的趋势、效率系数 (Efficiency Ratio)、波动率和蜡烛图过滤功能,有助于剔除低质量的交易设置,从而提高信号的准确性。 实时性能面板会显示当前已优化的设置、利润因子 (Profit Factor)、胜率 (Win Rate)、回撤 (Drawdown) 以及其他交易统计数据。DayTrader PRO 还支持弹出窗口、推送、邮件和声音提醒,确保您不会错过任何交易机会。 主要功能 全自动参数优化 自适应买入与卖出信号 基于 ATR 的动态止损与止盈 支持每日、每周或每月重新优化 内置趋势与市场过滤功能 性能统
Neuro Poseidon MT5
Daria Rezueva
4.68 (53)
Neuro Poseidon is a new indicator by Daria Rezueva. It combines precise trading signals with adaptive TP/SL levels - creating best possible trades as a result! Message me and get  Neuro Poseidon Assistant  as a gift to automize your trading process! What makes it stand out? 1. Proven profitability on all assets and timeframes 2. Only confirmed BUY and SELL signals present on the chart 3. Adaptive TP & SL levels generated by the software for each trade 4. Easy to understand - suitable for al
作者的更多信息
XP Sessions
Ahmed Soliman
3.5 (2)
The indicator is getting the four most important trading sessions: New York London Sydney Tokyo The indicator auto calculate the GMT time. The indicator has buffers that can be used to get the current session and the GMT. You can use it as stand alone indicator and you can turn the draw off and call it from your EA. INPUTS Max Day: Max days back to get/draw. London Session On: Show/Hide London Session. New York Session On: Show/Hide New York Session.  Sydney Session On: Show/Hide  Sydney Session
FREE
The UNIVERSAL DASHBOARD indicator will eliminate the need of using dozens of indicators on dozens of charts. From one place you can monitor all the pairs and all the timeframes for each of the following indicators: MACD STOCHASTIC WPR RSI CCI You can also use any Custom indicator in the dashboard as long as it has a readable buffer. With a single click you can quickly navigate between charts, pairs and timeframes. Alerts will provide clear indication about what happens for your favorite pairs on
FREE
The indicator is getting the four most important trading sessions: New York London Sydney Tokyo The indicator auto calculate the GMT time. The indicator has buffers that can be used to get the current session and the GMT. You can use it as stand alone indicator and you can turn the draw off and call it from your EA. INPUTS Max Day: Max days back to get/draw. London Session On: Show/Hide London Session. New York Session On: Show/Hide New York Session.  Sydney Session On: Show/Hide  Sydney Session
FREE
XP Moving Average
Ahmed Soliman
5 (1)
XP Moving Average – Your All-in-One Trading Powerhouse Master the markets with XP Moving Average , the ultimate moving average indicator for MetaTrader 4. Whether you’re scalping , swing trading , or investing long-term , this versatile tool combines 9 advanced moving averages in one—enhanced with a modern graphical dashboard and real-time alerts . With AI-powered insights coming soon , XP Moving Average is your key to smarter, more profitable trades . Why Choose XP Moving Average? 9-in-1
The Stochastic Dashboard is multi currencies and multi timeframes dashboards. It shows the Stochastic direction for the chosen pairs/timeframes. For the Stochastic lovers and manual trader this indicator is a most indicator which can be used to determine the market direction for the pair(s) you are trading. Set it to one chart only and monitor from one place all the charts you want.
Speed Meter
Ahmed Soliman
XP Speed Meter MT4: Measure True Market Momentum Description The XP Speed Meter MT4 is a unique and powerful custom indicator designed to reveal the true speed and momentum of price movement. Unlike standard indicators that rely on chart-bar closing prices, the Speed Meter dynamically calculates the volume of bullish and bearish ticks, and the resulting price movement, over a specific, user-defined time period. This innovative approach allows you to cut through the noise of standard timef
The UNIVERSAL DASHBOARD indicator will eliminate the need of using dozens of indicators on dozens of charts. From one place you can monitor all the pairs and all the timeframes for each of the following indicators: MACD STOCHASTIC WPR RSI CCI You can also use any Custom indicator in the dashboard as long as it has a readable buffer. With a single click you can quickly navigate between charts, pairs and timeframes. Alerts will provide clear indication about what happens for your favorite pairs on
FVG - Fair Value Gap The FVG - Fair Value Gap is an advanced MQL4 indicator designed for traders who utilize institutional order flow and Smart Money Concepts to identify market inefficiencies. This indicator automatically detects and highlights Fair Value Gaps (FVGs) on your chart, providing a clear visual representation of potential support and resistance zones, reversal points, and high-probability trading setups. Key Features: Automated FVG Detection: The indicator automatically identifies
Simplify Your Trading with the MACD Dashboard Are you tired of juggling multiple MetaTrader charts to monitor MACD across different timeframes and symbols? The MACD Dashboard is the solution you've been waiting for. This innovative MetaTrader indicator provides a centralized view of MACD signals on multiple charts, making it easier than ever to identify trading opportunities and manage your risk. Key Features: Multi-Timeframe Monitoring: Track MACD signals on multiple timeframes simultaneousl
Engulfing Zones: Your Edge in Price Action Trading Description The Engulfing Zones indicator is a sophisticated, non-repainting tool designed to automatically detect, highlight, and track the most significant Engulfing Candle Patterns (EG) and, crucially, Engulfing Failures (EF) on your chart. Developed by Coders Guru (XPWORX), this indicator goes beyond simple pattern recognition by drawing persistent, dynamic support and resistance zones based on these high-probability candlestick events
XP Moving Average MT5 – Your All-in-One Trading Powerhouse Master the markets with XP Moving Average MT5 , the ultimate moving average indicator for MetaTrader 5. Whether you’re scalping , swing trading , or investing long-term , this versatile tool combines 9 advanced moving averages in one—enhanced with a modern graphical dashboard and real-time alerts . With AI-powered insights coming soon , XP Moving Average is your key to smarter, more profitable trades . Why Choose XP Moving Average?
FVG - Fair Value Gap The FVG - Fair Value Gap is an advanced MQL5 indicator designed for traders who utilize institutional order flow and Smart Money Concepts to identify market inefficiencies. This indicator automatically detects and highlights Fair Value Gaps (FVGs) on your chart, providing a clear visual representation of potential support and resistance zones, reversal points, and high-probability trading setups. Key Features: Automated FVG Detection:   The indicator automatically identifie
Engulfing Zones MT5: Your Edge in Price Action Trading Description The   Engulfing Zones MT5   indicator is a sophisticated, non-repainting tool designed to automatically detect, highlight, and track the most significant   Engulfing Candle Patterns (EG)   and, crucially,   Engulfing Failures (EF)   on your chart. Developed by Coders Guru (XPWORX), this indicator goes beyond simple pattern recognition by drawing persistent, dynamic   support and resistance zones   based on these high-probab
XP Trade Panel is a trade manager for MetaTrader 5. It sizes, places and manages trades from one panel on the chart. Plan the trade on the chart The risk-reward tool draws the target, the entry and the stop on the chart before you place the order. Each strip shows its distance in points, the amount in the account currency, the percent of balance, and the reward-to-risk ratio. Drag a strip to move it. Click the arrows on the entry strip to switch between buy and sell. Drag the entry away from the
筛选:
无评论
回复评论