Speed Meter MT5
- インディケータ
- バージョン: 1.1
- アップデート済み: 17 6月 2023
- アクティベーション: 10

🚀 XP Speed Meter MT5: Measure True Market Momentum 📈
Description
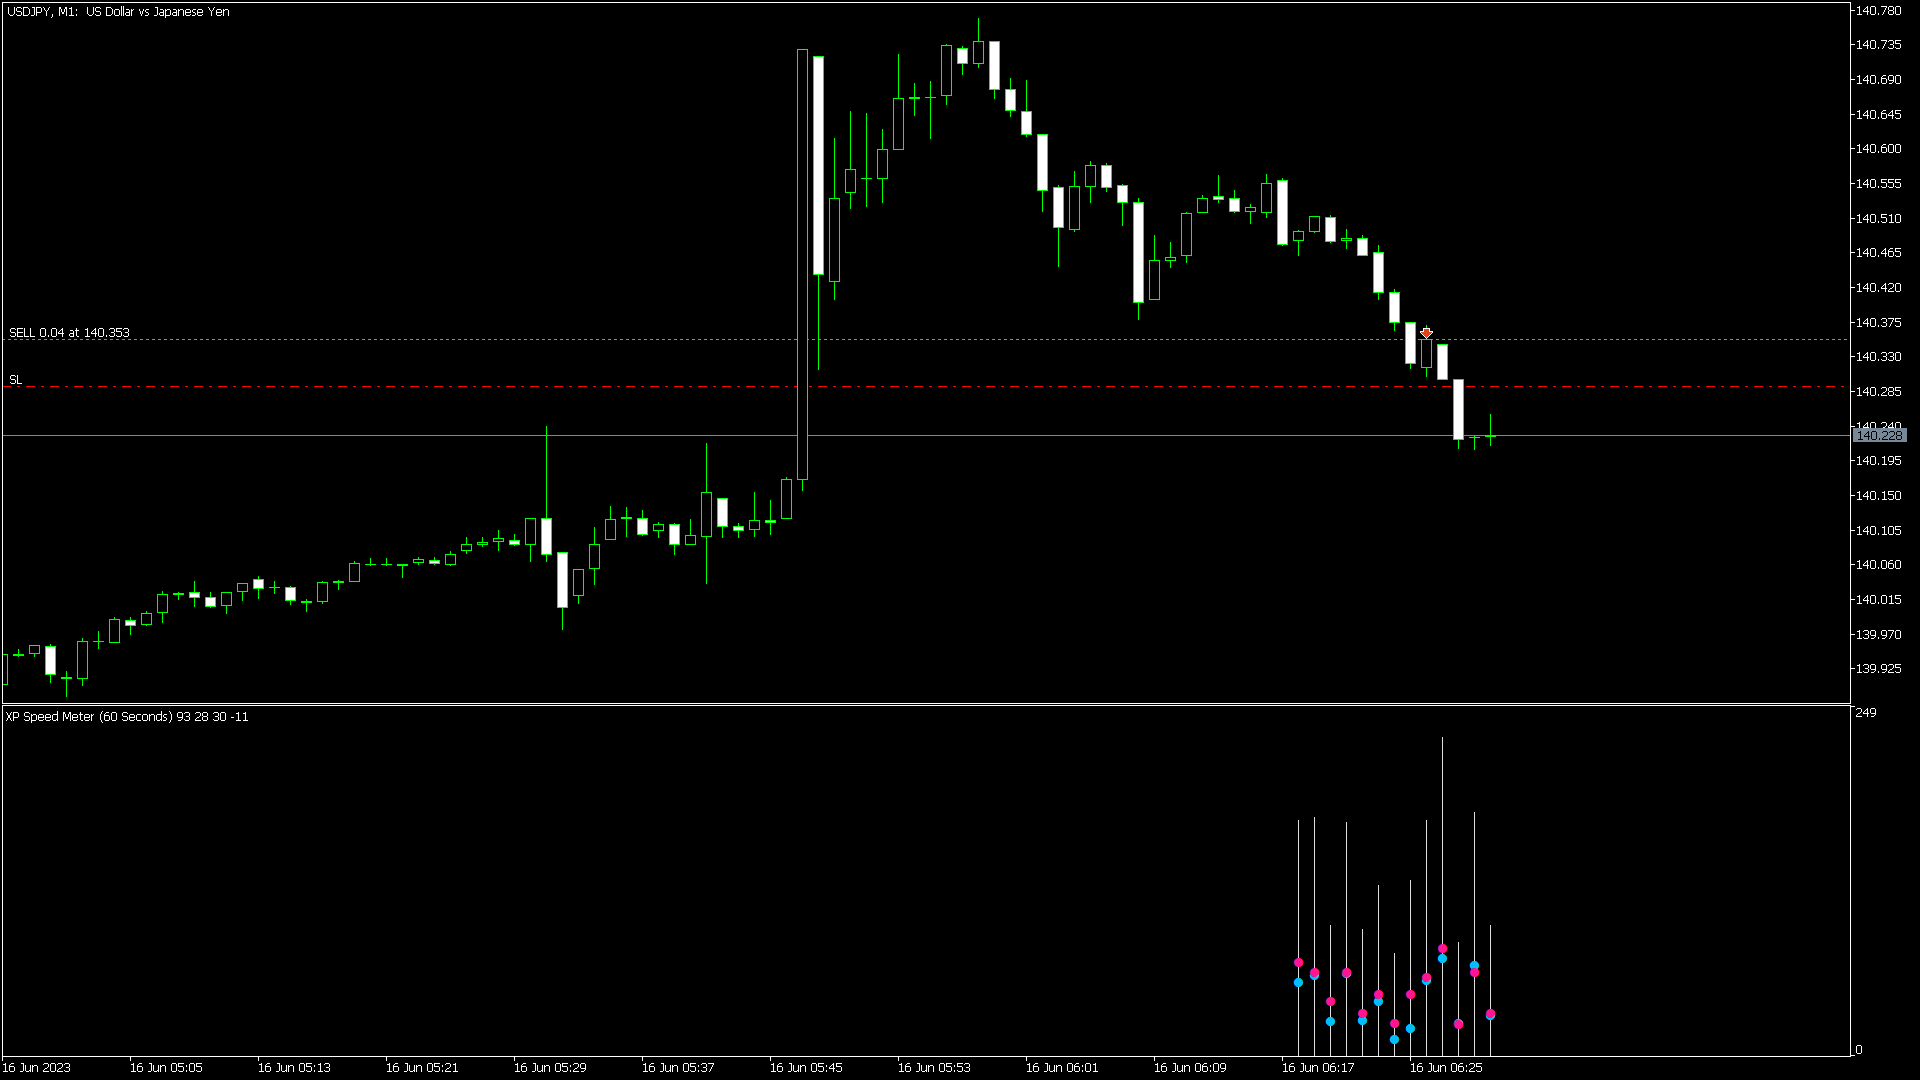
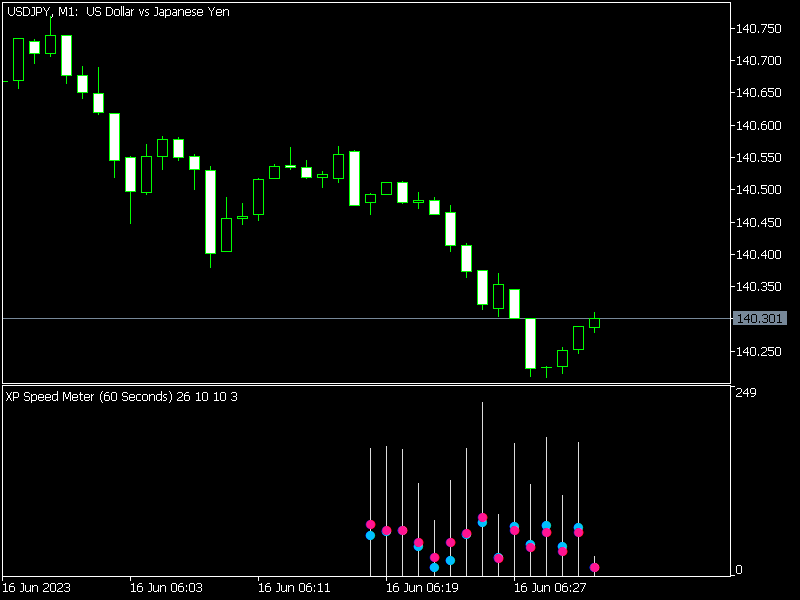
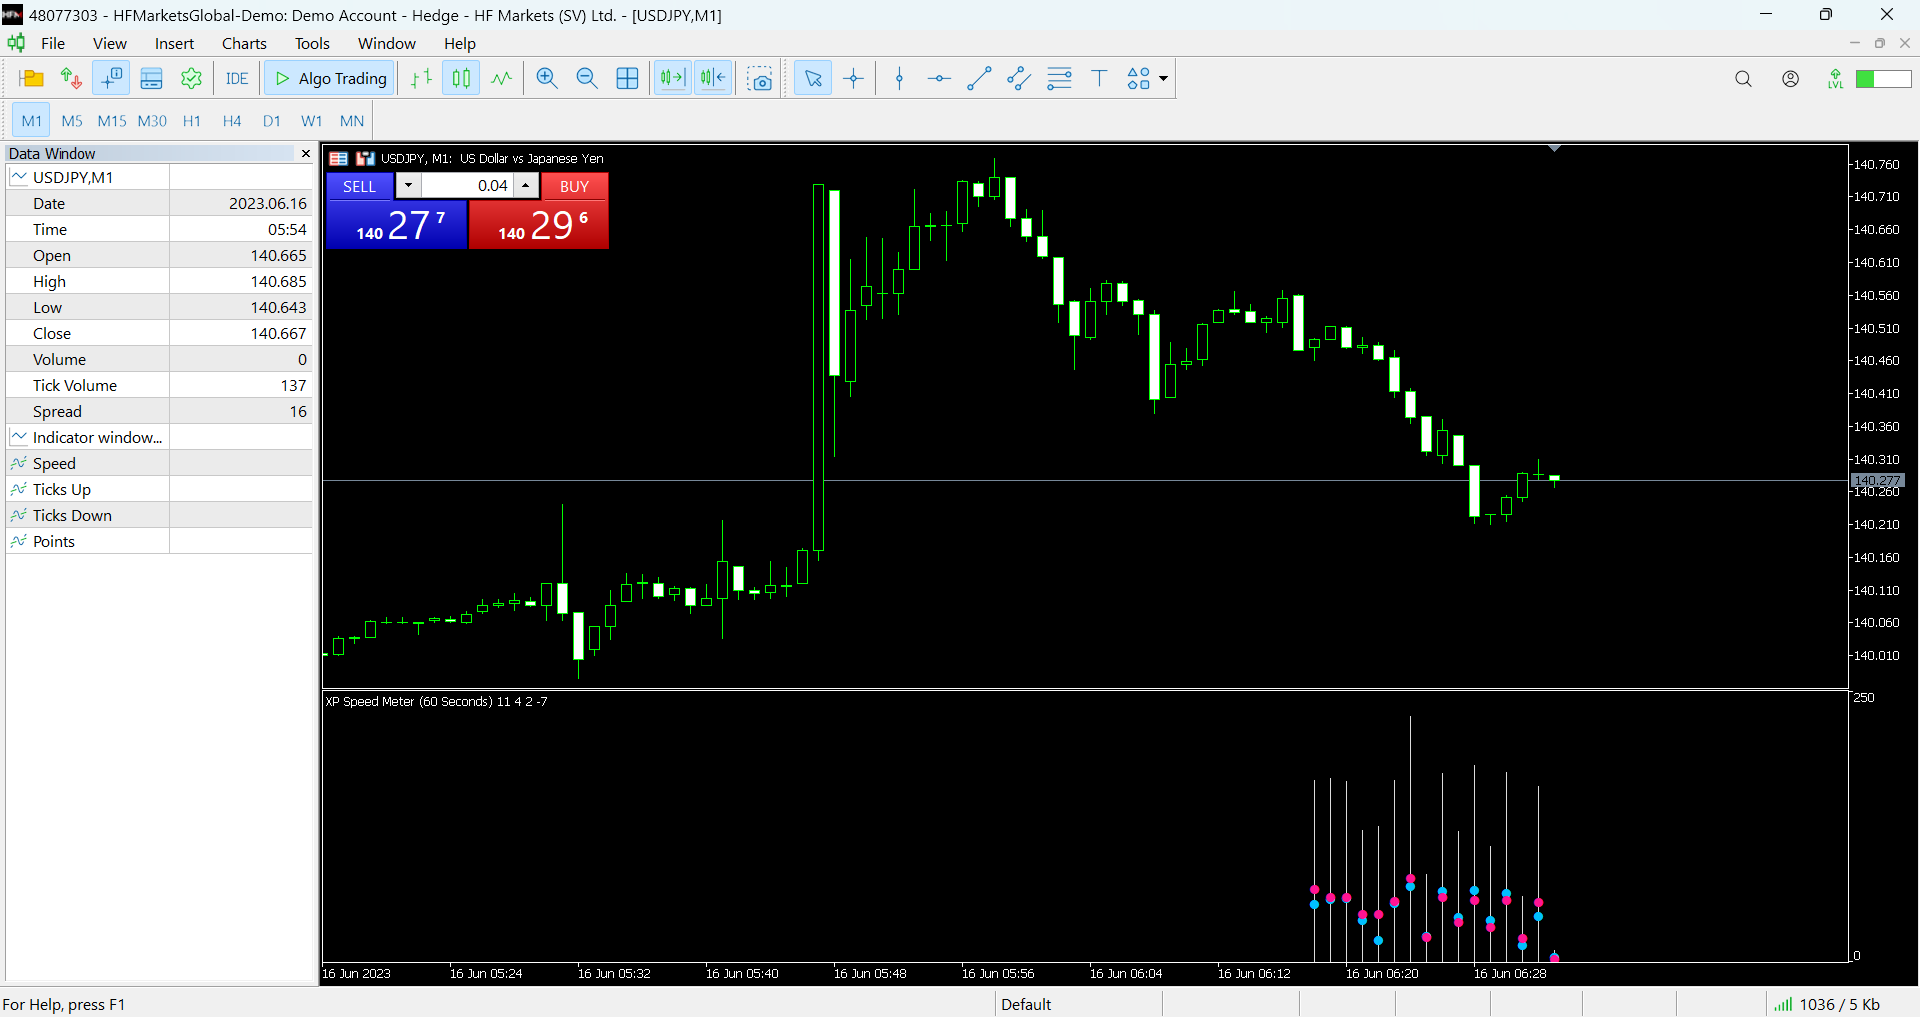
The XP Speed Meter MT5 is a unique and powerful custom indicator designed to reveal the true speed and momentum of price movement. Unlike standard indicators that rely on chart-bar closing prices, the Speed Meter dynamically calculates the volume of bullish and bearish ticks, and the resulting price movement, over a specific, user-defined time period.
This innovative approach allows you to cut through the noise of standard timeframes (like M5, H1, etc.) and focus on the raw velocity of the market, giving you a critical edge in identifying explosive moves before they happen.
Key Features & Trading Benefits
Custom Time-Based Volatility
-
Define Your Own Bar: Set the indicator to measure speed over a specific period in Seconds, Minutes, or Hours .
-
Raw Momentum Display: The indicator plots a histogram (Speed buffer ) that represents the velocity of price movement within your custom period.
-
Tick Analysis: Tracks the total number of Ticks Up and Ticks Down within the measurement period, providing a clear view of micro-momentum shifts.
Actionable Momentum Alerts
-
Points-Based Alert System: Calculate the total price movement (Points ) within the custom period.
-
Explosive Move Notifications: Instantly receive alerts when the measured price movement (in points) exceeds a customizable threshold (Alert Points ), signaling a significant breakout or surge in momentum.
-
Directional Alerts: Alerts clearly distinguish between strong Buy momentum (+AlertPoints) and strong Sell momentum (−AlertPoints) .
Comprehensive Alert Options
Never miss a high-speed opportunity with multi-channel alerts:
-
Pop-up Alerts (Visual on platform)
-
Mobile Notifications (Push to your MQL5 app)
-
Email Notifications (For monitoring away from the screen)
Clean & Customizable Display
-
Separate Window: Runs in its own sub-window, keeping your main chart clean .
-
Control History: Set the Max Bars to limit the indicator's calculation and display history.
-
Bar Synchronization: Option to Wait New Bar to ensure calculations align with the main chart's new bar opening.
Perfect For
-
Breakout Traders: Identify the exact moment momentum surges to confirm a breakout.
-
Scalpers and Day Traders: Pinpoint high-velocity moves that lead to quick profits.
-
Volatility-Focused Traders: Gauge market acceleration and deceleration with unprecedented precision.
Technical Details
-
Platform: MetaTrader 5 (MT5)
-
Version: 1.1
-
Developer: Coders Guru (XPWORX.COM)
-
Indicator Name: XP Speed Meter
⚡ Gain an unfair advantage by trading with speed! Get the XP Speed Meter MT4 and quantify true market momentum!