 MetaTrader 5
 专家
专家
 指标
指标
 程序库
程序库
 实用工具
实用工具
 窗口小部件
窗口小部件
 规则
规则
适用于MetaTrader 5的免费EA交易和指标 - 90
 使用EA交易和指标,使外汇交易获得更多盈利。EA交易可使您自动开启和关闭交易,而指标将帮助您更准确地预测市场行为。
该页面提供MetaTrader 5应用程序的目录。
使用EA交易和指标,使外汇交易获得更多盈利。EA交易可使您自动开启和关闭交易,而指标将帮助您更准确地预测市场行为。
该页面提供MetaTrader 5应用程序的目录。 
Ultimate Multi-Timeframe Pattern Scanner Dashboard is a high-performance, advanced technical tool designed to automatically scan and identify 14 of the most powerful candlestick patterns simultaneously across multiple currency pairs and timeframes. Built with a highly optimized, timer-driven architecture, this dashboard updates seamlessly without causing platform lag or freezing, making it the perfect scanner for active traders who want to monitor the entire market from a single chart. ️ IMPORT
FREE
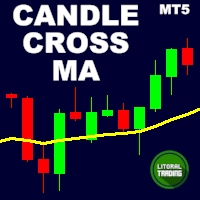
Candle cross MA is an indicator that works "silently", that is, drawing only a moving average on the chart.
It alerts you when the last candle cross with a moving average that you set. Alert is given only when the candle closes.
The moving average settings are fully customizable.
The indicator sends popup, and push notifications. You can also deactivate alerts when the chart is inactive. Are you the trend type? Do not miss another opportunity!
FREE
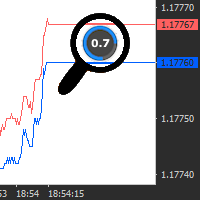
A simple and useful Current Price Panel, which displays magnified current Bid, Ask prices and spread, movable anywhere on chart window using the mouse. Also provides an option to have as text at a static location showing bid or ask price along with spread, shown at any location on the chart. Allows display as pips or points along with spread highlighted in distinct color if it crosses the threshold point for the previous 100 ticks. Includes an option to show or hide the last digit (pipette) of t
FREE
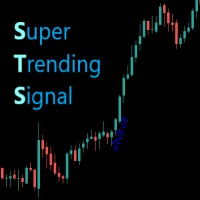
O indicador Supertrendingsignal imprime um sinal na tela indicando início de uma forte tendência. O sinal não mostra o ponto de entrada com melhor risco retorno, apenas faz a indicação de uma forte tendência. Foi idealizado a partir de um conjunto de médias móveis e volume. Parametros: Periodmalongo: Períodos da média longa Periodmamedio: Períodos da segunda media Periodmamedio2: Perídos da terceira media Periodmacurto: Períodos da média curta. PeriodATR: Períodos do indicador ATR para adequar
FREE

Zigzag Indicator For RSI, To easily identify the highs and lows of the rsi signal. It is easier to observe divergent and convergent signals. Default setting: InpRsi =14 //Rsi Period InpDepth =12; // Depth InpDeviation =5; // Deviation InpBackstep =3; // Back Step
If you want open Exness account try this link : https://one.exness-track.com/a/teg5teg5 Dev buy taphu: Ha Van Tan - hatatrata - Trader's profile - MQL5 community Email: tan.ha@outlook.com
FREE
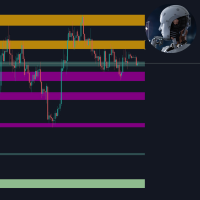
This tool is useful for indicating resistance and support levels It bases on zone in setting to identify top/bottom of candles and and draw rectangle according to those resistance/support level Beside user can edit the zone via dialog on specific timeframe and that value will be saved and loaded automatically. User can determine what strong resistance and support and make the order reasonably.
FREE
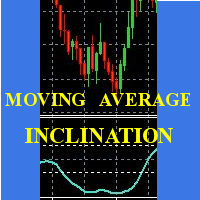
Scalp using the behavior of a short moving average, the indicator gives the slope and identifies the "hyper" moments.
Operational advice:
Use M1 chart. Period 20 : open buy after two rising lows; sell after two max downhill; avoid countertrend openings; when the line goes flat put a stop at the opening price. Avoid actions in low volatility timeslots. When the curve that draws the min / max is very flat, it is better to postpone at least 15'.
Period 50 : matches the trend, when it is at
FREE

Matsukaze Prop Shield 是一款专为自营交易公司交易员打造的回撤保护和分析工具。无论您正在参加FTMO挑战赛、管理资金账户,还是进行任何自营公司评估,此工具都能实时监控您的账户,防止突破每日和总回撤限制,并提供完整的分析套件来审查您的交易表现——所有功能集成在图表上的一个面板中。
经FTMO挑战赛实盘账户验证($50,000 两步挑战)。所有回撤数值、剩余金额和统计数据与FTMO仪表板完全一致。适用于任何自营公司资金账户或个人交易账户。
功能介绍
Prop Shield与您的交易(手动或EA)同步运行,监控账户权益。当回撤接近限制时,信号灯变黄,然后变红。如果突破限制,所有仓位将自动平仓,新交易将被阻止一段可配置的冷却时间。
除了保护功能外,Prop Shield还包含完整的分析面板和日历热力图,这些通常只能在自营公司网站上查看。现在您可以直接在MT4/MT5图表上查看所有内容,无需切换标签页。
Shield标签 — 回撤保护
- 每日和总回撤监控,显示百分比和剩余美元金额 - 信号灯系统(绿、黄、红)即时视觉状态 - FTMO预设:选择FTMO即可
FREE

执行买/卖订单时,TradeSnap 会自动捕获并保存屏幕。
只需将其设置在图表上,它就会自动保存,无需任何额外工作。
图表上的线条、箭头等也会按图像中的原样保存。
图像大小可以是 10000x10000 像素,因此您可以保存显示价格变动历史的水平图像。
参数信息
--事件参数--
Magic number (0=ALL):如果您有任何 EA,请设置 Mugic Number。
entry: true:打开执行时捕获。
exit: true:关闭执行时捕获。
--捕获信息--
图像宽度、图像高度:图像大小 x/y,以像素为单位。 最大值:10000px
--留言信息--
文本颜色、文本大小、文本位置、显示秒数:如果您想更改消息显示,请更改设置。
图像过滤器:deta filder/MQL5/Files/OshiraseSnap/
无:如有必要,请删除旧图像。
感谢您对本产品的关注。 如果您对我们的产品感到满意,我们将非常高兴。 如果不是,请联系我们寻找解决方案。 此外,如果您需要其他功能,请随时告诉我们。
FREE

MTForge SuperTrend — Adaptive Trend Following for MT5 A professional-grade SuperTrend indicator built for serious traders. Unlike basic SuperTrend tools, MTForge SuperTrend gives you two trend detection modes and six moving average types, letting you fine-tune the indicator to match any market condition. What It Does The indicator plots a single colored line on your chart that flips between support (green) and resistance (red). When price is trending up, the line sits below price as dynamic supp
FREE

Pulse Trade Dashboard is an interactive trade management panel for MetaTrader 5, built for traders who want full control of their account without leaving the chart. Attach it to any chart and get a real-time overview of your balance, equity, open positions, and floating P&L — all updating live. Place market orders instantly with the one-click BUY and SELL buttons, adjusting your lot size, stop loss, and take profit directly on the dashboard without opening a single settings menu. What's included
FREE

Optimize your trading management with Breakeven Bot, the essential tool for active traders managing multiple positions at once. No more wasting time manually adjusting your stops—one click is all it takes to secure your profits! Main Feature:
️ "BREAKEVEN" Button – Instantly set all profitable positions to breakeven and protect your gains quickly. ️ Customization Options:
Set breakeven in pips or currency, depending on your preference.
Choose whether breakeven should be at the entr
FREE

The Trend Strength Meter Core is a powerful on-chart dashboard designed to give you an instant, clear reading of the current market momentum . By combining the data from Moving Averages, RSI, and MACD, it calculates a highly accurate Trend Score (0 to 100), ensuring you always trade on the right side of the market . Key Features Advanced Confluence Algorithm: Calculates a dynamic score by analyzing price position relative to MA, RSI overbought/oversold zones, and MACD signal crossovers . Enhanc
FREE

KS Triple EMA —— 简介与功能
概览
KS Triple EMA 是一款界面简洁、高度可定制的“三重移动平均线”指标,专为 MetaTrader 5 平台设计。它可在主图表上绘制多达三条独立的移动平均线(分为快线、中线和慢线),并辅以专业的视觉呈现效果及动态标签显示。
尽管该指标的文件名显示为“Tripple”,但在程序内部,其正式名称实为 KS ThreeMA 或 KS 3MA。 核心功能
功能 | 描述
---|---
三条独立移动平均线 (MA) | 包含快线、中线和慢线,每条线均拥有完全独立的设置。
全面自定义 | 每条 MA 线均可独立设置周期、计算方法、价格类型、颜色、线条样式及粗细。
动态末端标签 | 自动在每条 MA 线的末端放置清晰易读的标签。
启用/禁用 | 可对每条 MA 线进行独立的开启/关闭控制。
多重实例 | 可在同一图表上安全地加载多个副本(通过独特的对象命名机制实现)。
详细输入参数
1. 快线 MA 设置区
启用 / 禁用
周期(默认值:10)
计算方法:SMA(简单移动平均)、EMA(指数移动平均)、SMMA(平滑移动
FREE

EMLU Precision AI — Free Demonstration Version for MT5 Type: Expert Advisor (MT5) ️ Important Notice (Read Before Downloading) This Free version of EMLU Precision AI is designed strictly for demonstration, research, structural inspection, and interface familiarisation . It does not represent the behaviour, logic depth, live signals, or performance results of the full paid version. Performance, trade frequency, and result quality are intentionally reduced to prevent misuse of the free edition as
FREE

Totz Smart Money Concepts (FVG + Supply/Demand + Liquidity) Totz SMC is an all-in-one Smart Money Concepts (SMC) visual indicator engineered to clean up your charts, standardise market structure identification, and highlight high-probability institutional entry zones automatically. Key Features Fair Value Gaps (FVG): Automatically plots bullish and bearish imbalance zones with custom opacity and minimum size filtering. Supply & Demand Zones: Pinpoints explosive institutional displacement b
FREE

Smart Breakout Pro identifies strong directional moves by combining three proven indicators: EMA (50) — Detects the dominant market trend
ADX (20) — Confirms that the trend has real momentum (not a fakeout)
RSI (60/40) — Filters out exhausted or weak entries
Input Parameters Trading Settings InpLotSize — Fixed lot size per trade (default: 0.01) InpMagicNumber — Unique ID for EA trades (default: 20250521) InpMaxSpread — Maximum allowed spread in points (default: 30) InpSlippage — M
FREE

If you are Looking Best indicators in Mql5 Market. Check these out!
SSS Scalping Smart Signals MT5 Indicator
Scalping Winning Signals Pro SWS
LTL Long Trend Locator The Ultimate Rule Protection Dashboard for FundingPips Traders Never Fail Another FundingPips Challenge Because of Rule Violations Most traders don't lose FundingPips challenges because they can't trade. They fail because they accidentally violate one of the firm's rules. A single mistake...
One oversized loss...
One overlooked d
FREE

Secura Smart Scalper - Advanced Dual Direction Trading EA Next-Generation Smart Trading Technology Secura Smart Scalper represents the evolution of automated trading systems, combining sophisticated progression algorithms with intelligent risk management to deliver consistent performance in various market conditions. This isn't just another grid or martingale EA - it's a carefully engineered system designed for sustainable growth. Live Signal: C oming Soon
IMPORTANT! After the purchase pleas
FREE

Tired of guessing whether the market is calm or about to explode? See every candle's volatility regime at a glance, in color. Any pair, any timeframe, any market. No repaint. Free — download it and read your chart in seconds.
>> Get more free indicators here
Baseline, volatility, oscillators & more — free and premium.
No repainting. No guessing. Just clean signals.
THE PROBLEM Raw range tells you little. A 40-pip candle on Gold is quiet; on EURUSD it is a storm. Fixed ATR thresholds y
FREE

ChartControl 是一款轻量级的实用型指标,用于快速手动切换图表。它允许你通过键盘快捷键在当前图表上切换 交易品种 和 周期 —— 非常适合快速扫盘,无需鼠标点击。 本产品仅以 EX5(已编译) 形式发布。 主要功能 通过 Market Watch(市场报价) 列表快速切换品种 按预设周期集合快速切换周期(M1…MN1) 占用资源极低(无计算、无绘图) 当你用鼠标/菜单手动切换品种或周期时自动同步 快捷键 A — 上一个品种(Market Watch) D — 下一个品种(Market Watch) W — 下一个周期(更大) S — 上一个周期(更小) 周期顺序:
M1 → M5 → M15 → M30 → H1 → H4 → D1 → W1 → MN1 使用方法 将指标加载到任意图表 点击一次图表以确保图表处于焦点 使用 A / D / W / S 切换品种/周期 说明 品种切换仅基于当前 Market Watch 中可见的品种。 若 Market Watch 为空,指标将使用当前图表品种。 兼容性
MetaTrader 5,所有经纪商,任意图表。
FREE

Confluence Signal Engine (MT5 Indicator) A powerful multi-indicator confluence tool that analyzes market conditions using EMA trend, RSI, MACD, Stochastic, ADX, Bollinger Bands, Volume, and candlestick patterns to generate high-confidence trading signals. It filters trades using: Minimum indicator agreement (confluence) Market session quality Multi-timeframe confirmation Risk-to-reward validation (ATR-based SL/TP) The indicator provides: Real-time dashboard with signal strength (%) Early alerts
FREE

Chaikin 的波动指标计算最大和最小价格之间的价差。它基于最大和最小之间的幅度来判断波动性。不像 平均真实范围 , Chaikin 的指标没有将跳空考虑在内。 根据 Chaikin 的解释, 在相对较短的时间里交易量增长, 意味着价格即将抵达最低点 (就像证券的恐慌性抛盘), 而在较长的时间周期里波动降低, 意味着价格处于峰值 (比如, 在成熟的牛市条件下)。
FREE

The Magic EMA indicator is of great help in determining trend direction. It can be an excellent addition to your existing strategy or the basis of a new one. We humans can make better decisions when we see better visually. So we designed it to show a different color for rising and falling trends. Everyone can customize this in the way that suits them best. By setting the Trend Period, we can optimize it for longer or shorter trends for our strategy. It is great for all time frames.
IF YOU NEED
FREE

Account Profit & Loss Killer
全账户级智能风控 EA(MT5 )
⸻
产品简介
Account Profit & Loss Killer 是一款真正意义上的 “账户总控风控工具”
它不参与任何交易策略,只专注于一件事:
当账户内所有持仓的总浮动盈利或总浮动亏损达到你设定的金额时,立即毫秒级强制平仓账户中的全部订单。
这是一个真正意义上的 “账户总控风控工具”。
⸻
核心功能
全账户级风控(Account-Level)
• 实时监控账户内 所有持仓
• 本 EA 下的订单
• 其他 EA 下的订单
• 人工手动下的订单
• 不区分品种
• 不区分方向
• 不区分 Magic
• 条件触发后 → 全部立即处理
⸻
账户级盈利止盈
• 当 所有持仓的总浮动盈利 ≥ 设定金额
• 自动 一键全平
• 锁定利润,防止回吐
适合:
• 日内
FREE

TickChartAskLine is a specialized indicator for MetaTrader 5 designed to visualize floating spread on tick charts created with TickChartService. The indicator displays two lines on the chart: a blue Bid line (main price) and a red Ask line, allowing traders to visually track spread dynamics in real-time. This is critically important for scalpers and high-frequency traders who need to monitor entry costs at every tick level. The indicator automatically reads the saved spread from the custom sy
FREE

Swiss CandleTime What ist CandleTime for This indicaor just displays the remaining time for a candle to build. It is best used if you trade with timframes from 3 minutes. I use it in M3 to keep postions. If I have two following red candles i usually liquidate the position. Timeframes M1 to H1 Inputs Arrow displayed => Edit your arrow string Arrow for waiting conditions => Arrow if chart is offline Text Color => color of the text Tell if there is a trend change => tells you, if the two preciding
FREE

The dashboard functions as a decision-support tool rather than an execution panel. It centralizes technical data across seven timeframes (M1 to D1) so you can see the "big picture" at a glance. Price: Displays real-time bid/ask values for each timeframe. Signal: Provides a basic "BUY" or "SELL" recommendation based on recent candle close data. Trend & Summary: Shows the dominant market direction (e.g., "UP" and "BULLISH"). Structure: Identifies "BOS BULL" (Bullish Break of Structure), indicati
FREE

The Kalires Channel Indicator is a technical indicator used to evaluate trend direction and potential trading opportunities. This is a hybrid indicator that combines Kauffman Adaptive Moving Average (KAMA), linear regression and smoothing. The Kalires Channel Indicator consists of two lines: one central and two outer bands. The central line is a smoothed KAMA modified according to the direction of the trend. The outer bars represent two linear regression lines drawn above and below the center l
FREE
Exact Time — detailed time on the seconds chart. The utility shows the opening time of the selected candle. This is necessary when working with seconds charts. For example, it can be used on a seconds chart built using the Seconds Chart utility. Inputs Base corner — the chart corner to which an object Is attached. X distance — the horizontal distance from the chart corner. Y distance — the vertical distance from the chart corner. Text font — font name Font size — font size Color — text color
FREE

Hi everyone, I had make that product for try help you get another lever without so hard work and painful... This work on most EUR pairs, maked that for EURUSD but work one anothers, becouse the simple strategie is just follow some nicelh indicators that i use for trade... and is my strategie in a program ... i don't advise start with less that -1000 and more than 0.01 but you can find too how work the tool and how you can work with that so , i will let there a group of telegram for that , try ha
FREE
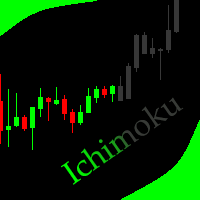
This indicator allows to hide Ichimoku Kinko Hyo (on all MT5 timeframes) from a date define by the user, with a vertical line (Alone) or a panel (with "Hidden Candles"). Indicator Inputs: Tenkan-sen Kijun-sen Senkou Span B Information on "Ichimoku Kinko Hyo" indicator is available here: https://www.metatrader4.com/en/trading-platform/help/analytics/tech_indicators/ichimoku ************************************************************* Hey traders!! Give me your feeds! We are a community here
FREE

1.InequationEurUsdChf4智能交易系统原理: 三币对冲非平衡套利是在三角套利的基础上的拓展与延续。三角套利作为一种比较常见的套利方式,不少投资人在外汇交易中都有用到过。三角套利是基于交叉汇率实现的,它是三角套利的基础,所谓交叉汇率,是指用一种非美元的货币表示另一种非美元货币的价格。如某个外汇市场上USDCHF =0.88366,EURCHF =0.95921,EURUSD =1.08575,当USDCHF×EURUSD≠EURCHF时,这就为三角套利提供了可能。 然而,严格的三角套利由于点差、滑点、隔夜利息、手续费等原因,并不能获利。如果在以上的三个货币对上增加不平衡系数,打破这种对称性,便有了获利的可能性。 如:同时下单1、sellA手eurusd,2、sellB手usdchf,3、buy C手eurchf,4、A、B、C系数通过计算获得。 如果Ask_EURUSD * Ask_USDCHF - Bid_EURCHF < - 500, 同时交易三个订单 Ask_EURUSD,Ask_USDCHF , Bid_EURCHF; 如果 Bid _EURUSD * Bid
FREE

Reversal Hunter PRO – Smart Detection of Market Turning Points Reversal Hunter PRO is a non-repaint custom indicator designed to detect potential market reversal zones using a unique combination of: RSI overbought/oversold signals Volume spike analysis Smart candlestick pattern recognition This tool is perfect for traders who want early confirmation of trend exhaustion and reversal opportunities on any time frame and pair , especially scalpers and swing traders. Features: Non-repa
FREE

Input Description The indicator provides flexible options to display trading history directly on the chart, including: Days to show Profit
Displays only trades executed within the last X days from the current time. Font Size
Allows selecting the font size used to display trade information on the chart. Show Volume
Enables or disables the display of trade volume for each position. Show Currency
Enables or disables the display of the currency unit for profit values. Color for Win Trade
Sets t
FREE

中文 (Chinese) 适用于MetaTrader 5 (MT5)的虫洞时间框架指标 不仅仅是另一个交易工具——它是您在金融市场中的竞争优势。专为新手和专业交易者设计,虫洞指标彻底改变了您分析数据和决策的方式,确保您始终领先一步。 为什么您需要虫洞指标 领先竞争对手: 同时在同一图表上查看两个时间框架的能力,让您始终比他人快一步。再也不用在不同图表之间切换,您需要的一切尽在眼前。 发掘隐藏的机会: 改变传统时间框架,发现其他交易者错过的模式。想象一下,您的H1图表在1:59 PM而非2:00 PM关闭,这让您在市场反应之前采取行动。或者调整5分钟图表的边界,从00:01到00:06分析蜡烛,而不是标准的00:00到00:05。这些微妙的变化可以揭示独特的市场动态。 获取可操作的见解: 借助检测趋势、反转和支撑/阻力水平的精密工具,虫洞为您提供自信交易所需的知识。 经验证的创新 虫洞指标并非基于猜测,而是尖端研究的成果: 利用机器学习分析市场低效性。 识别零售交易的集群以揭示隐藏的市场动态。 这些见解推动了一个结合专业级策略的指标开发。 虫洞如何赋能您 更快决策: 实时数据让您始终领先
FREE

RaysFX Elastic Order Flow Matrix (EOFM) L'indicatore definitivo per gli Scalper e i Day Trader che operano su timeframe rapidi (M1). Il RaysFX Elastic Order Flow Matrix non è un semplice oscillatore. È un motore analitico avanzato progettato per decodificare la vera pressione compratrice o venditrice del mercato, filtrando il "rumore" tipico dei grafici a 1 minuto. Se sei stanco di farti fermare dai falsi segnali generati dalle candele di basso volume o dalla congestione, questo strumento ti
FREE

Position Size Tool – Smart Risk Management & Trade Execution Panel The Position Size Tool is a powerful and intuitive MT5 panel that simplifies your trading by combining position sizing , risk calculation , risk/reward visualization , and order placement —all in one place. ️ Clean & Functional Interface The tool features a compact, real-time panel with the following: Balance & Equity display Live Price tracking Customizable Risk % input Auto-calculated Lot Size based on SL and Risk Input for S
FREE

PositionRelay Master Publisher 将 MetaTrader 5 中的持仓快照发送至 PositionRelay 云端中继。适用于运行主账户、并希望在其它终端或经纪商上的从账户低延迟镜像开仓、平仓、止损与止盈更新的交易者。
配套产品:PositionRelay Slave Subscriber(免费)。在本 EA 开始发布后,于每个跟随账户上安装。两个 EA 使用相同的 PositionRelay User ID。
要求: - 有效的 PositionRelay 云端订阅(在 positionrelay.com 注册) - 来自 positionrelay.com 控制台的 PositionRelay User ID - 每个跟随终端安装 PositionRelay Slave Subscriber - 主终端稳定的互联网连接
设置: 1. 在 positionrelay.com 创建账户并订阅 2. 从 Market 安装 PositionRelay Master Publisher 3. 将 EA 附加到主账户的一个图表 4. 在 InpUserId
FREE

速度略有变化。 测试人员需要一个新的顾问,谁有兴趣,写信给我通过电子邮件777basil@mail.ru https://backoffice.aurum.foundation/u/DHXP1U
该指标基于历史价格变化计算,并以数学方式计算,每次再次接收数据时重新计算。 它可以在不同的时间框架上使用。 从70%的指标边界来看,价格运动或整合方向发生变化。 通过这种方式,您可以在趋势和通道中间从其边界进行交易。 最好在趋势交易中使用它来确定阻力位/支撑位。 在视频中,您可以看到指标是如何工作的: https://youtu.be/UG2ZZEH9B_U 通讯联系人 777basil@mail.ru 我们将为您的任务准备一个专家,一个指标。
该指标基于历史价格变化计算,并以数学方式计算,每次再次接收数据时重新计算。 它可以在不同的时间框架上使用。 从70%的指标边界来看,价格运动或整合方向发生变化。 通过这种方式,您可以在趋势和通道中间从其边界进行交易。 最好在趋势交易中使用它来确定阻力位/支撑位。 在视频中,您可以看到指标是如何工作的: https://youtu.be/0
FREE
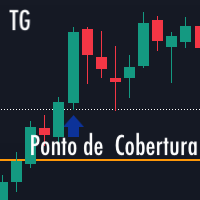
覆蓋點/損益平衡點 (TG Ponto de Coverage/Breakeven)
此指標會檢視您當日相對於圖表上資產的交易結果,並在與未平倉部位的覆蓋點(損益平衡點)對應的價格處加上一條線,同時考慮入場價格和手數。新的入場操作後,覆蓋點將根據開倉操作的平均價格和手數重新計算。
如果當日結果為零,則會在目前交易的價格處顯示一條線。
如果當日結果為正(獲利),則會在價格中顯示一條線,指示操作的覆蓋點。
如果當日結果為負(虧損),則會在價格中顯示一條線,指示操作的恢復點。
已針對淨額結算帳戶進行測試
請對此指標進行評分並新增評論。
...........................................
FREE

每个交易者都熟悉这套流程:打开指标设置、改一个数字、点击 OK、盯着图表看、觉得不对、再打开设置。DeMarker 是一个安静的超买/超卖指标,大多数交易者从来不去动它——它永远停留在默认的 0.30/0.70,因为每试一个新数值都要来回打开一次对话框。DeMarker Live Tuner 结束了这一切。 这是一个可以 直接在图表上实时调节 的 DeMarker。图表上有一个小面板,带有 DeM 周期和两条水平线(0..1 刻度)的滑块。拖动滑块,指标立刻重新计算并重绘,就在您眼前完成。0.25/0.75 还是 0.35/0.65 比默认值更适合过滤您的市场——几秒钟内就能在自己的图表上得到答案,而不用去论坛里翻帖子。 可选的 MA 信号线。 直接在面板上开启或关闭 DeMarker 的移动平均线,用独立滑块设置其周期,一个按钮循环切换计算方法——SMA、EMA、SMMA、LWMA。每一次改动都会立即反映在图表上。 真正的 DeMarker,而不是套壳。 指标采用自己干净的经典公式实现:DeMax = max(High - 前一根 High, 0),DeMin = max(前一根 L
FREE

Your chart. One glance. Total clarity. Built by @Ash_TheTrader for traders who are tired of guessing, Extreme Trading Dashboard is a professional-grade heads-up display that sits quietly in the corner of your chart — dark charcoal, rounded, semi-transparent, and genuinely easy on the eyes — until the moment it matters. Dual Session Highlighter Shade up to two independent time windows directly on your chart — London, New York, or your own custom kill-zone. Each gets its own color, so overlapp
FREE

这是一款适用于 MetaTrader 5 的多品种仪表板指标,可同时提供多达 20 个交易品种的市场倾向(bias)和价格区间状态的实时概览。其专业版(Pro Version)包含通知功能,可在 Mql5 商店获取。
主要特点:
可加载至任意图表 — 运行独立于图表当前的交易品种。
实时仪表板表格,显示:
当前价格
日、周、月度倾向(当前价格与对应周期开盘价的对比)
日、周、月度区间状态:
HIGH(高位)→ 价格突破上一周期的最高点(看涨突破)
LOW(低位)→ 价格跌破上一周期的最低点(看跌突破)
NO BIAS(无倾向)→ 价格仍处于上一周期的区间内
整体倾向 — 基于日/周/月度倾向的多数投票结果(看涨或看跌)
智能通知(仅在 M15 K 线收盘时触发以减少干扰):(仅限专业版)
整体倾向变化
区间突破(高点/低点)
单个周期倾向反转
首次加载时:发送所有品种的综合汇总信息
视觉自定义:
通过按钮切换仪表板显示/隐藏
可调整宽度、颜色和字体大小
支持按倾向排序(看涨品种置顶)
支持任意交易品种(外汇、黄金、指数等) — 只需输入“市场报价
FREE

TimeBar TimeBar 是一個簡單的資訊指示器,顯示柱關閉之前的剩餘時間,以及柱打開以來經過的時間和當前時間。 為了便於感知,增加了兩種顯示方式:以圖形左上角註釋的形式,或以圖形物件的形式。
優點 字體選擇 字體大小。 您可以設定任何一項。 評論的時候太小了 您可以移動物體。 雙擊滑鼠可以選擇任何時間並移動到圖表上的任何位置,它將照常繼續更新 視覺警報。 您可以設定指定的秒數,直到目前柱關閉,達到該時間後,時間將變成設定中指定的警告顏色 設定 選擇顯示的時間 每次的顏色(對於圖形物件) 一則警報,通知您酒吧即將關閉 使用 TimeBar 指標作為您交易系統的補充
使用連結嘗試我在市場上的其他產品 https://www.mql5.com/ru/users/capitalplus/seller
FREE

MACandleApprox — 均线近似蜡烛指标 MACandleApprox 是一款在价格窗口上,把开盘、最高、最低、收盘四个价格序列分别经过选定类型的移动平均处理后,重绘为"近似蜡烛"的自定义指标。它不改变原始 K 线,而是在主图上叠加一层基于均线的平滑蜡烛视图,帮助交易者更直观地观察价格的平滑走势与方向变化。 本指标最多支持三组独立的近似蜡烛,每组均可单独开启或关闭,并独立配置长度、均线类型与涨跌颜色。 支持的均线类型 每组蜡烛可选择下列六种均线算法之一: SMA — 简单移动平均 EMA — 指数移动平均 WMA — 线性加权移动平均 VWMA — 成交量加权移动平均(基于成交量序列计算) HMA — 赫尔移动平均(以 WMA 组合方式近似计算) RMA — 平滑移动平均(即 SMMA/RMA) 输入参数 第一组蜡烛(默认开启) 显示第一组蜡烛:是 / 否 长度:21 均线类型:SMA 蜡烛样式:影线样式(在近似模式下统一定义为实体蜡烛) 看涨颜色:绿色 看跌颜色:红色 第二组蜡烛(默认关闭) 显示第二组蜡烛:是 / 否 长度:50 均线类型:EMA
FREE

Squeeze Momentum Force is an advanced technical analysis indicator designed for MetaTrader 5. It combines volatility squeeze detection with momentum analysis to identify high-probability trading opportunities. Based on John Carter's original concept, this enhanced version incorporates: Multi-Timeframe (MTF) analysis. Divergence detection. Volume weighting. Modern user interface for quick market interpretation. The indicator identifies periods of low volatility (squeeze) that typically precede si
FREE

CCI Multi-Timeframe Dashboard shows the CCI reading of four timeframes at the same time, so you can measure momentum extremes across the market at a glance. By default it displays the M15, H1, H4 and D1 timeframes, and the period, applied price and levels are configurable. Each timeframe is color coded, with red when the reading is above the upper level, green when it is below the lower level and grey when it is in the normal zone, which makes stretched conditions easy to see. Alerts are based o
FREE
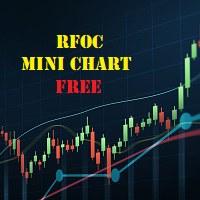
The RFOC Mini Chart was created to project a macro view of the market, which the option to select the timeframe of interest other than the main chart, it is possible to include 2 indicators: 1 - Moving average channel On the mini chart, the moving average will be created based on the prices of the selected time frame for the RFOC Mini Chart. The moving average period must be selected in the indicator settings pannel.
2 - Boillinger Band In the mini chart, a boillinger band will be created based
FREE

BrioQuant Position Monitor keeps your floating result where your eyes already are: beside the newest candle at the current price. Show this symbol's positions or the whole account, in cash and as a percentage of balance or equity, with optional entry lines and a per-position label for every open trade on the chart symbol. Features: - Floating readout rides the newest candle at current price height - no corner panel to glance away at - Scope: this symbol or the whole account; swap included or exc
FREE

WHO IS THIS FOR?
→ Manual traders who want to track performance without leaving MT5 → EA developers who need quick visual feedback on strategy results → Fund managers who want a clean, presentable performance overview → Anyone serious about understanding their trading edge
WHAT MAKES IT DIFFERENT
Most trading dashboards show you numbers. This one shows you the
FREE

Nem Nem is super accurate mt5 indicator it is working with any pair any time frame it will show and provide you with high Winrate signal you can use for forex pairs , gold and any other pairs it is easy to use also you can see the white lines for starting and end of signals it will help you to read the chart and enter and make correct decisions in trades. also it will be clear for you when to enter and exit from any trades
FREE

At first, I got my teeth into Phoenix Ultra Expert Advisor.
This Expert Advisor will support automatic close order if the direction is correct and perform recovery if the direction is wrong. If you enter an order: 1. The price goes in the right direction and hits the Min Profit Point , trailing stop 20% of the current profit. 2. The price goes in the opposite direction, the Expert Advisor will place the order with the volume is Recovery Volume Percent at the input, the distance to
FREE

İŞLEM GİRİŞ KOÇU - Ücretsiz MT5 Eğitim Göstergesi Trade Entry Coach, MetaTrader 5 kullanıcılarının trendleri, destek ve direnç seviyelerini ve mum çubuğu onaylarını daha yapılandırılmış bir şekilde değerlendirmelerine yardımcı olmak için geliştirilmiş ücretsiz bir eğitim göstergesidir. Bu gösterge, mevcut grafik zaman dilimindeki piyasa koşullarını analiz eder ve sonuçları kompakt bir bilgi panelinde görüntüler. Otomatik olarak işlem açmaz veya kullanıcı adına işlem kararları almaz. ANA ÖZELLİK
FREE
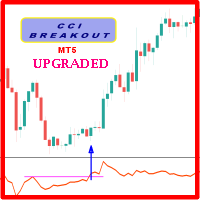
Probability emerges to record higher prices when CCi oscillator breaks out oscillator historical resistance level when exhibit overbought values. Since, oscillator breakout of support and resistance have similar effect as price breaks support and resistance levels, therefore, its highly advised to confirm price breakout with oscillator breakout; certainly, will have the same output in short trades. Concept is based on find swing levels which based on number of bars by each side of peak or troug
FREE

Take control of your trading performance with the Pro Dashboard Screener Designed for serious traders, this utility provides a clean, professional, and real-time overview of your account's health directly on your chart. Stop switching between tabs to check your stats. With the Quant Pro Dashboard, your key metrics are always front and center, allowing you to focus on what matters most: your analysis. Key Features: Account Intelligence: Automatically detects your Account Number and Broker detail
FREE

Tick Database — export of tick database from MT5 terminal to MT4. The utility provides access to the tick database in real time. This is necessary to generate synthetic charts in the MT4 terminal, which initially does not provide for loading a tick database. For example, you can organize permanent access to the tick database for the Seconds Chart utility. If the opening time of the current candle in the terminals is different, then you need to specify the time offset in hours. Example We open M1
FREE

ApexForge One Click Close EA 概述 ApexForge One Click Close EA 是一款輕量級交易輔助工具,讓您只需點擊一下,就能立即關閉所有符合條件的持倉,並可選擇同時刪除掛單。 在市場劇烈波動時,手動一筆一筆平倉既耗時又容易錯失良機。這款 EA 為您提供快速、可靠且視覺清晰的一鍵清倉解決方案。 ️ 本工具不會自動開單或產生交易訊號,僅用於 持倉管理 和 風險控制 。 主要功能 一鍵平倉 – 瞬間關閉所有持倉 顯示總手數 – 按鈕上即時顯示當前總持倉量 平倉範圍選擇 – 可選擇「全部帳戶」或「當前品種」 魔術數字過濾 – 只平倉特定 EA 的訂單 刪除掛單 – 可選擇同時刪除掛單(限價單/止損單) 非同步佇列處理 – 不卡頓,逐筆獨立重試 視覺回饋 – 按鈕顏色變化顯示目前狀態(就緒/平倉中/無持倉) 高度可自訂 – 位置、大小、顏色、字型、文字皆可調整 輕量設計 – CPU 佔用極低,50ms 定時器高效運作 輸入參數 平倉設定 參數 說明 平倉範圍 全部帳戶持倉 / 僅當前品種 啟用魔術數字過濾 開啟/關閉魔術數字過濾 魔術數字 指定要過
FREE

The VR Object Delete All script solves the problem of garbage on the chart. it is often necessary to completely clear the chart of everything that is put on it, comments, lines, objects. The script completely deletes everything, even those objects that are not visible. When working, VR Object Delete All writes everything it does in the terminal log, as well as the names of objects to delete. Displays the number of deleted objects as a separate line. in case of any errors, it will display an erro
FREE

Tick Data HTTP Exporter NZDUSD 此免费版本仅导出 NZDUSD;完整版 Tick Data HTTP Exporter 可导出任意交易品种。 说明 本 EA 可将您的终端变成应用程序的历史和实时 Tick 数据源。
互联网上有很多市场数据提供商,但实际上它们提供的数据质量并不总是令人满意。此外,这类服务往往价格更高,而且通常需要按每个交易品种支付月度订阅费。
使用本 EA,您可以向应用程序提供与终端中所见完全相同的 Tick 数据,也就是您进行交易和市场分析所依据的数据。
与提供K线数据(OHLC)的 Candle Data HTTP Exporter 搭配使用,即可获得市场分析所需的完整数据集。 功能 将 Tick 数据发送到预先配置的外部 HTTP URL。 保证每一个 Tick 都能送达;发生中断时,可从最后发送的 Tick 继续。 Tick 时间戳偏移量(offset)提供两种存储方式: 本地文件(默认,自动管理) 您服务器上的 HTTP 地址(用于与应用程序集成) HTTP 请求失败时自动重试,确保 Tick 可靠送达。 按可配置的批次大小传输数
FREE
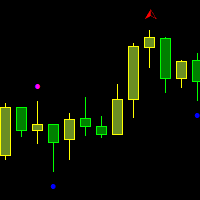
Fractals Broken/Unbroken This indicator detects classic Bill Williams fractals and separates them into two categories: broken and unbroken fractals. The tool helps traders quickly identify which fractal levels have already been broken by price action and which levels remain intact as potential support or resistance zones. The indicator works directly on the chart and displays different fractal types using separate colors for easier visual analysis. How It Works The indicator uses the standard 5-
FREE

Black Friday PROMO launch My portfolio . I am giving this expert advisor for FREE.
The Expert Advisor has been developed by AI for Nikkei and M15 timeframe. There is no need to set up parameters, all settings are already optimized and fine-tuned. Recommended broker RoboForex because of EET timezone.
My recommendation is to have a look also at the rest of my products in the portfolio, as they work very well together in combination. Check other portfolio screenshots.
Dax Ai , Daw Ai , Niki Ai ,
FREE

CDS SR Fractal Level: Dynamic Fractal Support & Resistance with Breakout Alerts Overview Tired of manually drawing and updating support and resistance lines? The CDS SR Fractal Level indicator automates this crucial process by intelligently identifying key market levels based on fractals. This lightweight and efficient tool allows you to focus on your trading strategy, not on chart setup, ensuring you never miss an important price level or a potential breakout. This indicator is clean, simple,
FREE

TradeMasterPanel — One-Click Manual Trading Panel for MT5 TradeMasterPanel is a professional one-click trading assistant for MetaTrader 5, designed to help traders execute, manage, and protect positions directly from the chart. All settings can be adjusted on-chart and are automatically saved for each trading symbol, eliminating the need to reopen the Inputs dialog or reattach the EA. The interface is fully scalable and DPI-aware for modern high-resolution displays. 1. Market Order Entry Open B
FREE

The Daily Highs and Lows Indicator is a versatile tool that combines support and resistance levels with real-time market dynamics. By incorporating previous daily highs and lows, it provides valuable insights into market psychology and identifies potential areas of price reversals or breakouts. With its ability to adapt to changing market conditions and customizable options, traders can stay ahead of trends and make informed decisions. This indicator is suitable for various trading styles and ti
FREE

FREE

VWAP for IntradayTraders
Session-aware VWAP lines for fast, precise scalps.
Best used with OmniFlow Intraday Trading system : https://www.mql5.com/en/market/product/179364
️ Inputs (MT4/MT5) Enable_Hourly_VWAP: Toggle hourly VWAP. Enable_Asia_VWAP: Toggle Asia session VWAP. Enable_Europe_VWAP: Toggle Europe session VWAP. Enable_NA_VWAP: Toggle North America session VWAP. Enable_Extended_VWAP: Toggle extended session VWAP. Enable_Daily_VWAP: Toggle daily VWAP. Asia Session (GMT)
Session_Asi
FREE

An indicator for visualizing time ranges of key trading sessions: Asian, European, and American. The indicator features functionality for setting the start and end times of each trading session, as well as an adjustable timezone of the trading server. The main advantages of the indicator include the ability to operate with minimal CPU load and memory usage. Moreover, it offers the option to specify the number of displayed historical days, providing the user with flexible market dynamics analysis
FREE

1. AsymmetryEurUsdJpy1 智能交易系统原理: 三币对冲非平衡套利是在三角套利的基础上的拓展与延续。三角套利作为一种比较常见的套利方式,不少投资人在外汇交易中都有用到过。三角套利是基于交叉汇率实现的,它是三角套利的基础,所谓交叉汇率,是指用一种非美元的货币表示另一种非美元货币的价格。如某个外汇市场上美元 / 日元 =142.840 ,欧元 / 美元 =1.00435 ,欧元 / 日元 =143.375 ,当(美元 / 日元) × (欧元 / 美元)不等于(欧元 / 日元)时,这就为三角套利提供了可能。 然而,严格的三角套利由于点差、滑点、隔夜利息、手续费等原因,并不能获利。如果在以上的三个货币对上增加不平衡系数,打破这种对称性,便有了获利的可能性。 如:同时下单 1 、 sellA 手 eurusd,2 、 sellB 手 usdjpy,3 、 buy C 手 eurjpy , 4 、 A 、 B 、 C 系数通过计算获得。 如果 Ask_EURUSD * Ask_USDJPY - Bid_EURJPY < - 300, 同时交易三个订单 Ask_EURUSD ,
FREE

Aura Lot Calculator – know your exact position size in one second.
Stop guessing your lot size. Set your risk, place your stop loss, and Aura Lot Calculator instantly shows the correct lot – so every trade risks exactly what you planned, nothing more.
HOW IT WORKS - Choose your risk: % of balance or a fixed money amount (one click to switch) - Enter your stop loss in points – or turn on the SL Line and simply drag it on the chart - The calculator detects BUY or SELL automatically from the lin
FREE
MetaTrader市场是一个简单方便的网站,在这里开发者可以出售自己的交易应用程序。
我们将帮助您发布您的产品,并向您解释如何为市场准备您的产品描述。市场上所有的应用程序都是加密保护并且只能在买家的电脑上运行。非法拷贝是不可能的。
