 MetaTrader 5
 专家
 指标
 程序库
 实用工具
 窗口小部件
 规则
适用于MetaTrader 5的免费EA交易和指标 - 85
 使用EA交易和指标,使外汇交易获得更多盈利。EA交易可使您自动开启和关闭交易,而指标将帮助您更准确地预测市场行为。
该页面提供MetaTrader 5应用程序的目录。
In the world of finance, correlation is a statistical measure of how two securities move in relation to each other. Correlations are used in advanced portfolio management. This indicator measures how different securities move in relation to a reference one, thus making portfolio management easier. [ Installation Guide | Update Guide | Troubleshooting | FAQ | All Products | Get Help ] Avoid concurrent trades in highly correlated instruments Find trading opportunities among highly correlated
FREE

IRush 指标使用流行指标 RSI(相对强度指数)的修改版本来寻找日线图或更低的条目。 该指标已使用以下主要交易品种进行设置和测试:AUDUSD、EURUSD、GBPUSD、USDCAD、USDCHF、 USDJPY。
使用该指标的自动交易是在专家顾问 Intraday Rush 中实现的。 该专家顾问可以打开、追踪和关闭其交易。 看看吧,它可能正是您正在寻找的!
IRush 的正确阅读
前一个柱的颜色表示当前柱的订单类型。 绿色 - 买入,红色 - 卖出,灰色 - 不确定性。 当前柱正在改变。 不建议根据当前柱线做出决定。
指标线显示超买和超卖区域。 接近70或更高,你不应该买。 接近30或更低,你不应该卖。
建议
在日线图上进行交易。 在一天开始时做出交易决定。
同一交易品种上类似信号的交易次数不得超过 2 次。
寻找不同交易品种的入场点并在不同交易品种上开仓交易。
每 1 笔交易的交易量为 250 美元存款的 0.01(更安全的水平是 1000 美元存款的 0.01)。
获取 300 (3000) 点,追踪 100 (1000) 点。
让您的交易“喘息”至
FREE

Session Visualizer v1.0 This indicator displays the main trading sessions (Asian, London, and New York) directly on the chart. It helps traders understand market activity by visually highlighting session times based on broker time. The indicator automatically detects active sessions and updates in real time. It uses color overlays to differentiate between sessions while maintaining chart visibility. Features include real-time session visualization, adjustable transparency, and support for all s
FREE

ArgosWatch Drawdown Meter MT5 — Daily Loss & Maximum Drawdown Live Monitor
Most trading accounts and prop challenge attempts are not lost to a bad strategy. They are lost to arithmetic performed under pressure: trying to calculate mid-trade how much of today's loss allowance is already gone and whether the next position still fits inside it.
ArgosWatch Drawdown Meter answers that question continuously in real time, and adds something a simple readout cannot give you: an on-chart daily history
FREE

TLC MACD Multi-Timeframe plots a real MACD from a higher timeframe directly on your current chart, without you having to flip back and forth between windows.
Most "multi-timeframe" MACD indicators fake it by just using a longer period on your current timeframe. This one doesn't do that. It reads the actual MACD from the timeframe you choose (daily, for example) and holds that same reading across every bar on your chart until the next higher-timeframe bar actually closes. So what you see is exa
FREE

Bamboo expert is based on the custom indicator Bamboo . Entry points are determined using Bamboo values. Positions are closed when reaching specified profit and loss levels or when opposite signal appears if Stop Loss and Take Profit values are zero. Input Parameters Period - Period parameter of the indicator Bamboo; Mode - operation mode of the Expert Advisor (0-7); Stop Loss - loss fixing level in points; Take Profit - profit fixing levels in points; Lot - lot size. The screenshots demonstrate
FREE

The indicator looks for the "Fifth dimension" trade signals and marks them on the chart. A detailed description of the chart patterns that generate the trade signals can be found in Chapter 8 "The Balance Line Trades" in the book Williams' "New Trading Dimensions". Signal levels with indication of the position entry or stop loss placement price are indicated directly on the chart. This feature creates additional convenience for the trader when placing pending orders. A solid horizontal line is d
FREE

The standard Bollinger Bands indicator has been improved by integrating additional indications from the Standard Deviation indicator (StdDev), which gives an additional filter for confirming trading signals. In addition, the color of the indicator's lines shows the beginning of a trend, its development and exhaustion. This indicator has a signal block that notifies the trader of the beginning of the trend on any time frame to which it is attached.
Settings Type of messages - select the type of
FREE
Are you tired of trading without a clear direction ? Do market fluctuations and noise leave you feeling overwhelmed ?
Here is the solution you've been searching for! Imagine an indicator that simplifies trading, cuts through market noise, and provides crystal-clear signals. The Heiken Ashi OHLC Indicator does just that!
What does the Heiken Ashi OHLC Indicator do? It transforms traditional candlestick charts into a trader's dream. Instead of dealing with erratic price movements, you'll witn
FREE

Program Features 1. Calculation of Margin Call and Liquidation Prices Monitoring all open positions: The program continuously analyzes all open positions on the trading account. Determining critical price levels: Margin Call Price: The price at which additional funds must be deposited to keep positions open. If this does not occur, liquidation follows. Liquidation Price: The price at which positions are automatically closed by the broker to prevent further losses. 2. Display of Prices on the Ch
FREE

Bollinger Bands Advanced Suite for MetaTrader 5 Take the classic power of Bollinger Bands and supercharge it with institutional-grade precision and a professional, multi-channel alert system. The Bollinger Bands Advanced Suite is not just another moving average envelope; it is a complete volatility analysis tool designed for the modern MetaTrader 5 trader. Whether you are a breakout trader, a mean-reversion specialist, or use bands for dynamic support and resistance, this suite provides the c
FREE

Tick Data HTTP Exporter NZDUSD 此免费版本仅导出 NZDUSD;完整版 Tick Data HTTP Exporter 可导出任意交易品种。 说明 本 EA 可将您的终端变成应用程序的历史和实时 Tick 数据源。
互联网上有很多市场数据提供商,但实际上它们提供的数据质量并不总是令人满意。此外,这类服务往往价格更高,而且通常需要按每个交易品种支付月度订阅费。
使用本 EA,您可以向应用程序提供与终端中所见完全相同的 Tick 数据,也就是您进行交易和市场分析所依据的数据。
与提供K线数据(OHLC)的 Candle Data HTTP Exporter 搭配使用,即可获得市场分析所需的完整数据集。 功能 将 Tick 数据发送到预先配置的外部 HTTP URL。 保证每一个 Tick 都能送达;发生中断时,可从最后发送的 Tick 继续。 Tick 时间戳偏移量(offset)提供两种存储方式: 本地文件(默认,自动管理) 您服务器上的 HTTP 地址(用于与应用程序集成) HTTP 请求失败时自动重试,确保 Tick 可靠送达。 按可配置的批次大小传输数
FREE

FoxBuddy MT5 是一个免费的 MetaTrader 5 图表视觉伙伴。
它会在图表上显示一只可爱的动态小狐狸,为您的交易界面增加一些趣味。
FoxBuddy 可以: • 眨眼; • 轻微上下移动; • 摇动尾巴; • 通过可选的 Glide 模式在固定位置附近缓慢移动。
您可以调整: • 图表位置; • 大小; • 动画速度; • 透明度; • 开启或关闭动画; • 开启或关闭 Glide 移动。
FoxBuddy 的设计目标是轻量且不干扰图表分析。
重要说明: FoxBuddy 只是一个装饰性指标。
它不会提供交易信号。 不会开仓。 不会平仓。 不会修改订单。
无需 DLL。 无需 WebRequest。 无需外部服务器。 无需外部文件。
狐狸由指标使用 MetaTrader 5 原生功能直接绘制。
一个让长时间看盘更加轻松有趣的小伙伴。
FREE
Easy to use EA designed to auto trade. Works in every market condition. It uses reliable levels of MACD indicator combined with unique logic to perform fully automatic trading operations. *For MT4 version please go here! *If you don't like automated system and only need an alert system to help you in trading. Please check this arrow with alert system here!
FEATURES: Dangerous methods like martingale, hedge, grid or scalping are NOT used. Each position has Stop Loss and Take Profit. Positional
FREE

Description (English): Trend Test by Subho – Advanced Trend & Step Channel System Trend Test by Subho is a powerful all-in-one trend trading system designed to filter noise and provide clear market direction. This indicator combines two sophisticated algorithms: the Trend Test () and the Subho Step Channel into a single chart overlay. It also features a stylish Live Dashboard that alerts you to the current trend status in real-time. Key Features: Trend Test () Logic: An advanced tr
FREE

这是一款专为手动交易者设计的MT5工具。解决了MT5回测只能跑EA自动交易无法手动回测的问题。它通过图形化按钮(Buy / Sell / Close All)让您在图表上快速开平仓,并 自动记录每一笔交易 ,实时计算 胜率、盈亏比、平均盈亏、最大回撤、当前权益 等专业数据,将您的交易行为转化为直观的绩效报告。它将是您不可或缺的辅助利器。
1. 一键交易,操作流畅 Buy / Sell / Close All 按钮 2. 实时交易记录与图表标记 自动绘制买卖箭头 :开仓时在K线图上生成绿色向上(买)或红色向下(卖)箭头,复盘时一目了然。 3. 专业绩效统计面板 完整交易明细 :总交易次数、盈利次数、亏损次数。 胜率 & 盈亏比 :自动计算胜率百分比、平均盈利、平均亏损、盈亏比。 资金管理指标 :总盈利、总亏损、净利润、当前权益、虚拟余额。 风险控制 :基于虚拟余额与浮动盈亏计算最大回撤(金额与百分比),帮助评估策略稳健性。
FREE

PROP VOLUME PROFILE
====================
Cumulative Volume Profile for MetaTrader 5
--------------------------------------------
Prop Volume Profile shows you where price has spent the most time and
volume over the selected period - directly on your chart, in a clean
vertical profile on the right edge.
One glance tells you the "fair value" zone, the strongest price level,
and whether the current price is stretched far above or below where
the market actually trades.
HIGHLIGHTS
----------
-
FREE

This bot uses two CCI indicators one slow and the other fast. Then there is a moving average to determine the trend (if price is above moving average then its an up trend ). If a signal is to be produced in the opposite direction of the current open trade then it closes and reverses the type of trade. An ATR indicator is used for better stop loss and take profit placement. There is a trailing stop function. This robot can be used in the H1 timeframe , other time frames should work though you wil
FREE

"Five Minute Drive" indicator that is designed to be used in the 5 minute timeframe only. One of its most important advantages is that it shows the general trend in the upper time frames when looking at the 5-minute timeframe. Therefore, when opening positions in the 5 minute timeframe, when it is in line with the trends in the upper timeframes, you are less likely to be upside down. If you can interpret the curvilinear and linear lines drawn by this indicator on the graphic screen with your geo
FREE

Fibonacci Bollinger Bands (FBB) Indicator - User Manual 1. Introduction Fibonacci Bollinger Bands (FBB) is a technical analysis indicator that combines three tools: Bollinger Bands , Fibonacci Ratios , and the Volume-Weighted Moving Average (VWMA) . The purpose of this indicator is to provide a multi-dimensional view of the market by helping to identify: Dynamic support and resistance zones. The general market trend. Volatility levels and potential accumulation phases (squeezes). Price breakouts
FREE
Hi Traders, The Volume Spike Alert Indicator is a lightweight, non-lagging tool designed to help traders identify unusual volume activity in real time. This indicator calculates the average tick volume over a user-defined number of previous bars and compares it with the current candle’s volume. When the current volume exceeds the average by a specified percentage, the indicator triggers alerts, allowing traders to quickly spot potential breakouts, institutional activity, or strong market interes
FREE

INTRODUCING MML Data Bridge The demand for bridging external data and machine learning with trading platforms is higher than ever. MetaTrader 5 is a powerful environment for trading and back testing, but without a data bridge, MT5 is largely isolated from using any external data. MML Bridge is a developer tool that allows users to bridge external data into MT5 for back testing, live trading, and optimization. It's built for ease of use, providing users with a simple function API that drip-feeds
FREE
> Elevate Your Trading Strategy This free tool is just the beginning. At code4trading , we specialize in developing high-performance indicators and Expert Advisors designed for precision and professional-grade analysis. Looking for more advanced features? Discover our full suite of premium tools, including optimized signals, advanced oscillators, and institutional-grade trading utilities at our official MQL5 store. > Explore the full catalog here: https://www.mql5.com/en/users/pablogx9
FREE

核心定位 专为 MT5 平台打造的轻量化风险测算工具,聚焦交易员日常风控测算核心需求,深度优化操作体验与数据展示效果,适配日内交易、波段交易等各类看盘交易场景,是交易员日常风控操作的高实用性辅助工具。 核心功能 手数便捷编辑:点击输入框可直接录入数值,无需提前选中,一步到位告别传统繁琐的编辑流程,提升操作效率。 实时动态测算:支持自由拖拽入场 / 止损线,系统即时精准计算价差、对应风险金额,测算结果实时同步更新,精准反馈每笔交易的实际风险敞口。 数据清晰展示:针对性修复换行乱码漏洞,将价差、风险金额等关键风控数据分行清晰呈现,让核心数据阅读更直观,避免信息混乱影响交易判断。 面板自定义布局:配备可拖拽面板,支持交易员根据自身看盘习惯、屏幕尺寸自由调整面板位置与布局,兼顾操作灵活性与使用舒适度。 核心价值 全方位提升风险测算效率,为交易决策提供精准、高效、实时的风险数据支撑,可无缝衔接各类交易策略的风控测算需求,助力交易员做好事前风险把控。
FREE

Server Timer
Version: 1.2 The Server Time Clock Indicator is a lightweight and visually appealing tool for displaying the server's current date and time directly on the chart. This indicator updates dynamically every second and provides the following features: Customizable Appearance : Adjust font color, background color, and font size to match your chart's theme. Day and Time Display : Shows the current day, date, and time in an easy-to-read format ( Day{MM/DD} HH:MM:SS ). No Performance Over
FREE
MultiFrame MA: A Multi-Timeframe Trend Indicator MultiFrame MA is a trend analysis indicator designed to provide a comprehensive market overview across various timeframes. Instead of relying on a single timeframe, this tool synthesizes information from multiple charts, giving users a holistic and reliable perspective. KEY FEATURES: Multi-Timeframe Analysis: The indicator analyzes data from various timeframes, from M1 up to Monthly, to help users identify trend confluence at different levels. MA
FREE
适用于 MetaTrader 5 (MT5) 的 UZFX - 仅删除挂单脚本是一款简单而有效的工具,可自动删除交易账户中的所有挂单(限价买入、限价卖出、止损买入、止损卖出)。该脚本非常适合希望在不影响活跃市场头寸的情况下即时清除挂单的交易者。
查看我的所有其他 MT4/MT5 指标和 EA >> 这里 功能: 删除所有挂单(买入限价单、卖出限价单、买入止损单、卖出止损单)。 不影响未结市场头寸。 通过专家选项卡提供实时执行反馈。 帮助交易者快速重置挂单策略,无需手动干预。 使用方法: 将脚本附加到 MT5 图表。 脚本将自动扫描并删除所有挂单。 注意: 该脚本不会关闭有效交易,只会删除挂单。 运行脚本前,请确保您要删除所有挂单。 它适用于账户中的所有交易符号,而不仅仅是所附图表。 开发者: UZFX-LABS Version: 1.00 Year: 2025
下载 mt4 脚本 : 133840
FREE

>> Announcements Channel << DiverX is a powerful and versatile divergence indicator developed for the MetaTrader 5 platform. It detects both Regular and Hidden Divergences based on five popular technical indicators: RSI (Relative Strength Index) , RVI (Relative Vigor Index) , Stochastic Oscillator, CCI (Commodity Channel Index) , and MACD (Moving Average Convergence Divergence) and ATR Plus (author’s proprietary indicator, product page >> ) . The indicator plots results directly on the main c
FREE

This indicator displays volume delta (of either tick volume or real volume) encoded in a custom symbol, generated by special expert advisers, such as RenkoFromRealTicks . MetaTrader does not allow negative values in the volumes, this is why we need to encode deltas in a special way, and then use CustomVolumeDelta indicator to decode and display the deltas. This indicator is applicable only for custom instruments generated in appropriate way (with signed volumes encoded). It makes no sense to ap
FREE

This indicator will show a vertical representation of the volume distribution within a selected user range.
This is a free version of the full product. It is limited to use on a week old data or older. Find the full product at https://www.mql5.com/en/market/product/42234 .
Main features: This Indicator will create an image that will allow viewing the tick volume per price level in a graphical form. The indicator will work on any range size in any time-frame, limited only by your computer mem
FREE

TSD-47 RSI Matrix TSD47 RSI Matrix is a tactical multi-timeframe momentum dashboard designed to provide instant RSI and trend-strength awareness across multiple market structures. The indicator combines: 1 Minute RSI 5 Minute RSI 15 Minute RSI ADX Trend Strength Analysis inside a compact tactical dashboard interface built for modern traders. The goal of the dashboard is to simplify momentum analysis and help traders quickly identify: bullish pressure, bearish pressure, momentum alignment, and o
FREE

ORTHRUS EA - The Strategic Multi-Head Guardian Professional XAUUSD H1 Trading System for MetaTrader 5 SETFILES (USE THEM IF YOU WANT THE BOT TO WORK WELL):
LOW RISK: https://www.mediafire.com/file/j3isfycnt3fzzyv/LOW +RISK.set/file HIGHER RISK: https://www.mediafire.com/file/uir2zr6fwmknwm0/HIGHER +RISK.set/file INTELLIGENT TRADING, NOT GAMBLING ORTHRUS EA is not another high-frequency robot flooding the market with hundreds of trades. This is a precision-engineered trading system wher
FREE
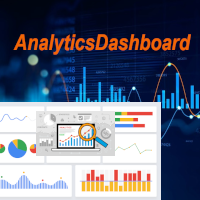
分析仪表盘是一个指标,用于分析您过去和当前的交易,并生成分析仪表盘,您可以通过附加的饼图查看详细信息。
主要考虑四类分析:1)业绩指标;2)交易行为指标;3)执行质量指标;4)持仓水平指标。
这四项通用分析指标已进一步细分为以下更具体的指标。
业绩指标: 毛利润 毛亏损 总盈利因子 总预期收益 总胜率 平均风险回报比 最大回撤 最大涨幅
所有这些指标均以图表形式显示,并借助饼图进行展示。
交易行为指标: 总交易次数 总盈利次数 总亏损次数 平均持仓时间 平均交易规模 触发止损的交易次数 触发止盈的交易次数 手动止损次数
除平均交易规模外,其他指标均以图表形式显示。
执行质量指标: 平均滑点 平均入场点差 平均出场点差 总佣金+隔夜利息 对毛利润的影响 对毛亏损的影响
这些指标以饼图形式呈现,方便进行图表细分。滑点和点差需要历史数据才能计算,因此如果您需要所有指标的准确性,则需要在策略测试器中运行图表,以便下载历史数据。
持仓层面指标: 未平仓头寸总数 未平仓盈利总数 未平仓亏损总数
FREE

Climax Hunter Inspired by volume climax theory and liquidity behavior, Climax Hunter highlights potential turning points where the market is likely to begin price manipulation as well as the potential to reverse or pause manipulation. Key Features Helps identify manipulation zones of institutions and sharks Filters out false breakout signals and stop-hunt trades Detects Buying Climax (Market Top) Detects Selling Climax (Market Bottom) Works on all timeframes Operates on Forex, Gold, Indi
FREE
Description (English) EMA 5-20-200 Cross Alerts (Fixed Alerts, No Repaint) This indicator combines three popular EMAs (5, 20, and 200) to help traders identify short-term, mid-term, and long-term trends.
With visual arrows on the chart and automatic alerts (popup & push notification) , it allows traders to catch entries and trend confirmations without constantly monitoring the screen. Key Features: Plots EMA 5, EMA 20, and EMA 200 directly on the chart. Generates Buy/Sell signals (EMA5 vs
FREE

Indicador ROC (Rate of Change) para MT5 Descrição O indicador ROC (Rate of Change) é uma ferramenta essencial para análise de momentum no mercado. Ele mede a variação percentual do preço em relação a um período anterior, fornecendo insights valiosos sobre a força e velocidade dos movimentos de preço. Esta versão personalizada para MetaTrader 5 oferece recursos avançados de visualização e alerta, com múltiplas opções de personalização para atender às suas necessidades específicas de trading. Cara
FREE

Trading Cockpit is a free, complete trading control panel for MetaTrader 5: watchlists, price & trend alerts, and automatic liquidity levels, all in one compact side panel without leaving your chart. Try everything at no cost.
WATCHLISTS & SYMBOL BASKETS - Unlimited symbols across several lists in one dropdown selector: a live mirror of your Market Watch, a Favorites list, and your own custom lists. - Predefined baskets by correlation cluster - US, Europe, Forex, Metals, Energy, Crypto - that w
FREE

The SyntheticaFX Zones Indicator simplifies the process of identifying key levels in the market where price reversals are likely to occur. By incorporating this tool into their trading strategies, traders can improve their decision-making, enhance risk management, and ultimately increase their chances of success in the financial markets. However, like all technical indicators, it should be used in conjunction with other analysis methods and not relied upon as the sole basis for trading decisions
FREE

Close All Charts 是一款实用工具,旨在快速、方便地关闭MetaTrader 5(MT5)平台中的所有打开图表。对于同时处理大量工具和图表的交易者,以及那些喜欢保持工作空间整洁的人来说,它尤其有用。 在策略测试器中测试顾问时,使用不同的参数经常会打开很多图表。 Close All Charts 工具能够在短短1秒钟内关闭它们,从而避免了手动关闭每个图表的麻烦。 让我们考虑一个例子:如果您打开了100个图表,手动关闭每个图表可能需要相当长的时间。假设关闭一个图表需要大约1秒钟。因此,手动关闭100个图表将需要大约100秒或超过1分钟。而使用我们的 "Close All Charts" 工具,只需1秒钟即可完成! 如果我们的 Close All Charts 工具对您有帮助,请您评估并留下反馈,这对我们来说非常重要!您的反馈帮助我们为交易者创造更高质量的工具。 订阅我们的频道 !在这里,您将找到详细的顾问和指标评论、最新的交易策略以及来自经验丰富的交易者的有用建议。加入我们的社区,成为更自信的交易者!
FREE

真正杀死挑战的是日内亏损,不是盈利目标。一次过度杠杆的夜晚、一个被遗忘的挂单、一次跳空。
PropFirm Shield Essential 是免费的守卫,守住最重要的规则——在违规前锁定账户。
挂载任何图表,监控全账户:所有品种、magic、手动、跟单、其他 EA。
- 日内亏损守卫 — 你的限额和重置时间。 - 锁定 — 平仓、删挂单、重置前禁新仓。 - 缓冲 — 限额前触发。 - 看门狗 — 无行情仍监控。 - 状态显示 — 净值、日内盈亏、下限、重置。 - 状态持久化。
为何免费? 完整的日内亏损引擎,不是残缺的演示。
付费版 PropFirm Shield 增加:最大亏损(静态+移动)、预设、AUTO-SL、盈利锁定、PANIC 按钮、最少交易日、最坏净值、面板、推送。
先模拟测试。管理规则违规的工具,不是交易系统。
FREE

Price tells a story, but volume tells the truth. Volume Truth is a visual analysis tool that reads the relationship between price and volume to reveal what institutions are doing behind the move — accumulating, distributing, or stepping aside. It does not just plot volume bars; it interprets them. [b]The four price/volume states[/b] Price up + volume up = institutional accumulation (bullish conviction) Price up + volume down = weak rally, no conviction, prone to reverse Price down + volume up =
FREE
欢迎使用 KMeans Price Zones Detector,这是一款创新的 MetaTrader 指标,利用机器学习的强大功能来识别关键的价格区间。该工具使用 KMeans 聚类算法动态检测价格数据中的中心点,突出显示价格更可能遇到支撑、阻力或整合的区域。 创新的 KMeans 算法 KMeans Price Zones Detector 之所以出众,是因为它先进地使用了 KMeans 聚类算法,这是一种在模式识别中以其效率和准确性而著称的机器学习技术。通过分析历史价格数据,指标识别代表显著价格水平的集群或中心点。然后利用这些中心点计算支撑和阻力区,为交易者提供关于潜在价格反转、突破和整合的重要信息。 主要特点 动态区域检测: 指标根据最新的市场数据不断更新价格区域,确保交易者始终掌握最相关的信息。 适用于所有时间框架: 无论您是在 1 分钟图表上进行短线交易还是在日线图表上进行长期投资,KMeans Price Zones Detector 都能无缝适应,提供准确的区域检测。 兼容所有外汇对: 该指标设计用于任何外汇对,为交易多种货币的交易者提供了灵活性和多功能性。 全面的 A
FREE

UZFX FTMO Guardian PRO 是一款专业的 MetaTrader 5 账户监控指标,旨在帮助交易者安全地完成 FTMO 挑战,并自信地管理受托账户。
与专家顾问不同,该工具不会执行、修改或平仓交易。它作为实时交易助手,在您进行手动交易时持续监控您的账户,并计算每一项重要的 FTMO 规则。
仪表盘将所有关键账户统计数据集中展示,包括余额、净值、浮动盈亏、已平仓盈利、日盈利、总盈利、当前回撤、剩余回撤、盈利目标进度、交易天数以及整体挑战健康状况。
该指标自动支持:
FTMO 两步标准模式 FTMO 两步波动模式 FTMO 一步挑战模式 它持续计算:
日回撤 最大回撤 静态回撤 追踪回撤(1步挑战) 盈利目标进度 剩余所需盈利 剩余每日亏损容许值 剩余最大回撤 已完成交易日 当前挑战状态 智能预警系统会在违规发生前提供实时通知。当交易者接近每日回撤限额、最大回撤限额、盈利目标或出现危险的浮亏时,系统会发出警报,使其能在违反挑战规则前采取行动。
仪表盘还提供了重要 FTMO 交易条件的快速参考,包括:
新闻交易规则 周末持仓规则 隔夜持仓规则 一致性要求 当前挑
FREE

PGSindicator for MetaTrader 5 Free Companion Indicator for Profit Guard System Trade Panel. *** The attached video is the " PGS Trade Panel Tutorial Part 1 " *** (4m video) Adjust >>> **** EMA1 N-Pips Separation from EMA2
This setting defines the minimum distance required between EMA1 and EMA2 before a trend condition is considered valid.
The default value is 100.0 pips for NASDAQ 100, 1 minute CHART . Depending on how your broker calculates pip values, you may adjust this to 20.0 or 10.0
FREE

The ONLY RSI Indicator You'll Ever Need - Works with ANY Broker, ANY Symbol! Finally, an RSI indicator that automatically adapts to YOUR broker's symbol naming conventions! Whether you trade Forex, Gold, Bitcoin, or Stock Indices - this universal indicator detects and monitors related symbols automatically. KEY FEATURES & BENEFITS UNIVERSAL COMPATIBILITY Auto-Detects Broker Patterns : Works with ANY broker suffix (.m, .pro, .raw, etc.) All Asset Classes : Forex, Metals (Gold/Silver), Crypto,
FREE

The ZigZag SMC/SMT Indicator for MT5 is the ideal tool for traders who want to accurately identify tops and bottoms based on the advanced concepts of Smart Money Concepts (SMC) and Smart Money Trap (SMT).
Main Benefits: Automatic identification of strategic tops and bottoms. Based on concepts used by institutional traders. Ideal for analyzing liquidity, market structure and manipulation. Simple to use: just add it to the chart and track the critical points.
️ Free Version: This ve
FREE
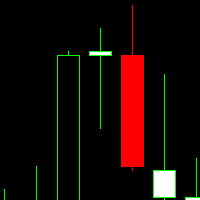
This indicator is a volume indicator it changes the color of the candles according to a certain number of ticks, and this number of ticks can be informed by the user both the number of ticks and the color of the candles, this indicator works in any graphical time or any asset, provided that the asset has a ticker number to be informed.
This indicator seeks to facilitate user viewing when analyzing candles with a certain number of ticks.
FREE

当每一秒都至关重要时的极速操作 这款交易面板最初就是为 自定义用户图表 而设计的,包括 秒级时间周期图表 。
它能够 自动识别自定义图表背后的真实交易品种 ,并直接对该真实品种执行交易—— 无需手动绑定,也不需要任何额外操作 。 这款面板只解决一个核心问题:
缩短“做出决定”和“执行操作”之间的距离。 没有多余的窗口
没有确认弹窗
不需要频繁切换界面 极速入场 面板将最关键的交易操作直接集成在图表上: Buy / Sell —— 一键市价开仓 LIMIT —— 无弹窗设置限价订单 点击按钮,操作立即执行。
无需在菜单中查找选项,也不会分散你对图表的注意力。 直接在图表上设置 SL / TP 设置止损或止盈非常直观: 只需点击开仓线,拖动出现的辅助线到目标位置,即可完成 SL / TP 设置。 无需手动输入数值。
你看到的价格位置,就是你设置的价格。 高效的限价订单操作 设置挂单只需两步: 点击 LIMIT 按钮 将出现的价格线拖动到目标水平 订单以 视觉化方式 完成设置,就像你在图表中规划交易一样自然。 在行情快速波动、来不及精确填写参数窗口时,这一点尤为重要。 画面干净,不干扰分析
FREE

GOM Trade Manager helps you execute trades the way you want it. Works on all instruments Forex, Commodities, & Crypto.
It helps you with lot calculations, spread addition and balance calculations so you can just focus on actual trading.
For full automatic planned management, stackable triggers and spread widening protection >> check out GOM Trade Manager Pro .
------------------------------------------NOTABLE FEATURES------------------------------------------ You set everything based on bid
FREE

This EA generates custom Line Break charts on a separate symbol using the following input settings: 1. LineBreak input int LineBreak = 3; Use: Defines the number of lines required for a reversal (e.g., 3-line break chart). Set to 1: For 1-line break charts (more responsive). Higher values: Create smoother, trend-following charts. 2. StartDate input datetime StartDate = D'2025.03.01';s Use: Specifies the date from which historical data should be loaded and processed. 3. LineBreakTime input bool L
FREE

TK - Rainbow 指标 描述: TK - Rainbow 指标是一个强大的技术分析工具,旨在通过多条线的方式提供市场趋势的清晰视图。通过30条计算不同周期的线,它提供了广泛的价格运动分析。该指标使用双色方案来突出显示上升和下降趋势,使市场状况一目了然。 主要特点: 30条线: 每条线代表不同的平滑周期,以涵盖广泛的市场趋势。 双色方案: 使用两种颜色区分上升(冷色)和下降(暖色)趋势。 可定制设置: 调整线宽、样式和步长以适应您的交易偏好。 如何使用 TK - Rainbow: 应用指标: 从 MetaTrader 5 的指标列表中将 TK - Rainbow 指标添加到您的图表中。 配置参数: 步长 (inpStep): 定义每条线之间的周期增量。调整此设置以设置线条间距。 价格 (inpPrice): 选择用于计算的价格类型(例如,收盘、开盘、最高、最低)。 线宽 (inpLinesWidth): 设置线条的厚度以提高清晰度。 线样式 (inpLinesStyle): 选择线条的样式(例如,实线、虚线)。 解读颜色: 上升趋势: 冷色(蓝色)的线条表示上升趋势。 下降趋势:
FREE

The Moving Averages On-Off let you control the indicator using the keyboard or a button . You can choose if you want the indicator always shown or always hided while switching among different time frames or financial instruments . ---> This indicator is part of Combo Indicator OnOff
It's possible to setup three Moving Averages : Short , Medium , Long
Input You can customize the price type used for calculation : close, open, high, low, median price, typical price, weighted It's
FREE

在全球市场(如外汇、指数和大宗商品)交易需要高度关注时间。然而,MetaTrader 5 原生仅显示您经纪商的服务器时间,迫使交易者不断进行心算,才能知道自己电脑上的准确时间。
Pinpoint Local Time 以优雅且集成的方式解决了这个问题。它在图表底部添加了一个辅助的超紧凑时间刻度(标尺),与市场历史同步运行,显示每根 K 线形成时的准确本地时间。
该指标以高性能和可视化交易为重点开发,遵循 MT5 的标准视觉风格,不会使您的屏幕变得杂乱,并让您专注于真正重要的事情:价格。
主要特色与功能 动态同步:本地时区标尺完美跟随市场历史滚动、放大/缩小以及时间周期变化。
️ 十字线集成(十字线工具 - Ctrl+F):该指标会检测您光标或十字线工具在屏幕任意位置的位置,并显示带有优雅边框的工具提示,指出 X 轴上该点的准确本地日期和时间。
可通过面板配置高度:避免 MT5 窗口锁定/冻结问题。通过在输入参数中输入所需值,以像素为单位精确、直接地调整标尺高度。
可自定义日期和时间格式:通过快捷菜单选择您希望查看信息的方式:
日期:DD/
FREE

Kalman Forecast Helper is an advanced MQL5 Expert Advisor component designed to generate adaptive market forecasts, trend predictions, and trading signals for FX and other financial time series. Powered by a proprietary Kalman filtering engine, the helper continuously analyzes incoming market data and delivers actionable forecast information that can be integrated directly into Expert Advisors, indicators, or quantitative trading systems. After each update, the helper provides: Multi-horizon for
FREE

the AK CAP toolbox free to use;
it includes the same indicators we use for our daily trading and we think the simpler the better. Lightweight indicator for use on all timeframes. that includes VWAP with vwap value indicator on top right. 3 EMA: FAST, MEDIUM, SLOW the candle timer to show how much time left in a candle.
colors and positions are fully customizable.
enjoy
FREE

。。。。。。。。。。。。。。。。。。。。。。。。。。。。。。。。。。。。。。。。。。。 This indicator is based on Bollinger Bands indicator. It helps user clearly know the Band is expand or contract.
The method of use is the same as the traditional Brin channel index. Users can use different color areas to distribute forest channel indicators in expansion or contraction stage. -------------------------------------------------------------------------------------------
FREE

Neural Levels Indicator – Precise AI-Based Market Levels Unlock next-level trading precision with the Neural Levels Indicator, a powerful market analysis tool built on advanced price-action principles and inspired by cutting-edge neural networks. Instantly identify three key neural trading levels directly on your chart:
Neural Level 1 Purpose: Crucial equilibrium level, ideal for identifying market balance points and potential turning zones.
Neural Level 2 (Optimal Entry) Purpose: Indicates p
FREE
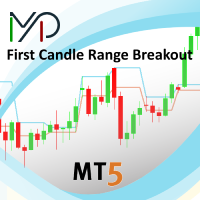
This creative simple indicator will provide a precise framework for market sentiment within technical analysis of different timeframes. For instance, for traders like me that uses "Mark Fisher" strategy regularly, this is a perfect indicator for having an insight to markets from short term to long term point of view, using Break points of candles' lows and highs and perfect to combine with "Price Action" . For more options and modifications you can also edit the low timeframe candles withi
FREE

Manual Trading Assistant is a professional EA designed for manual traders who want institutional-level trade management without losing control. This tool does NOT open trades automatically - you remain in full control of your entries. Once you open a position manually, the EA takes over with advanced features: automatic TP/SL placement based on ATR or fixed pips, dynamic trailing stop that adapts to volatility, break even protection to eliminate risk after initial profit , partial close
FREE

Coasyn FX Position Size Calculator Professional Forex Risk & Position Size Calculator for MetaTrader 5 Every professional trade begins with one question: How much should I risk? Coasyn FX Position Size Calculator provides a fast, accurate, and structured way to calculate position size before placing a trade. Designed for discretionary Forex traders, the panel converts your account size, risk percentage, entry price, and stop-loss distance into a precise position size in real time. Instead of rel
FREE

PipVenom - Advanced ATR Trailing Stop Signal Indicator for MT5 Professional Visual Trading System with Real-Time Dashboard OVERVIEW PipVenom is a sophisticated visual trading indicator designed for MT5 that combines ATR Trailing Stop methodology with EMA crossover signals to identify high-probability trade entries. Built with precision and clarity in mind, this indicator provides crystal-clear visual signals with automatic Stop Loss and Take Profit levels displayed directly on your chart. P
FREE

QuantumAlgo Basic Indicator — MetaTrader 5 多功能市场信息指标 QuantumAlgo Basic Indicator 是 MetaTrader 5 的专业 多用途指标 。将您的终端转变为信息丰富的工作站,提供实时市场数据、波动率计时和关键机构级别。 为什么交易者选择 QuantumAlgo Basic Indicator 简洁专业界面 — 适合白色背景的 Glassmorphism 设计 实时市场情报 波动率显示 每日机构级别(PDH、PDL、Pivot、Open) 交易时段及当前时段高亮 点差及品种信息 账户净值、余额和当日盈亏 轻量级 — 不影响图表性能 适用于任何品种 兼容任何时间框架 核心功能 Time Context — 当前与下一个时段、倒计时 波动率显示 — 点差、ATR、当日区间 机构级别 — PDH/PDL、Daily Open、Pivot 账户快照 可定制显示 明暗主题 推荐设置 平台: MetaTrader 5 品种: 任意 时间框架: 任意 VPS: 不需要 设置: 默认 ️ 重要 — 防诈骗 本指标 仅通过 MQL
FREE

English Description Title: Chart Cleaner (Eye Tool) Subtitle: Clean your charts instantly with 1 click while preserving your technical analysis. Inspired by TradingView's eye tool. Description: Have you ever wanted to look at clean price action without cluttering your chart with trendlines, support/resistance levels, and Fibonacci studies? Deleting and redrawing everything takes too much time. Chart Cleaner (Eye Tool) is designed to solve this exact problem. Featuring a minimalist design—a small
FREE
This indicator is a sophisticated MetaTrader 5 tool that calculates and displays Average Daily Range (ADR) levels on your chart. It draws horizontal lines representing expected price movement ranges based on historical daily volatility, helping traders identify potential daily high and low targets. ADR (Average Daily Range) = The average difference between the daily high and low over a specified period (default: 14 days). Unlike ATR which includes gaps between days, ADR focuses purely on int
FREE
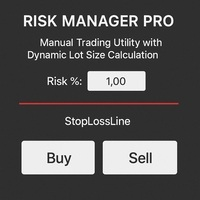
Risk Manager PRO – Manual Trading Utility with Dynamic Lot Size Calculation
Risk Manager PRO is a powerful yet simple utility for manual traders. It allows you to enter trades with calculated lot sizes based on your specified risk percentage and a visual stop-loss line. Just drag the red stop line to your desired level, input the risk %, and click Buy or Sell. Ideal for traders who want precise risk control without complex calculations.
Features:
Dynamic lot size calculation
Visual stop-lo
FREE

具有多时间框架支持、可自定义视觉信号和可配置警报系统的平均趋向指数(ADX)指标。
免费编程服务、更新及其他 TrueTL 产品请访问 MQL5 个人主页 。
非常感谢您的反馈和评价!
什么是 ADX? 平均趋向指数(ADX)由 J. Welles Wilder 开发,是一种技术指标,用于衡量趋势的强度,而不考虑其方向。ADX 由正向指标(+DI)和负向指标(-DI)衍生而来,但只显示强度,不显示方向。 ADX 值介于 0 到 100 之间。一般来说,低于 20–25 的值表示趋势弱或无趋势(横盘市场),而高于 25 的值则表示趋势强劲。超过 50 的值表示趋势非常强劲。ADX 在识别市场是处于趋势还是横盘整理阶段时特别有用,帮助交易者决定采用趋势跟踪策略还是区间交易策略。与方向性指标不同,无论是上涨趋势还是下跌趋势增强,ADX 均会上升。 功能特点: 带箭头标记和垂直线的视觉信号标记 具有可配置触发条件的三个独立信号缓冲区 信号检测选项:方向变化、水平线穿越、峰值/谷值 每个信号可配置警报功能(邮件、推送、声音、弹窗) 支持插值方法的多时间框架(MTF)功能 直方图或折线绘制模
FREE
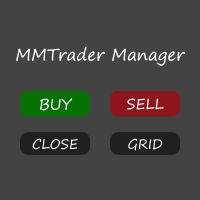
Welcome to my MMTrader Manager product. EA that allows You for simple managing trades and positions. Key Features: Position Opening – Open trades quickly with customizable Take Profit (TP), Stop Loss (SL), and lot size settings. Position Closing – Close trades with one click. Grid System – Automatically create a grid of orders. Recovery Mode – Loss recovery lot calculation. Trade History Data – Acces data to historical positions. User-Friendly Interface – A clear and simple panel designed. This
FREE

Indicador Multiple Regression Indicador faz o plot da Curva de Retorno e dos canais superior e inferior de uma regressão para os preços de fechamento do ativo do gráfico. A Curva de Retorno é a linha central do indicador e representa a região de equilíbrio do preço entre vendedores e compradores. Nesse indicador o usuário escolhe o tipo da regressão podendo ser de 3 tipos: primeiro grau, segundo grau ou terceiro grau. Os plots do indicador são: Linha central – cor padrão preta; Linha superi
FREE

IMPORTANT NOTE: This is a professional Trade Management Utility and on-chart assistant. It is NOT an automated trading robot. It does not open trades on its own. The UltraFast Trade Manager MT5 is the ultimate execution and risk-management suite designed to give you absolute control over your manual and algorithmic trades. When managing multiple positions, calculating complex net break-even points, or constantly monitoring the economic calendar, hesitation can lead to costly mistakes. This utili
FREE

Wormhole 时间框架指标对于 MetaTrader 5 (MT5) 不仅仅是另一个交易工具——它是您在金融市场中的竞争优势。它专为初学者和专业交易者设计,Wormhole 改变了您分析数据和做出决策的方式,确保您始终领先一步。 为什么您需要(免费)Wormhole 指标 超越竞争对手: 能够在同一图表上同时查看两个时间框架意味着您总是领先一步。再也不用在图表之间切换,一切所需尽在眼前。 解锁隐藏的机会: 通过改变传统的时间框架,发现其他交易者忽略的模式,将 5 分钟图表的边界从 00:00 到 00:05 调整为 00:01 到 00:06。这些微小的变化可能揭示独特的市场动态。 获得可操作的洞察: 使用精确的工具检测趋势、反转和支撑/阻力水平,Wormhole 为您提供信心,使您能够做出明智的交易决策。 经过验证的创新 Wormhole 并非凭空猜测,而是先进研究的成果: 使用机器学习分析市场低效性。 识别零售交易群体,揭示隐藏的市场动态。 这些见解推动了该指标的开发,体现了专业级策略。 Wormhole 如何赋能您 更快的决策: 实时数据使您领先市场动态。 终极多样性: 无论
FREE
学习如何在MetaTrader AppStore上购买EA交易,MetaTrader平台的应用程序商店。
MQL5.community支付系统支持通过PayPay、银行卡和热门付款系统进行交易。为更好的客户体验我们强烈建议您在购买前测试EA交易。
