适用于MetaTrader 4的免费EA交易和指标 - 16

淫妖是一个普遍的专家顾问。
它的主要优点是最高的输入精度,90%的交易及以上。
专家顾问参数根据用户需要的功能分为类别。 所有功能都可以禁用。
Ea交易旨在分散中小型存款。
主:
TakeProfit-以盈利结束交易的点数
止损-关闭亏损交易的点数
滑点-滑点
魔术顾问ID
手数-交易量
动态手数设置:
动态-启用/禁用事务量的动态计算
风险-风险系数。
布洛克马丁*盖尔经典 每个方向一次只能开一笔交易。 在亏损的情况下,下一个交易将是一个交易量乘数。
马丁-启用/禁用鞅
乘数马丁-手数乘数
淫妖专家顾问也可以构建网格。
Setka-启用/禁用网格
距离Setka-网格中订单之间的距离
乘数Setka-乘数
当然,不是没有顾问拖网的存在。 如果需要,您可以启用它,如果你不使用网格。
智能止损
智能步停止-束缚步
有一个按时交易的功能。 如果00:00和23:59被设置为默认值,则禁用它。
开始-交易开始时间
交易结束
交易之间的停顿是必要的,这样当我们收到一个信号时,我们只交易一次
FREE
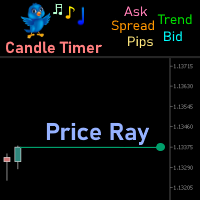
Price Ray indicator is a utility that will improve the way you trade. Primarily, it shows the Bid, Ask or Last price as a line ray which beams till the current candle, last visible chart candle or extended to all candle bars. The enhanced features in this indicator provide information in an area where you focus most, right next to the current candle. You can select text to be shown above or below the Price ray. The indicator is fully customizable, allowing it to fit any strategy requirements. Th
FREE

The Awesome Oscillator (AO) Signal Candle Indicator is an indicator used to measure market momentum. Awesome Oscillator (AO) Signal Candle Indicator will change bar's color when set overbought or oversold levels reach. Colored Candles, based on Awesome Oscillator (AO) Signal.
-If the indicator is above zero, the market is bullish. -If the indicator is below zero, the market is bearish. -If the market is bullish, you can take a stand with green candle signals. -If the market is bearish,
FREE

All traders should know the trend before making their decision when placing the buy or sell orders. The first step always starts with supply and demand , rising and falling channels , trend lines, engulfing candles etc. All the above contribute to what is called “Price Action” and that is the best and most reliable way in trading and catching the trend and making profits, without stress. The Investment Castle Trend Line Indicator will automatically draw the trend lines on the MT4 for you. An
FREE

Summary: This EA places a single trade at a time in a RANDOM direction (buy or sell) and uses a simple TP & SL. A lot multiplier is also optional. Once a trade hits TP/SL, it will place another trade in a random direction. And so on. Since it only ever has 1 trade open at a time, it can be used on any broker. Which means it can be used on US brokers with the FIFO rule. Inputs are few and everything is based in Points too. So it can be used on any chart reliably and easily. You will be amazed how
FREE

Moving Average Cloud draws 4 MAs on chart simultaneously in histogram style. Indicator uses 4 MAs: slow sma & ema 200 and fast sma & ema 50. the range between 2 slows MAs and Fasts, represented by histograms on the MAs boundaries - creating kind of "cloud" that can be traded by all kind of MA strategies like support & resistance or other... Change of color of the same histogram points to momentum changing.
Combined with other market analysis, can greatly improve trading results.
FREE

Bar Timer Percent 该指标以百分比形式显示当前柱形成的时间。
指标设置 color_back1 - 背景颜色 # 1 color_flat1 - 背景的边框颜色 #1 color_back2 - 背景颜色 # 2 Alert_Percent - 声音警报的百分比值 Sound_file - 声音文件的名称,自定义声音文件必须位于 Sound 文件夹下的终端文件夹中并具有扩展名 - .wav Bar Timer Percent 该指标以百分比形式显示当前柱形成的时间。
指标设置 color_back1 - 背景颜色 # 1 color_flat1 - 背景的边框颜色 #1 color_back2 - 背景颜色 # 2 Alert_Percent - 声音警报的百分比值 Sound_file - 声音文件的名称,自定义声音文件必须位于 Sound 文件夹下的终端文件夹中并具有扩展名 - .wav
FREE

Indicator draws Round Number lines by distance of pips. 1. You can enable / disable indicator to show / hide the lines. 2. You can set distance of pips between the lines. 3. You can edit the number of lines. 4. You can edit properties of lines by inputs (style (DASH, DOT, SOLID, ...) , width (1 for DASH, DOT, 2 is not for DASH, DOT, it only SOLID), color). When indicator is deleted from the chart, the lines will be removed.
FREE

QuantumAlert CCI Navigator is a free indicator available for MT4/MT5 platforms, its work is to provide "alerts" when the market is inside "overbought and oversold" regions in the form of "buy or sell" signals. This indicator comes with many customization options mentioned in the parameter section below, user can customise these parameters as needful. Join our MQL5 group , where we share important news and updates. You are also welcome to join our private channel as well, contact me for the pri
FREE
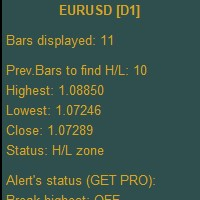
Higher Timeframe Chart Overlay will display higher timeframe candles, including the number of candles high/low you specify.
You no longer need to switch timeframes to check the candles. Everything can be shown in one chart. Get Full Version - https://www.mql5.com/en/market/product/115680 Please feel free Contact me if you have any questions regarding this tool.
FREE

交易量百分比线图 是一种旨在提供交易量数据见解的指标。它检索每根蜡烛的总交易量信息,并将其显示为总交易量的百分比。该指标在单独的窗口中将此数据显示为图表线,使用户可以轻松地将买家和卖家之间的战斗可视化。 该指标的主要特征之一是它能够将交易量百分比显示为图表线。通过代表买卖双方之间的交易量分布,它提供了对市场动态的宝贵见解。交易者可以根据显示的百分比快速评估买卖压力的相对强度。 该指标因其简单性和用户友好性而脱颖而出。它需要最少的参数配置,无需复杂调整即可轻松集成到交易策略中。在参数方面,用户可以指定绘制交易量线所需的时间段,让他们专注于特定的兴趣区间。 总体而言,成交量百分比线图为交易者提供了有价值的成交量分布可视化表示,使他们能够根据买卖双方之间的竞争做出明智的交易决策。
参数 体积参数 时间段 - 画线的时间段。
FREE

Variable Index Dynamic Average (VIDYA) developed by Tushar Chande by default is contained in MT5 but not in MT4 platform and it is a dynamic EMA (Exponential Moving Average) that adjusts its Length (LB Period) automatically in response to Market Volatility originally measured through the Chande Momentum Oscillator(CMO). CMO value is used as the ratio to the smoothing factor of EMA ( The New Technical Trader by Tushar Chande and Stanley Kroll, John Wiley and Sons, New York, 1994). The higher th
FREE

The Monday EA trades on Mondays depending on price movement on Fridays. Its aim is to take 10-20 points of profit and leave the market. This strategy works from March 2014. Currency pairs are EUR/USD and GBP/USD. For GBP / USD trading on the CCI indicator is recommended not to use Time frame is daily D1 Settings: Sig_Open1 = true; - if true, the EA trades on Mondays StartTime = "00:00"; time to start trading (applies only to "Sig_Open1")
Sig_Open2 = true; - enable only on EUR/USD (works only on
FREE

Euro Gift (EURUSD M15) I am celebrating my birthday, so i will publish some EAs for FREE. This EA has been developed for EURUSD M15. Strategy is based on ICHIMOKU indicator and has very little parameters - so its VERY ROBUST. It uses Stop pending orders with ATR Stop Loss . At 9:00 pm we are closing trading every Friday to prevent from weekly gaps. !!!Adjust these times to your broker time. Preset values are for UTC+2 only!!! For every candle the pending orders are modified to adapt the mar
FREE

EURUSD H1 Simple Martingale that works on daily swing levels, low DD, TP and SL defined on the basis of certain pre-set calculations in the algorithm, executes one trade at a time, weekly trading no overnight on weekends, possibility to establish customized exit times, possibility of customize money management. average return of 7.92% per year with the factory settings of the V1, it is always constantly updated, it is recommended to use it with a GMT +2 server TESTED SINCE 2003
Happy trading
FREE

O Touch VWAP é um indicador que permite calcular uma Média Ponderada por Volume (VWAP) apenas apertando a tecla 'w' no seu teclado e após clicando no candle do qual deseja realizar o calculo, clicando abaixo do candle é calculada a VWAP baseado na minima dos preços com o volume, clicando sobre o corpo do candle é calculado uma VWAP sobre o preço medio com o volume e clicando acima do candle é calculado uma VWAP baseado na máxima dos preços com o volume, voce tambem tem a opção de remover a VWAP
FREE

This Tool Allow you close all open Orders automatics when Equity reach to specific value: - When Equity is less than specific value - When Equity is greater than specific value - And Allow you close all open orders in manual - It will notification to MT4 Mobile app when it execute close all orders. __________________________________________ It very helpful for you when you trade with prop funds. Avoid reach daily drawdown and automatics close all orders when you get target.
FREE

Advanced grid - Просто советник с минимальными настройками, позволяющий вести торговлю с помощью сетки ордеров. Советник не использует индикаторов.
Настройки : Period - Таймфрейм графика. LotRisk - Автоматическое определение лот. Если LotRisk =0, то не работает. Lot - Фиксированный лот. Level - Ценовой уровень между ордерами ( в пунктах). OrdersClose - Частичное закрытие ордеров. Параметр от 0 до 3. OrdersClose =0 - Отключено. OrdersClose =1 - Для всех типов ордеров. Закрываем один ордер
FREE

This indicator will show yesterday and today high low, very useful to understand the market sentiment. To trade within the range/ break out. Previous day low- can act as support- can used for pull back or break out Previous day high- can act as resistance- can used for pull back or break out The previous day high low breakout strategy refers to the day trading technique that provides traders with multiple opportunities to go either long or short . The main idea is to identify the trend in its m
FREE

Gold BB FREE is Expert Advisor for XAUUSD based on Bollinger Bands . You can edit all strategy parameters as BB open period, TakeProfit, StopLoss or TrailingStop. Default paramters are optimized for best results. But you can test other settings for antoher currency pairs. This EA use three BB with different open periods and close price. Gold BB FREE has been tested from year 2006 to 2021 . My test used the real tick data with 99,90% accuracy. Doesn't use Martingale or other dangerous strategie
FREE
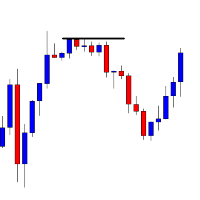
A very simple Ea that put Buy or Sell at Break-out of Maximun of the day before. Here the external variable: 1 Lots (Lot for Buy and Sell() 2 Stop (Stop for Buy and Sell with value * Point) 3 Take (Take for Buy and Sell with value * Point) 4 UpMax (A value that increase the open position on Buy) 4 DownMin(A value that decrease the open position on Sell) This Ea work on all Forex Graphics
For all dubts or problem contact me at crashmens@gmail.com
FREE

The XR Gartley Pattern MT4 is an indicator which displays and alerts Gartley pattern detected on the candlestick chart. It also displays potential trade with calculated Take Profit and Stop Loss, Timeframe H1. After purchasing XR Gartley Pattern, you can immediately download this indicator from the MT4-MT5 Market and start using it because all features are set to default, is not necessary to change any parameter. In addition, we have created a private group for customers who have purchased one
FREE
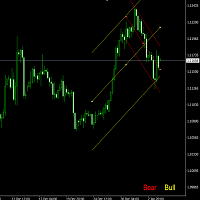
This indicator judges current trend, with Linear regression and the angle. Each parameters setting contents below. Period Period from current
Angle The angle of judging the trend
Width of Lines Width of Linear regression lines* Font size Font size of display text
Lines&Text colour Colour of display lines and test
* This parameter judges that if lines spreads too wide, there is no trend.
FREE

This is a simple Bollinger Band EA This works by activating a trade whenever the input parameters are met, including the Bollinger Band parameters The Bollinger Band Parameters determines when a buy or sell trade is opened: If the price is outside the lower bounds of the activated bollinger bands, a buy trade is opened (given that all other criteria are met) If the price is outside the upper bounds of the activated bollinger bands, a selltrade is opened (given that all other criteria are met)
FREE

Relative Volume or RVOL is an indicator that averages the volume of X amount of days, making it easy to compare sessions volumes.
The histogram only has 3 colors:
Green - Above average volume
Yellow - Average volume
Red - Below average volume
The default setting is 20 days, which corresponds more or less to a month of trading.
With the data obtained from this indicator you can better gauge the commitment behind a move. For example, you will be better equipped to judge if a bre
FREE

TH3ENG CURRENCY STRENGTH SCANNER The best currency strength reader based on more than 4 excellent modes, based on Price action and Volume with various algorithms. This indicator reads all pairs data to measure and find the best results of all currencies and arrange it in a separated dashboard panel.
You can find the strongest currency and the weakest currency, then trade on them pair. NOT COPLICATED NOT REPAINTING NOT LAGING
Input Parameters
=== SYSTEM SETTING === Calc. Mode ==> Calculatio
FREE

This indicator shows the latest untouched support and resistance as horizontal lines. The indicator can show support/resistance from higher timeframes. With this indicator you can e.g. easily see the support/resistance of the timeframes H4, D1 and W1 on a H1 chart, which can be a big advantage while time your entry on H1. This is the FREE version of the indicator: Support Resistance Multi Time Frame The free version works only on EURUSD and GBPUSD!
Parameters referenceTF: the timeframe from wh
FREE

The Expert Advisor builds a grid of orders, defining inputs by built-in setups. After accumulating the profit specified in the settings, it closes the remaining orders to breakeven. Open “breakout” orders create a grid according to the trend, and each separately “trailing” order allows you to maximize profit from the market. Please see all my products: https://www.mql5.com/en/users/en_coding/seller
Benefits: a unique algorithm for constructing a grid of orders, eliminating the minimum delta b
FREE

Trends are like the "Saint Graal of traders": it can give you an higher win rate, a better risk to reward ration, an easier position management and so on...
But it is really hard to determine the trend with accuracy, avoiding fase signals, and with the right timing, in order to take massive movements. That's why I created the Trend Validator: a new and EASY tool that will make identifying trend and build new strategy a really easier work.
ANATOMY OF THE SOFTWARE
The indicator is composed b
FREE
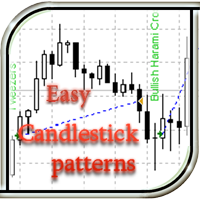
This EA recognizes candlestick patterns, opens trades depending on the last candlestick pattern, and also displays its name (when the ShowInfo option is enabled) directly on the chart of the currency pair. There are also additional indicators whose parameters are adjustable (for example, ADX volatility indicator, dynamic stop loss parameter, trailing stop). The EA can determine both simple models consisting of 1 candlestick, and complex ones from 2 to 5 candles. The simple version of this advise
FREE

Free TrendLine EA opens trades whenever the price on the chart interacts with or crosses your trend line. You simply draw the trend line manually then let the EA do the trading automatically according to the rules you give it. The settings available in the EA are explained below: Lots : The lot size for trading. RiskPercentage : Set a value other than zero to activate lot sizing by use of percentage of margin. TrendLineName: The name of the line to track. You can either * rename the trend line t
FREE

This is a multitimeframe RSI indicator defining trends, oversold/overbought zones, as well as all intersections of signal lines from different timeframes on a single chart using arrows and audio alerts. When working with standard RSI, we often need to examine data from all necessary timeframes simultaneously. RSI 7TF solves this issue. If you are only interested in audio signals when signal lines are crossed, then have a look at RSI Alerts . Attention! The indicator uses seven timeframes - M5, M
FREE
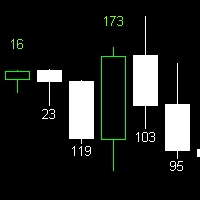
Candle Size Indicator Explore the candle size using this convenient indicator. It works across various timeframes, providing valuable insights for technical analysis. Key Features: Display the size of the candle after configuring the indicator. Compatible with all timeframes. The size of the candle is a significant metric in technical analysis, offering insights into market strength and volatility. This indicator enables clear and accurate visualization of candle sizes on your chart. Utilize thi
FREE

This indicator mostly inspired from BW-ZoneTrade custom indicator from MT5. How To Use:
BUY when both dots colored Green. SELL when both dots colored Red. In addition to original one, MACD-OsMA-generated signal also can be drawn. Input Description:
MA_period_short: Faster EMA period for MACD. Applied when drawMACD is true. MA_period_long: Slower EMA period for MACD. Applied when drawMACD is true. MACDperiod: MA period for MACD. Applied when drawMACD is true. drawMACD: When true, draw an addi
FREE

My exclusive product. Follow RSI and MA. Automated trading bot with capital from $ 1000. You should run the main currency pairs and the minor pairs like EU, GU, AU, EJ, EC .... The martingale + Grid strategy will be very risky, but very profitable.
The main parameters can be installed: Lot - Startot . Fixlot - 0.01_02_03_04 \ or\ 0.01_02_03_05_08 Auto-BUY-SELL - allows to buy or sell. Auto-Grid - ON/OFF AutoLot - ON/OFF TP - Takeprofit -pips. SL - No Stoploss. Use tralling = ON/O
FREE
After purchasing, you can request and receive any two of my products for free!
После покупки вы можете запросить и получить два любых моих продукта бесплатно! Trend signal plus is a trend advisor. The EA is based on the following indicators: Bollinger Bands, Moving Average, RSI. Entering a buy / sell position is carried out according to a trend on rollbacks on a signal with partial closing of the first position at a small take profit. Currency pairs: H1; M30 (EURUSD, GBPUSD, EURJPY, EURGBP
FREE

English : A GF_support+MA.mq4 indikátor átfogó eszközként szolgál a kereskedési döntések támogatására a MetaTrader 4 platformon. Fő funkciója, a LookBackPeriod beállítás lehetővé teszi a kereskedők számára, hogy beállítsák a támogatási és ellenállási szintek kiszámításához használt időszak hosszát. Ez a paraméter határozza meg az elemzési periódus hosszát a gyertyákban, ami döntő fontosságú a piaci csúcsok és mélypontok azonosításához, ezáltal pontosan megrajzolja a támasz- és ellenállásvonala
FREE

Vertical time lines. A simple indicator that draws on the graph vertical lines of time. 1,3,5,10,12,15,20,30,60 minutes. You can change the line color, line style, select a time period from 1 to 60 minutes. Applies to any chart, timeframe. Incoming parameters: Minute_Num = 20; // step 3,5,12,10,20,15,30,60 minutes color Line_Color = clrYellow; // color line Line_Dash = 2; //0,1,2,3,4... solid, dash, dot, dash dot,dash dot dot
FREE

Indicator automatically draw bullish and bearish engulfing without any rules. Bearish and Bullish engulf is well known area for supply and demand area marking. This indicator can be used in any strategy that required supply demand zone. Show Last Engulf : Enable this option to show unfresh engulfing Candle to calculate : set 0 will load all history bar and can use up more memory Bearish Engulfing Colour : Pick any colour that suit Bearish Engulfing Colour : Pick any colour that suit
-Use thi
FREE

The "MACD Trend Follower" is an indicator based on the MACD oscillator. It serves to spot the trend direction by giving it a fixed color until the trend changes (the trend direction colors are customizable). The default MACD settings for the indicator has been changed to adapt to the fast moving Forex market, but they can be changed to suit the trader.
Recommended settings for the indicator : - MACD Fast EMA : 8 Periods. - MACD Slow EMA : 13 Periods. - MACD SMA : 5 Periods.
Indicator inputs
FREE
This expert is a pure volatility scalper working with two pending orders (buy stop and sell stop). Expert not use any indicator, only use prices action and volatility of price to generate signals. There are three conditions for it to work: Tight spread Fast execution Stop level = 0 Please during the tests of this EA do not simultaneously use another EA in the same terminal because it affects the modification speed. Try expert on demo account first before use it on real one.
FREE

Ea Stepper是针对mt4平台的全自动专家顾问,可用于短期,中期和长期策略。该策略是寻找波动性非常低的时段,以将条目置于每日趋势的方向。如果趋势的方向发生变化,并且未平仓交易无利可图,则增加了手数的交易将朝相反的方向进行。
提供的条件:
具有最低点差和佣金的ECN帐户
对冲账户杠杆500:1
提供VPS
最低存款额为1000美元(可使用更少的金额)
输入参数(建议首先优化IN_ALL_CAPITALS参数):
MaxLotSize:交易的最大手数,可以与经纪人的最大手数分开。
MaxSpread:如果点差高于此点,则不会以点数交易。强烈建议您将此值设置为经纪人的广告平均价差。
MagicNumber1:区分帐户上其他EA交易。确保它是唯一的!
MagicNumber2:将交易与帐户上的其他EA交易区分开。确保它是唯一的!
AutoLot:根据帐户大小自动缩放手数。
AutoLotMargin:用于计算AutoLot的金额。
InitialLot:AutoLotMargin量的手数。例如:InitialL
FREE

The Trading Sessions indicator is a simple tool that helps to highlight a specific trading session. For example, it can be used to differentiate the European, American or Asian sessions.
Main features The indicator shows a user-defined trading session. Alert notifications for the start and end of the session. Custom session time. Works on every timeframe (M1, M5, M15, M30, H1, H4, D1, W1, MN). Customizable parameters (Colors, alerts...). It can be used for creating EA. Available for MT4 a
FREE
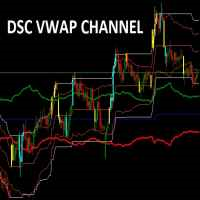
Corretora recomendada para usar esse indicador: https://tinyurl.com/5ftaha7c
Indicador usado para sabermos os pontos de suporte de resistência no gráfico. Funciona em todos ativos e timeframes.
Acerte exatamente os pontos de entradas e saídas das suas operações. SEE OUR RESULTS ON INSTAGRAM: https://www.instagram.com/diogo.cansi/ TELEGRAM GROUP = https://t.me/robosdsc More information by email dscinvestimentos@gmail.com or by Whatsapp 55-991372299
FREE

Индикатор для синхронизации и позиционировании графиков на одном и более терминалах одновременно. Выполняет ряд часто необходимых при анализе графиков функций: 1. Синхронизация графиков локально - в пределах одного терминала при прокрутке, изменении масштаба, переключении периодов графиков, все графики делают это одновременно. 2. Синхронизация графиков глобально - тоже самое, но на двух и более терминалах, как МТ4, так и МТ5. 3. Позиционирование графика на заданном месте при переключении периодо
FREE

Introduction and Description
The indicator displays an arrow whenever a " Bearish Engulfing " is detected. The latter usually indicates the beginning of a downward trend. A bearish engulfing pattern is a technical chart pattern that signals lower prices to come. The pattern consists of an up candlestick followed by a large down candlestick that eclipses or "engulfs" the smaller up candle. The pattern can be important because it shows sellers have overtaken the buyers and are pushing the price m
FREE

SR is a support and resistance indicator, it shows major highs and lows by different colors. The color of a level is changing if the last high or low are touching it. After the closing of a bar above or below level, it will delete it. extern inputs: loop for candles / colors / drawing time *This indicator signal is not perfect and have to be used with other market analysis and confirmations.
FREE

该模块与练习模拟器同步显示图表时间和位置信息,不仅针对同一货币对,还显示不同时间范围和不同货币对的同步图表。
注意:该模块本身不能工作。 需要“Practice Simulator”
Practice Simulator
https://www.mql5.com/zh/market/product/98348
有两种同步模式可供选择。
简单同步方式:
通过打开要同步的图表并将此工具插入其中,您可以轻松创建同步图表。
图表将移至指定位置并部分隐藏。 因此图表有时可能在图表移位、子窗口等中可见。
主动同步模式:
使用离线图表创建图表以进行同步。
该过程更加复杂,但工作原理几乎与实时图表完全相同。
有关更详细的设置信息,请单击此处。
https://www.mql5.com/en/blogs/post/753894
FREE
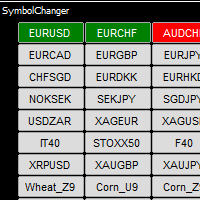
Symbol Chart Changer is an indicator/utility that offers you the option to switch between symbols and timeframes. You can choose any symbol and timeframe on the same chart with just a few clicks. In addition, this indicator also shows the profit of the symbol through the color of the buttons. For MT5: Symbol Chart Changer for MT5 Features
All symbols selected in MarketWatch, that allow you to monitor your favorite instruments on the same chart. Works smoothly on any symbol/instrument, accou
FREE

The support and resistance levels are among the main components of the entire technical analysis. They are used both by professional traders and by beginners. Prices usually move within the price channels. The upper boundary of such a channel is called resistance, and the lower one is support. This indicator plots fractal support and resistance lines at the highest and lowest local price values (fractals).
Distinctive features Does not redraw. Clear and understandable signals. It is possible t
FREE

VArmadA的平衡输入
一个简单而强大的基于分形的支撑/阻力指标。
适用于1h及以上时间段,并对所有主要货币对进行测试。请注意信号。箭头表示多头或空头进入。
它是如何工作的。
箭头表示反向支撑/阻力。向上的箭头表示做多-向下的箭头表示做空交易。
操作说明:指标多头/指标空头
- 指标多头/指标空头:选择给定指标箭头的颜色。
- 显示阻力位。可视化用于确定进入信号的阻力位。
- 显示支撑位。可视化用于确定进入信号的支撑位。
..................................................................................................
FREE
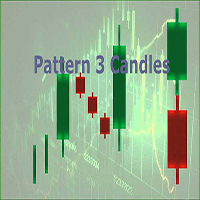
An Expert Advisor based on the 3 candlestick pattern.
1-SL, 2-TP, 3-OFF - 1 pulls up StopLoss. 2 pulls up TakeProfit. 3-disabled.
auto SL / TP on hi-low count bars - number of bars for 1-SL, 2-TP expiration on profit - after passing N bars, TP changes
expiration on loss - after N bars have passed SL to open an order + commission pips for loss expiration - the number of points for expiration on profit
The rest of the settings are intuitive.
FREE
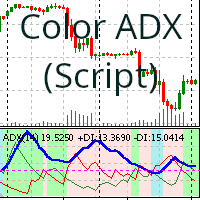
拖放脚本可根据买卖趋势为平均方向指数 (ADX) 指标着色背景
平均方向指数 (ADX) 指标是用于衡量趋势强度的技术指标。 此拖放脚本可根据买卖趋势为 ADX 指标着色背景。背景颜色由脚本参数确定。 可修改的参数: Period: ADX 指标的时间周期。 Level: 要满足以过滤趋势是否为看涨或看跌的最低级别(默认为 0)。 Apply To: (Close price, Open price, High price, Low price, Median price, Typical price, Weighted price)。 Color Positive Trend : 看涨趋势的背景颜色。 Color Negative Trend : 看跌趋势的背景颜色。 Color Neutral Trend : 中性趋势的背景颜色。 Save variables : 保存当前值以供以后重复使用。 Clean graph : 清除图表中的颜色 (Clean colors)。 结论: 这是一个有用的工具,可以帮助市场分析师使用 ADX 指标。它使识别看涨、看跌和中性趋势变得容易。
FREE
First of all, it is worth highlighting here that this Trading Indicator is Non Repainting, Non Redrawing and Non Lagging, which makes it ideal for manual trading. Never repaint and recalculate Once an arrow appears it never disappears, the signal comes at the opening of the new candle You will now be more profitable with this indicator You can do swing trading or scalping trading The indicator helps you identify the trend Can be optimized across all pairs and time frames Blue arrow is for buyin
FREE

Daily pivot are relatively important in trading. This indicator have options to select 5 commonly use pivot point calculations. User input Choose Pivot Point Calculation ( Method Classic, Method Camarilla, Method TomDeMark, Method Fibonacci or Method Woodies. ) Choose Applied Timeframe for the calculation (M5, M15, H1, H4, D1, W1 etc) Can be attached to any timeframe Choose color of Pivot point For MT5 version, please refer here: https://www.mql5.com/en/market/product/38816
FREE
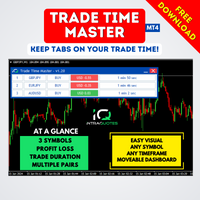
Enhance your trading precision with our revolutionary product, Trade Time Master Pro. This indicator provides unique insights into the duration of your active trades, offering a comprehensive view of their time in Days, Hours, Minutes, and Seconds. Note: It is requested that download must be refrained from if the user is from India, Bangladesh, or Pakistan, as developer support for these regions is unavailable due to legal restrictions. Indicator Features:
Time Display:
Indicator shows first
FREE

Opening positions in the direction of the trend is one of the most common trading tactics.
This indicator determines the direction of the local movement and colors the candles on the chart in the appropriate color.
Allows you to enter the transaction at the very beginning of the movement
Thanks to the flexible settings you can use on any currency pairs, metals and cryptocurrency
Can be used when working with binary options
Distinctive features Does not redraw. Additional parameters for
FREE

A trend indicator showing the strength of bulls and bears in a trading range.
Consists of two lines:
The green line is a balanced overbought/oversold condition. The red line is the direction of trading activity. Does not redraw calculations.
Can be used on all Symbols/Instruments/Time Frames.
Easy to use and set up.
How to use the indicator and what it determines.
The basic rule is to follow the direction of the red line:
if it crosses the green line from the bottom up, the market i
FREE

This indicator studies price action as an aggregation of price and time vectors, and uses the average vector to determine the direction and strength of the market. This indicator highlights the short-term directionality and strength of the market, and can be used to capitalize from short-term price movements by trading breakouts or binary options. [ Installation Guide | Update Guide | Troubleshooting | FAQ | All Products ] Find market direction easily Confirm with breakouts or other indicators D
FREE

The MP Andean Oscillator is used to estimate the direction and also the degree of variations of trends. It contains 3 components: Bull component, Bear component and Signal component. A rising Bull component indicates that the market is up-trending while a rising Bear component indicates the presence of down-trending market. Settings: Oscillator period: Specifies the importance of the trends degree of variations measured by the indicator. Signal line per: Moving average period of the Signal line
FREE

The indicator looks for market Highs and Lows. They are defined by fractals, i.e. the market creates the indicator algorithm and structure, unlike ZigZag having a rigid algorithm that affects the final result. This indicator provides a different view of the price series and detects patterns that are difficult to find on standard charts and timeframes. The indicator does not repaint but works with a small delay. The first fractal level is based on the price, the second fractal level is based on t
FREE
Highly configurable Bollinger Bands indicator. Features: Highly customizable alert functions (at levels, crosses, direction changes via email, push, sound, popup) Multi timeframe ability Color customization (at levels, crosses, direction changes) Linear interpolation option Works on strategy tester in multi timeframe mode (at weekend without ticks also) Parameters:
Bollinger Bands Timeframe: You can set the lower/higher timeframes for Bollinger Bands. Bollinger Bands Bar Shift: Y ou can set
FREE

Sometimes a trader needs to know when a candle will close and a new one appears to make the right decisions, this indicator calculates and displays the remaining of current candle time . It is simple to use, just drag it on the chart. Please use and express your opinion, expressing your opinions will promote the products. To see other free products, please visit my page.
FREE

Camarilla Pivots Historical plots the historical data of the camarilla pivot point levels on the chart. The Camarilla Pivot levels was originated in 1989 by Nick Scott. The levels are used as primary support and resistance levels by Intraday traders. The levels are calculated with the following formula: R4 = C + RANGE * 1.1/2 R3 = C + RANGE * 1.1/4 R2 = C + RANGE * 1.1/6 R1 = C + RANGE * 1.1/12 PP = (HIGH + LOW + CLOSE) / 3 S1 = C - RANGE * 1.1/12 S2 = C - RANGE * 1.1/6 S3 = C - RANGE * 1.1/4 S4
FREE

Indicador "Trade Zones: Supply and Demand Opportunities" para MetaTrader: Eleva tu Trading con Precisión Estratégica El indicador "Trade Zones: Supply and Demand Opportunities" es una herramienta revolucionaria diseñada para potenciar la toma de decisiones de los traders al identificar claramente las zonas de oportunidad basadas en los principios fundamentales de oferta y demanda. Este indicador, compatible con MetaTrader, proporciona una visión intuitiva de las áreas críticas del mercado donde
FREE

Auto ZZ SR Indicator
This indicator automatically draws trend lines using ZigZag top and bottom points. The more ZigZag tops/bottoms that are used, the greater the number of possible combinations. Therefore, the more possible trend lines can be drawn. And vice versa too. The fewer ZigZag tops/bottoms that are used, the lower the number of possible combinations. And therefore, the fewer the possible trend lines can be drawn. The indicator constantly updates the trend lines on the chart as the ma
FREE

Volatility Limit Trend Indicator (VLT), an original indicator by this developer, is a trend indicator based on setting a fixed volatility limit as a percentage of price. Volatile price is allowed to wander between two channel lines defining the fixed volatility about a central line. The price crossing one of the channel lines defines an exceeding of the allowed volatility, and ushering in one of two situation : either a continuation or a reversal of trend. The first buffer of the indicator (not
FREE

不同货币对的行为是相互关联的。 Visual Correlation 指标允许您在一张图表上显示不同的工具,同时保持比例。 您可以定义正相关、负相关或无相关。
有些仪器比其他仪器更早开始移动。 这样的时刻可以通过叠加图来确定。
要在图表上显示工具,请在 Symbol 字段中输入其名称。
亲爱的朋友! 我们提请您注意视觉相关性指标。 主要优点及其工作原理: 不同貨幣對的行為是相互關聯的。 Visual Correlation 指標允許您在一張圖表上顯示不同的工具,同時保持比例。 您可以定義正相關、負相關或無相關。
有些儀器比其他儀器更早開始移動。 這樣的時刻可以通過疊加圖來確定。
要在圖表上顯示工具,請在 Symbol 字段中輸入其名稱。 Version for MT5 https://www.mql5.com/zh/market/product/109155
FREE

The YK-LOT-SIZE is an indicator that displays the total Lot Size and profit/loss of all trade orders for the current symbol on the price chart. It has the following features: Shows the total Lot Size of buy orders (BUY) and sell orders (SELL) on separate lines. Displays the profit/loss of buy orders (BUY) and sell orders (SELL) by calculating the sum of profit, commission, and swap. Users can customize the color of the displayed text through the input parameter. The information is displayed at t
FREE
Th3Eng signals wave is a very good indicator to read the trend. But you need to filter the main trend direction with your own strategy. Because this indicator signals are repainted. So for example: Use Moving average 21 to find the trend and if the price is above the moving on higher TF or the current >> open only buy signals from the indicator. Also you can use it on option trading, Not only on forex.
Works with all time-frames. works with all pairs, CFD and cryptocurrency. Sending all alerti
FREE
学习如何在MetaTrader AppStore上购买EA交易,MetaTrader平台的应用程序商店。
MQL5.community支付系统支持通过PayPay、银行卡和热门付款系统进行交易。为更好的客户体验我们强烈建议您在购买前测试EA交易。
您错过了交易机会:
- 免费交易应用程序
- 8,000+信号可供复制
- 探索金融市场的经济新闻
注册
登录