Maxminza

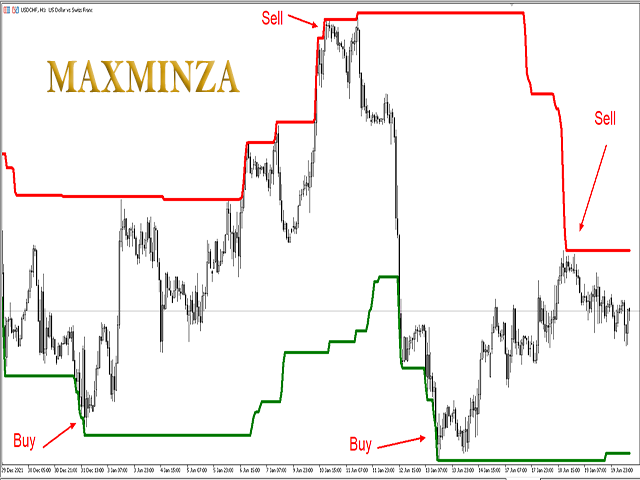
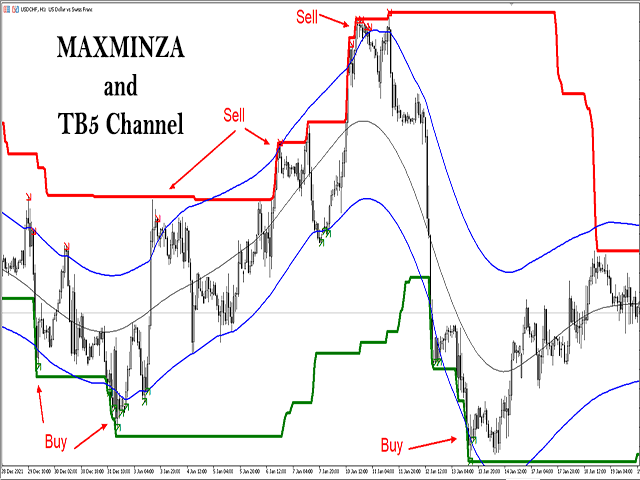
MAXMINZA is a channel indicator showing the maximum and minimum values ​​on any timeframe for a certain period (number of candles). This indicator creates a channel that predicts where the price will tend to reach (the opposite side of the channel). The indicator is multi-timeframe, it can consider the spread for plotting. The indicator does not redraw. This indicator goes well with another channel indicator TB5 Channel.

Values:

The number of candles is the period for which the channel is calculated, the default is 100 candles.

Consider the spread — consider the spread or not when building a channel. (When a large border is broken and an ask, the indicator makes a delay so as not to immediately redraw the low).

The filtering delta in pips is the size of the spread that will be considered when building the channel.

Wishing everyone successful trading!


Önerilen ürünler
RQL_BOX Indicator — English Description (How to Use) What it does RQL_BOX is a manual range box tool controlled by two draggable vertical lines: LEFT handle (v-line): selects a candle on a chosen timeframe and sets the box High/Low to that candle’s wicks . RIGHT handle (v-line): defines how far to extend the box to the right (projection end). It then draws: the main box (range), optional top/bottom 20% zones , an optional 50% midpoint line , and an on-chart info panel with key metrics. How to us
FREE
Introduction This indicator detects volume spread patterns for buy and sell opportunity. The patterns include demand and supply patterns. You might use each pattern for trading. However, these patterns are best used to detect the demand zone (=accumulation area) and supply zone (=distribution area). Demand pattern indicates generally potential buying opportunity. Supply pattern indicates generally potential selling opportunity. These are the underlying patterns rather than direct price action. T
All in One Multi Indicator
Teerathad Booranawisedkul
Overview Comprehensive technical analysis indicator combining 20+ essential trading tools in a single chart display. Moving Averages EMA (Exponential Moving Average): 9, 21, 50, 200 periods SMA (Simple Moving Average): configurable period Customizable colors and line widths Price position indicators (above/below) Oscillators & Momentum RSI (Relative Strength Index): adjustable overbought/oversold levels MACD (Moving Average Convergence Divergence): customizable fast/slow/signal periods Stochasti
NEXA Breakout Velocity NEXA Breakout Velocity, kanal kırılımı mantığına dayalı, ROC (fiyat değişim hızı), hacim filtresi ve ATR tabanlı risk yönetimi ile desteklenen otomatik işlem sistemidir. Sistem, fiyatın bir bant aralığını artan momentum ve işlem hacmi ile birlikte kırdığı volatilite genişleme dönemlerini tespit etmek için tasarlanmıştır. Tüm sinyaller yalnızca kapanmış mumlar üzerinden hesaplanır. Aynı sembolde aynı anda yalnızca bir pozisyon tutulur. Strateji Genel Bakış Sistem aşağıdaki
FREE
The ABC Indicator analyzes the market through waves, impulses, and trends, helping identify key reversal and trend-change points. It automatically detects waves A, B, and C, along with stop-loss and take-profit levels. A reliable tool to enhance the accuracy and efficiency of your trading. This product is also available for MetaTrader 4 =>  https://www.mql5.com/en/market/product/128179 Key Features of the Indicator: 1. Wave and Trend Identification:    - Automatic detection of waves based on mov
SEE WHERE PRICE IS !!   Multi-Period High & Low Zones  가격의 좌표를 보라 !! 가격이 어디에 있는지 모르면 , 어떤 전략도 의미가 없다 . B2U High & Low Price Zone does not change the market. It changes how you see it. B2U Market State System Part of the B2U Market State System If you don’t know where price is, no strategy really matters. B2U High & Low Price Zone visualizes multi-period high / low structures and the current price gap in one clean, intuitive view. B2U High & Low Price Zone 은 여러 시간 축의 최고가 · 최저가 구조와  현재 가격의 위치 (Gap
Trending or Ranging Dashboard See Every Timeframe's Market Condition at a Glance Stop guessing whether you should be trading breakouts or reversals. The Trending or Ranging Dashboard instantly shows you the market state across all major timeframes - from M1 to Monthly - in one compact, color-coded panel. What Makes This Different Most traders struggle because they use trending strategies in ranging markets, or range-bound strategies when the market is trending. This indicator solves that proble
Introduction to Harmonic Volatility Indicator Harmonic Volatility Indicator is the first technical analysis applying the Fibonacci analysis to the financial volatility. Harmonic volatility indicator is another level of price action trading tool, which combines robust Fibonacci ratios (0.618, 0.382, etc.) with volatility. Originally, Harmonic Volatility Indicator was developed to overcome the limitation and the weakness of Gann’s Angle, also known as Gann’s Fan. We have demonstrated that Harmonic
StrikeZone ATR is a professional-grade ATR-based volatility indicator designed for precision intraday trading. It visualizes volatility strength using a dynamic histogram and smoothed deviation line, helping traders instantly identify expansion, contraction, trend strength, and reversal zones. Key Features TradingView-style ATR histogram (Up/Down bars with multi-color levels) Smoothed deviation line for clearer volatility trend Instant detection of volatility spikes and quiet zones Color-coded b
FREE
ICT Kill zones
Israr Hussain Shah
ICT Kill zones Professional Automate your ICT & Smart Money analysis with precise, dynamic session tracking and liquidity pivots. Product Description Stop wasting time drawing boxes and lines every single day.   ICT Killzones Professional   is the ultimate session management tool designed specifically for traders utilizing Inner Circle Trader (ICT) concepts, Smart Money Concepts (SMC), and Liquidity-based strategies. This indicator automatically highlights the key trading sessions— Asia, London,
Promotion is over.  Price is $30n after 5 purchase price will be $49. PLEASE READ CAREFULLY HOW TO USE IT Dynamic AI Trend Analyzer is Key Changer for your trading! Automatically Capture Multi-time Frame Trend Shows the Market Regime/Bias with confluence % Recognize current trend strength Advanced S/R and BB with Volume Profile Combined as 1 Channel Indicator itself keep improving through advanced learning system The indicator is non-repainting What is Adaptive Learning? Collect Real-time Dat
Divergent Bar
Danil Poletavkin
Bill Williams'ın angülasyonla tersine çevrilmiş sapkın barı. Yeşil çizgi ile çubuğun üstü / alt kısmı arasındaki açı, temelde Justin Williams'ın güncellenmiş yönergelerine uygun olarak köşe olarak kullanılır. Timsah Dudak çizgisinin kesiştiği andan itibaren 85 ve 21 bar açısının varsayılan ayarları oldukça iyi çalışıyor. Bu göstergeyi gerçek ticarette kullanırsanız - gün içinde ticaret yapmanızı şiddetle tavsiye etmiyorum, günlük grafikleri kullanın. Sinyal EURUSD, US500, BTCUSD ve DE40'DA tes
RoboTick Signal
Mahir Okan Ortakoy
Merhabalar   Bu İndikatörde basit bir hareketli ortalama çakışması algoritması ile yola çıktım. Ancak daha başarılı sonuçlar almak için hareketli ortalamaların çakışmalarını ve optimize değerlerini açılış kapanış yükseklik ve en düşük değerlerini baz alarak farklı senaryolar kurarak öyle her ortamda ulaşabileceğiniz hareketli ortalamaların muhtemelen görmüş olduğunuz en istikrarlı çalışan versiyonunu sizlere sunmuş bulunuyorum.   İşin içine biraz hacim koyduk bu indikatörü çalıştırırken bana ka
Strength Candles
Luis Paulo Rodrigues Pastor
Indicator in histogram format, which is calculated using data on financial volume, tick volume and the body of the bar. It is possible to visualize moments where there was a large entry of volume, both financial and in ticks, and that the market managed to progress and advance in one direction (up or down) due to the size of the bar body, which is where there really was a victory for one side of the negotiation (buyers and sellers). By default, all bars in the indicator's histogram are colore
Viking Strategy Indicator – The Beating Heart of the BT 3.0 System The Viking Strategy Indicator is not just another indicator… It’s one of the pillars of the revolutionary BT 3.0 trading system , built to transform the trading experience for everyone — from beginners to experts . BT 3.0 is much more than a tool: It’s a complete trading solution , both semi-automated and fully automated , integrating 6 powerful indicators and a smart assistant that analyzes, detects, alerts, and executes b
Introduction to Fractal Pattern Scanner Fractal Indicator refers to the technical indicator that makes use of the fractal geometry found in the financial market. Fractal Pattern Scanner is the advanced Fractal Indicator that brings the latest trading technology after the extensive research and development work in the fractal geometry in the financial market. The most important feature in Fractal Pattern Scanner is the ability to measure the turning point probability as well as the trend probabil
Market Structure Break & Order Block (MSB-OB) The Market Structure Break & Order Block (MSB-OB) indicator is built to analyze price structure, highlight market structure breaks, and mark order block zones. It also provides buffers for Buy/Sell signals and MSB detection, making it suitable for both manual analysis and automated strategies. A tester panel is included to evaluate performance under different conditions in the Strategy Tester. Main Concept Market Structure Break (MSB): Occurs after
FFXMV Forex Dashboard Indicator MT5
Opengates Success International
FULL FOREX MARKET VIEW Gösterge Panosu MT5 Bu, MT5 platformu için oluşturulmuş özel bir göstergedir ve yatırımcılara piyasada neler olup bittiğine dair tam bir görünüm sağlar. Piyasayı analiz etmek ve başarılı bir işlem için gerekli tüm bilgileri göstermek için gerçek zamanlı veriler kullanır. KURULUM: Bu göstergiyi grafik penceresine eklemeden önce, MT5'inizdeki "Piyasa İzleme" paneline gidin ve ihtiyaç duymadığınız veya işlem yapmadığınız tüm döviz çiftlerini GİZLEYİN, yalnızca gerekli olanlar
The Fixed Trend indicator searches for and displays the turning point price on the chart. Trend indicators are one of the main tools for analyzing trends in the Forex currency market. The goal, which was pursued in its creation, is to obtain signals that will give less noise and respond more quickly to price changes. The Fixed Trend indicator is a trend indicator that is used to search for reversals when its boundaries break. Trend indicators allow you to effectively determine the direction o
Overview In the fast-paced world of forex and financial markets, quick reactions and precise decision-making are crucial. However, the standard MetaTrader 5 terminal only supports a minimum of 1-minute charts, limiting traders' sensitivity to market fluctuations. To address this issue, we introduce the Second-Level Chart Candlestick Indicator , allowing you to effortlessly view and analyze market dynamics from 1 second to 30 seconds on a sub-chart. Key Features Support for Multiple Second-Level
Triple Machine
Thomas Bradley Butler
Build your own model to predict averages of turning points of the Triple Moving Average Oscillator. It is simple.  Rate me with stars. Just load the indicator Triple Moving Average Oscillator in you platform and choose the period.  Scroll through to observe the averages of the highs and lows over a period of time. Add the levels for a buy and a sell on the Triple Machine and this will show the average of highs and lows to look for buys and sell. You can load multiple copies with multiple levels.
Breakout Trend Trading Strategy Guide Table of Contents Core Concepts Breakout & Rejection Rules Entry & Exit Strategies Risk Management Trade Examples Common Mistakes Core Concepts The Breakout Trend Indicator identifies two key market behaviors: Breakouts : Price breaks through support/resistance levels Rejections : Price fails to break through these levels Indicator Calculations Top = Highest high of X candles (excluding current) Top1 = Highest high of X candles (including current) Bottom = L
FREE
TDI Laguerre
Andres Felipe Carvajal Rodriguez
TDI Laguerre TDI Laguerre , popüler Traders Dynamic Index (TDI) göstergesinin bir evrimidir. Fiyat hareketinin daha akıcı, hassas ve doğru bir okumasını sunmak için klasik RSI'ın yerine bir Laguerre filtresi kullanır. Bu gelişmiş versiyon, oynaklık unsurlarını, hareketli ortalamaları ve görsel sinyal tespitini yapılandırılabilir uyarılarla birleştirir. Bu Gösterge Ne Yapar? Bu gösterge şunları temsil eder: Kapanış fiyatına dayalı, yumuşatılmış bir Laguerre çizgisi . Laguerre çizgisi üzerinde kı
"Hunttern harmonic pattern finder" base on the dynamic zigzag with the notification and prediction mode This version of the indicator identifies 11 harmonic patterns and predicts them in real-time before they are completely formed. It offers the ability to calculate the error rate of Zigzag patterns depending on a risk threshold. It moreover sends out a notification once the pattern is complete. The supported patterns: ABCD BAT ALT BAT BUTTERFLY GARTLEY CRAB DEEP CRAB CYPHER SHARK THREE DRIV
Gann Box MT5
Frederic Jacques Collomb
Gann Box göstergesi, trader'ların piyasanın kilit seviyelerini tanımlamalarına ve bunlardan yararlanmalarına yardımcı olmak için tasarlanmış güçlü ve çok yönlü bir araçtır. Bu gösterge, grafiğe bir dikdörtgen çizmeyi sağlar ve bu dikdörtgen otomatik olarak stratejik seviyeler olan 0, 0.25, 0.50, 0.75, 1 ile birkaç bölgeye ayrılır. Fiyat bu seviyelerden birine ulaştığında, alarmlar tetiklenir ve bu, ticaret kararları için değerli bir destek sağlar. Çizdiğiniz bölgeye göre piyasanın gelişimini an
Bu gösterge, pratik ticaret için mükemmel olan otomatik dalga analizine yönelik bir göstergedir! Dava... Not:   Dalga sınıflandırması için Batılı isimleri kullanmaya alışkın değilim. Tang Lun'un (Tang Zhong Shuo Zen) adlandırma kuralının etkisiyle, temel dalgayı   kalem   , ikincil dalga bandını ise   segment   olarak adlandırdım. aynı zamanda segmentin trend yönü vardır. Adlandırma   esas olarak trend segmentidir   (bu adlandırma yöntemi gelecekteki notlarda kullanılacaktır, öncelikle söyleyey
The   Clean Trading Sessions indicator  shows the most significant trading sessions for the Forex market, such as London, New York, Tokyo. The   Clean Trading Sessions indicator is a simple and, at the same time, quite functional Forex sessions indicator, developed for the MT5 terminal. It is available to download for free. How is this Forex market session indicator used? Traders normally use trading sessions to determine the volatile hours throughout the day, since the trading activities vary
FREE
G-Labs Market   Maker Dashboard MT5 | BT MM Scanner with Peak Formation, AD R Cycles and Asian Range Real -time multi-currency Market Maker   scanner for MetaTrader   5. Tracks BTMM peak   formations, Asian session ranges, ADR   cycle progression, stop hunt activity, cycle   projections, and RSI entry timing   across 28+ pairs from a single   dashboard. The entry-level   BTMM dashboard for traders learning and   applying the Banks Track Market Maker method . Provides all the core cycle data   yo
This   inside bar indicator MT5  is suitable if you are doing inside bar trading. So what this MT5 inside bar indicator does is identifies inside bars for you as they form on your charts. Inside bar   is a famous trading pattern in which the bar carry higher low and lower high compared with the previous bar, also known as mother bar. With, a lesser time frame like the 1 hour chart, daily inside bar chart will sometimes appears to be similar to a triangle pattern. Inputs Settings for MA; AlertOn
FREE
ADR Pro
Oleksandr Myrhorodskyi
ADR Pro — Auto Adaptive Daily Range & Volatility Indicator (ATR + ADR + Alerts) Auto Adaptation. All Markets. No Guesswork . Enhance your trading decisions with precise ADR levels — for Forex, Crypto, Stocks, Indices, Metals, Energy, Commodities, and ETFs. Easy Setup Professional Features Lifetime Free Updates ADR Pro is your personal "volatility compass" that shows the real daily range boundaries for any asset. Forget manual calculations and constant parameter adjustments — the indicator
Bu ürünün alıcıları ayrıca şunları da satın alıyor
SuperScalp Pro
Van Minh Nguyen
5 (6)
SuperScalp Pro – Gelişmiş Çoklu Filtreli Scalping Gösterge Sistemi SuperScalp Pro, klasik Supertrend ile çok sayıda akıllı onay filtresini birleştiren gelişmiş bir scalping gösterge sistemidir. Gösterge M1’den H4’e kadar tüm zaman dilimlerinde verimli çalışır ve özellikle XAUUSD, BTCUSD ve ana Forex pariteleri için uygundur. Bağımsız bir sistem olarak kullanılabilir veya mevcut ticaret stratejilerine esnek şekilde entegre edilebilir. Gösterge, hız ve yavaş EMA’lar, trend belirleyen üç EMA, EMA e
Bu indikatörü satın alırsanız, Profesyonel Trade Manager’ımı  + EA ÜCRETSİZ olarak alacaksınız. Öncelikle, bu Ticaret Sistemi'nin Non-Repainting, Non-Redrawing ve Non-Lagging Göstergesi olduğunu vurgulamak önemlidir, bu da hem manuel hem de robot ticareti için ideal hale getirir. Online kurs, kılavuz ve ön ayarları indir. "Smart Trend Trading System MT5", yeni ve deneyimli tüccarlar için özelleştirilmiş kapsamlı bir ticaret çözümüdür. 10'dan fazla premium göstergeyi birleştiriyor ve 7'den fazla
Divergence Bomber
Ihor Otkydach
4.89 (82)
Bu göstergeyi satın alan herkese aşağıdaki ekstra içerikler ücretsiz olarak sunulmaktadır: Her işlemi otomatik olarak yöneten, Stop Loss ve Take Profit seviyelerini ayarlayan ve işlemleri strateji kurallarına göre kapatan özel yardımcı araç: "Bomber Utility" Göstergenin farklı varlıklar üzerinde kullanılmasına yönelik ayar dosyaları (set dosyaları) Bomber Utility için 3 farklı modda kullanım sunan ayar dosyaları: "Minimum Risk", "Dengeli Risk" ve "Bekle-Gör Stratejisi" Bu ticaret stratejisini hı
Entry In The Zone and SMC Multi Timeframe is a real-time market analysis tool developed based on Smart Money Concepts (SMC). It is designed to analyze market structure, price direction, reversal points, and key zones across multiple timeframes in a systematic way. The system displays Points of Interest (POI) and real-time No Repaint signals, with instant alerts when price reaches key zones or when signals occur within those zones. It functions as both an Indicator and a Signal System (2-in-1), c
FX Trend MT5 NG
Daniel Stein
5 (4)
FX Trend NG: Yeni Nesil Çoklu Piyasa Trend Zekâsı Genel Bakış FX Trend NG , çoklu zaman dilimlerinde çalışan profesyonel bir trend analiz ve piyasa izleme aracıdır. Piyasanın yapısını saniyeler içinde anlamanızı sağlar. Birden fazla grafik arasında geçiş yapmak yerine, hangi enstrümanların trendde olduğunu, momentumun nerede zayıfladığını ve hangi zaman dilimlerinin uyumlu olduğunu anında görebilirsiniz. Lansman Teklifi – FX Trend NG sadece $30 (6 Ay) veya $80 Ömür Boyu Lisans ile edinin. Zate
Trend Screener Pro MT5
STE S.S.COMPANY
4.84 (101)
Trend Göstergesi, Trend Alım Satım ve Filtreleme için Çığır Açan Benzersiz Çözüm, Tüm Önemli Trend Özellikleriyle Tek Bir Araç İçinde Yerleştirildi! Forex, emtialar, kripto para birimleri, endeksler ve hisse senetleri gibi tüm sembollerde/araçlarda kullanılabilen %100 yeniden boyamayan çoklu zaman çerçevesi ve Çoklu para birimi göstergesidir. Trend Screener, grafikte noktalarla ok trend sinyalleri sağlayan etkili bir trend trend göstergesidir. Trend analizörü göstergesinde bulunan özellikler: 1.
ARIPoint
Temirlan Kdyrkhan
ARIPoint is a powerful trading companion designed to generate high-probability entry signals with dynamic TP/SL/DP levels based on volatility. Built-in performance tracking shows win/loss stats, PP1/PP2 hits, and success rates all updated live. Key Features: Buy/Sell signals with adaptive volatility bands Real-time TP/SL/DP levels based on ATR Built-in MA Filter with optional ATR/StdDev volatility Performance stats panel (Success, Profit/Loss, PP1/PP2) Alerts via popup, sound, push, or email Cu
FX Power MT5 NG
Daniel Stein
5 (31)
FX Power: Daha Akıllı Ticaret Kararları için Para Birimlerinin Gücünü Analiz Edin Genel Bakış FX Power , her piyasa koşulunda başlıca para birimlerinin ve altının gerçek gücünü anlamak için vazgeçilmez bir araçtır. Güçlü para birimlerini alıp zayıf olanları satarak, FX Power ticaret kararlarınızı basitleştirir ve yüksek olasılıklı fırsatları ortaya çıkarır. İster trendlere sadık kalın ister Delta'nın aşırı değerlerini kullanarak tersine dönüşleri öngörün, bu araç ticaret tarzınıza mükemmel bir
Azimuth Pro
Ottaviano De Cicco
5 (4)
LAUNCH PROMO Azimuth Pro price is initially set at 299$ for the first 100 buyers. Final price will be 499$ . THE DIFFERENCE BETWEEN RETAIL AND INSTITUTIONAL ENTRIES ISN'T THE INDICATOR — IT'S THE LOCATION. Most traders enter at arbitrary price levels, chasing momentum or reacting to lagging signals. Institutions wait for price to reach structured levels where supply and demand actually shift. Azimuth Pro maps these levels automatically: swing-anchored VWAP, multi-timeframe structure lines, an
Bu gösterge, fiyat dönüş noktalarını ve fiyat geri dönüş bölgelerini doğru bir şekilde gösterir.       Başlıca oyuncular   . Yeni trendlerin nerede oluştuğunu görüyorsunuz ve her işlem üzerinde kontrolü elinizde tutarak, azami hassasiyetle kararlar alıyorsunuz. TREND LINES PRO   göstergesiyle birlikte kullanıldığında maksimum potansiyelini ortaya koyar.  VERSION MT4 Göstergenin gösterdiği şey: Yeni bir trendin başlangıcında aktivasyonla birlikte tersine dönüş yapıları ve tersine dönüş seviyeler
Atomic Analyst MT5
Issam Kassas
4.07 (28)
Öncelikle belirtmek gerekir ki bu Ticaret Göstergesi Yeniden Çizim Yapmaz, Gecikmez ve Gecikme Göstermez, bu da hem manuel hem de robot ticareti için ideal hale getirir. Kullanıcı kılavuzu: ayarlar, girişler ve strateji. Atom Analisti, Piyasada Daha İyi Bir Avantaj Bulmak İçin Fiyatın Gücünü ve Momentumunu Kullanan PA Fiyat Hareketi Göstergesidir. Gürültüleri ve Yanlış Sinyalleri Kaldırmaya ve Ticaret Potansiyelini Artırmaya Yardımcı Olan Gelişmiş Filtrelerle Donatılmıştır. Birden fazla katmanl
TREND ÇİZGİLERİ PRO       Piyasanın gerçek yön değiştirdiği noktayı anlamaya yardımcı olur. Gösterge, gerçek trend dönüşlerini ve büyük oyuncuların piyasaya yeniden girdiği noktaları gösterir. Anlıyorsun   BOS hatları   Daha yüksek zaman dilimlerindeki trend değişiklikleri ve önemli seviyeler, karmaşık ayarlar veya gereksiz gürültü olmadan gösterilir. Sinyaller yeniden çizilmez ve çubuk kapandıktan sonra grafikte kalır. MT4 SÜRÜMÜ   -   RFI LEVELS PRO   göstergesiyle   birlikte kullanıldığında m
Grabber System MT5
Ihor Otkydach
4.82 (22)
Size mükemmel bir teknik gösterge olan Grabber’ı tanıtıyorum. Bu araç, kullanıma hazır bir “her şey dahil” işlem stratejisi olarak çalışır. Tek bir yazılım kodu içinde güçlü piyasa teknik analiz araçları, işlem sinyalleri (oklar), uyarı işlevleri ve push bildirimleri entegre edilmiştir. Bu göstergeyi satın alan herkes aşağıdaki hediyeleri ücretsiz olarak alır: Açık emirleri otomatik yönetmek için Grabber Yardımcı Aracı Kurulum, yapılandırma ve nasıl işlem yapılacağını adım adım anlatan video kıl
Quantum TrendPulse
Bogdan Ion Puscasu
5 (20)
SuperTrend   ,   RSI   ve   Stochastic'in   gücünü tek bir kapsamlı göstergede birleştirerek işlem potansiyelinizi en üst düzeye çıkaran nihai işlem aracı olan   Quantum TrendPulse'u   tanıtıyoruz. Hassasiyet ve verimlilik arayan yatırımcılar için tasarlanan bu gösterge, piyasa trendlerini, momentum değişimlerini ve en uygun giriş ve çıkış noktalarını güvenle belirlemenize yardımcı olur. Temel Özellikler: SuperTrend Entegrasyonu:   Güncel piyasa trendlerini kolayca takip edin ve karlılık dalgası
Öncelikle, bu Ticaret Aracının Non-Repainting, Non-Redrawing ve Non-Lagging Gösterge olduğunu vurgulamakta fayda var, bu da onu profesyonel ticaret için ideal hale getiriyor. Çevrimiçi kurs, kullanıcı kılavuzu ve demo. Akıllı Fiyat Hareketi Kavramları Göstergesi, hem yeni hem de deneyimli tüccarlar için çok güçlü bir araçtır. İleri ticaret fikirlerini, Inner Circle Trader Analizi ve Smart Money Concepts Ticaret Stratejileri gibi 20'den fazla kullanışlı göstergeyi bir araya getirerek bir araya
Top indicator for MT5   providing accurate signals to enter a trade without repainting! It can be applied to any financial assets:   forex, cryptocurrencies, metals, stocks, indices .  Watch  the video  (6:22) with an example of processing only one signal that paid off the indicator! MT4 version is here It will provide pretty accurate trading signals and tell you when it's best to open a trade and close it. Most traders improve their trading results during the first trading week with the help of
Berma Bands
Muhammad Elbermawi
5 (8)
Berma Bantları (BB'ler) göstergesi, piyasa trendlerini belirlemeyi ve bunlardan yararlanmayı amaçlayan yatırımcılar için değerli bir araçtır. Fiyat ile BB'ler arasındaki ilişkiyi analiz ederek, yatırımcılar bir piyasanın trend veya aralıklı fazda olup olmadığını ayırt edebilir. Daha fazla bilgi edinmek için [ Berma Home Blog ] adresini ziyaret edin. Berma Bantları üç belirgin çizgiden oluşur: Üst Berma Bandı, Orta Berma Bandı ve Alt Berma Bandı. Bu çizgiler fiyatın etrafına çizilir ve genel tren
Her gün birçok trader ortak bir zorlukla karşılaşır: fiyat önemli bir seviyeyi kırıyor gibi görünür, işleme girerler ve ardından piyasa tersine dönerek stop loss'larını tetikler. Bu, sahte kırılım (false breakout) olarak bilinir — fiyatın bir destek veya direnç seviyesini kısa süreliğine aşması ve ardından yön değiştirmesi hareketidir. Bu hareketler, gerçek fiyat yönü netleşmeden önce stop loss'ların tetiklenmesine neden olabilir. Teknik analizde bu olgu yaygın olarak "likidite taraması" (liquid
Pointer Trend Switch — precision trend reversal indicator Pointer Trend Switch is a high-precision arrow indicator designed to detect key moments of trend reversal based on asymmetric price behavior within a selected range of bars. It identifies localized price impulses by analyzing how far price deviates from the opening level, helping traders find accurate entry points before a trend visibly shifts. This indicator is ideal for scalping, intraday strategies, and swing trading, and performs equa
Gold Sniper Scalper Pro
Ich Khiem Nguyen
3.63 (8)
Gold Sniper Scalper Pro, trader'ların giriş noktalarını belirlemesine ve riski etkili bir şekilde yönetmesine destek olmak için tasarlanmış MetaTrader 5 için profesyonel bir göstergedir. Gösterge, sinyal tespit sistemi, otomatik Entry/SL/TP yönetimi, hacim analizi ve gerçek zamanlı performans istatistikleri içeren kapsamlı bir analiz araçları seti sunar. Sistemi anlamak için kullanım kılavuzu   |   Diğer diller için kullanım kılavuzu ANA ÖZELLİKLER Sinyal tespit sistemi Gösterge, price action a
Göstergemiz, piyasada ilgi gösterilen bölgeleri vurgular ve ardından emir birikim bölgelerini gösterir. Büyük ölçekli bir emir defteri (order book) gibi çalışır. Bu, büyük sermaye için geliştirilmiş bir göstergedir. Performansı olağanüstüdür. Piyasada ne tür bir ilgi olursa olsun, onu görürsünüz . (Bu, tamamen yeniden yazılmış ve otomatikleştirilmiş bir versiyondur – artık manuel analiz gerekmez.) İşlem Hızı (Transaction Speed) , piyasada büyük emirlerin nerede ve ne zaman biriktiğini gösteren v
Advanced Supply Demand MT5
Bernhard Schweigert
4.5 (14)
Herhangi bir Acemi veya Uzman Tüccar için En İyi Çözüm! Bu gösterge benzersiz, yüksek kaliteli ve uygun fiyatlı bir ticaret aracıdır çünkü bir dizi tescilli özelliği ve yeni bir formülü bir araya getirdik. Bu güncelleme ile çift zaman dilimi dilimlerini gösterebileceksiniz. Yalnızca daha yüksek bir TF gösteremeyeceksiniz, aynı zamanda TF grafiğini ve ARTIK daha yüksek TF'yi de gösterebileceksiniz: YUVARLAK BÖLGELERİ GÖSTERMEK. Tüm Arz Talebi tüccarları buna bayılacak. :) Önemli Bilgiler Açıkland
Protect against whipsaws: revolutionize your swing trading approach Swing Trading is the first indicator designed to detect swings in the direction of the trend and possible reversal swings. It uses the baseline swing trading approach, widely described in trading literature. The indicator studies several price and time vectors to track the aggregate trend direction and detects situations in which the market is oversold or overbought and ready to correct. [ Installation Guide | Update Guide | Tro
Candle Smart Range
Gianny Alexander Lugo Sanchez
MetaTrader 5 için Candle Smart Range (CSR) Candle Smart Range, birden fazla zaman diliminde fiyat aralıklarının otomatik olarak tanımlanması için tasarlanmış teknik bir göstergedir. Bu araç, piyasa yapısını mum formasyonlarına ve fiyatın önceki en yüksek/en düşük seviyelerle olan etkileşimine dayanarak analiz eder. Ana Özellikler: Aralık Tespiti: İmpulsif hareketlerden önceki konsolidasyon bölgelerini tanımlar. Sahte Kırılma Tanımlama: Fiyatın önceki seviyeyi aştığı ancak mum kapanış kriterlerin
TrendMaestro5
Stefano Frisetti
note: this indicator is for METATRADER4, if you want the version for METATRADER5 this is the link:  https://www.mql5.com/it/market/product/108106 TRENDMAESTRO ver 2.5 TRENDMAESTRO recognizes a new TREND from the start, he never makes mistakes. The certainty of identifying a new TREND is priceless. DESCRIPTION TRENDMAESTRO identifies a new TREND in the bud, this indicator examines the volatility, volumes and momentum to identify the moment in which there is an explosion of one or more of these da
Unlock hidden profits: accurate divergence trading for all markets Tricky to find and scarce in frequency, divergences are one of the most reliable trading scenarios. This indicator finds and scans for regular and hidden divergences automatically using your favourite oscillator. [ Installation Guide | Update Guide | Troubleshooting | FAQ | All Products ] Easy to trade Finds regular and hidden divergences Supports many well known oscillators Implements trading signals based on breakouts Displays
Trend indicator AI mt5
Ramil Minniakhmetov
5 (15)
Trend Ai göstergesi, trend tanımlamasını işlem yapılabilir giriş noktaları ve geri dönüş uyarılarıyla birleştirerek bir yatırımcının piyasa analizini geliştirecek harika bir araçtır. Bu gösterge, kullanıcıların forex piyasasının karmaşıklıklarında güvenle ve hassasiyetle yol almalarını sağlar. Birincil sinyallerin ötesinde, Trend Ai göstergesi geri çekilmeler veya düzeltmeler sırasında ortaya çıkan ikincil giriş noktalarını belirleyerek, yatırımcıların belirlenen trend içindeki fiyat düzeltmele
FX Volume MT5
Daniel Stein
4.79 (24)
FX Volume: Bir Broker’ın Perspektifinden Gerçek Piyasa Duyarlılığını Deneyimleyin Kısa Özet Trading yaklaşımınızı bir adım öteye taşımak ister misiniz? FX Volume , perakende traderlar ile brokerların nasıl konumlandığını gerçek zamanlı olarak sunar—COT gibi gecikmeli raporlardan çok daha önce. İster istikrarlı kazançları hedefliyor olun, ister piyasada daha güçlü bir avantaj arayın, FX Volume önemli dengesizlikleri belirlemenize, kırılmaları (breakout) doğrulamanıza ve risk yönetiminizi iyileş
Native Channels
BeeXXI Corporation
5 (1)
This indicator recognizes all support and resistance levels. A number of unique high-performance techniques have been applied, which made the existence of this indicator possible. All formed channels are naturally visible: horizontal linear linear parabolic cubic (Polynomial 3 degrees - Wave) This is due to a bundle of approximating channels. The formed channels form "standing waves" in a hierarchical sequence. Thus, all support and resistance levels are visible. All parameter management is i
Trend Forecaster
Alexey Minkov
5 (7)
The Trend Forecaster indicator utilizes a unique proprietary algorithm to determine entry points for a breakout trading strategy. The indicator identifies price clusters, analyzes price movement near levels, and provides a signal when the price breaks through a level. The Trend Forecaster indicator is suitable for all financial assets, including currencies (Forex), metals, stocks, indices, and cryptocurrencies. You can also adjust the indicator to work on any time frames, although it is recommen
Yazarın diğer ürünleri
TB5 Channel
Oleksandr Myrhorodskyi
1 (1)
TB5 Channel  is a multi- timeframe channel indicator. It generates input points on different timeframes. There are 2 methods for constructing an indicator. The first method  is to install the indicator on the current timeframe. In this case you will have a channel on that timeframe that you have at MT5. The second method to install an indicator is to multiply it by the timeframe index. The point of the second method is to construct a higher timeframe channel on the current chart. For example, i
GoldWay EA
Oleksandr Myrhorodskyi
GoldWay EA  is a trending Expert Advisor for various instruments . The EA does not use either martingale or grid. It has an automatic increase in lot size, the size of which can be adjusted in the EA settings. By default, three orders are opened at once with different take profits. When the first take profit is reached, the remaining open positions are transferred to breakeven, when the second take profit is reached, the remaining third order is transferred to the first take profit. That ensures
ADR Pro
Oleksandr Myrhorodskyi
ADR Pro — Auto Adaptive Daily Range & Volatility Indicator (ATR + ADR + Alerts) Auto Adaptation. All Markets. No Guesswork . Enhance your trading decisions with precise ADR levels — for Forex, Crypto, Stocks, Indices, Metals, Energy, Commodities, and ETFs. Easy Setup Professional Features Lifetime Free Updates ADR Pro is your personal "volatility compass" that shows the real daily range boundaries for any asset. Forget manual calculations and constant parameter adjustments — the indicator
GoldWay EA II
Oleksandr Myrhorodskyi
GoldWay EA II is a brand-new MetaTrader 5 Expert Advisor built on a new GoldWay trading engine . This is not a patch of a previous version — it’s a new architecture: an HTF core + controlled LTF add-ons , staged position management (up to 3 tranches), separate HTF/LTF take-profit targets, breakeven automation, and an advanced indicator-based exit workflow. Live signal: https://www.mql5.com/en/signals/2343104?source=Site+Signals+Page The EA is optimized to work with the following brokers: Tickmil
Filtrele:
İnceleme yok
İncelemeye yanıt