Simple ATR
- Göstergeler
- Sürüm: 1.0
- Etkinleştirmeler: 10

Piyasa volatilitesini daha net bir şekilde izlemek için basitleştirilmiş bir araç, hem günlük ticaret hem de salınım ticareti için idealdir.
İşlem yapmaya başlamak veya yeni başlayanlar için en iyi göstergedir.
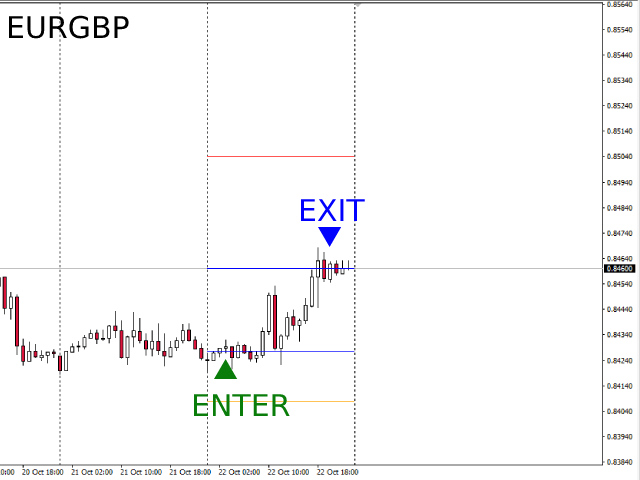
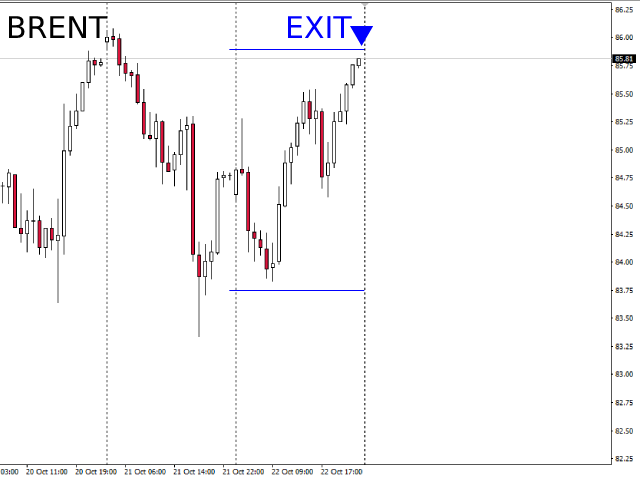
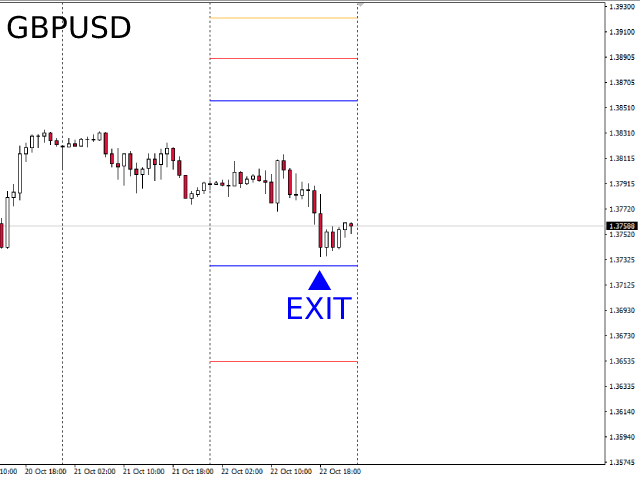
Görsel Gösterge Rengi: ATR Daily - Mavi
Görsel Gösterge Rengi: ATR Weekly - Kırmızı
Görsel Gösterge Rengi: ATR Monthly - Sarı
Analizi geliştirmek için Volatility Vision göstergesi ile birleştirin.
Piyasa koşullarındaki dalgalanmaları kesin olarak ölçer, günlük ticaret ve salınım ticareti kararları için gereklidir.
Doğruluğu sağlamak için 14 günlük (ayarlanabilir) basit hareketli ortalama kullanır.
İşlem sistemlerinde açılış veya çıkış stratejilerini uygulamak için idealdir.
ATR göstergelerinin diğerlerinden daha iyi olmasının nedenleri:
Kullanım kolaylığı: ATR göstergeleri, yeni başlayan tüccarlar için bile kurulumu ve anlaşılması kolaydır.
Çok yönlülük: Hem günlük ticaret hem de salınım ticareti için uygundur ve çeşitli ticaret stratejilerinde esneklik sağlar.
Güvenilirlik: ATR, tüccarların daha bilinçli kararlar almasına yardımcı olan doğru piyasa volatilite verilerini sağlar.
Özelleştirilebilirlik: Hareketli ortalama süresini ayarlama yeteneği, tüccarların göstergeleri belirli ihtiyaçlarına ve tercihlerine göre uyarlamalarına olanak tanır.
Birleştirilebilirlik: ATR, Volatility Vision gibi diğer göstergelerle kolayca entegre olarak piyasa koşullarının daha derinlemesine analiz edilmesini sağlar.