Aroon MT5

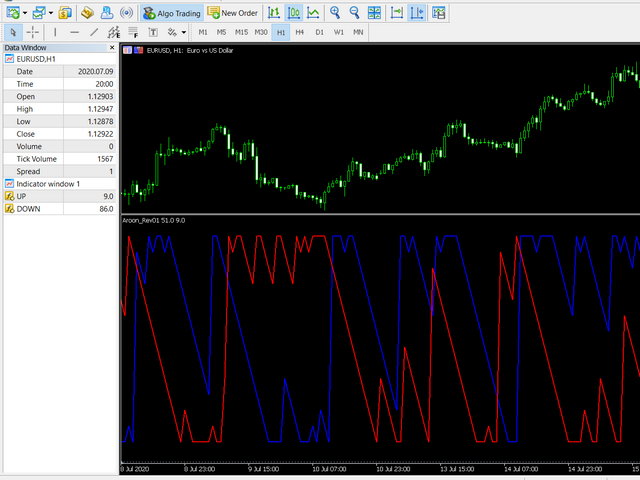
This indicator is powerful for detecting the trend.

The crossing between to line is the entry signal.

Buffer 0 is UP line. Buffer 1 is DOWN line.

Note:

1. Aroon is great tool for trending detecting. Please try to select the best period for each instrument.


Input

■ AroonPeriod=14- Aroon period
■ MailAlert=false- Send email when entry signals appeared.
■ SoundAlert=false- Notify on MT5 platform.


Önerilen ürünler
RBreaker
Zhong Long Wu
RBreaker Gold Indicators is a short-term intraday trading strategy for gold futures that combines trend following and intraday reversal approaches. It not only captures profits during trending markets but also enables timely profit-taking and counter-trend trading during market reversals. This strategy has been ranked among the top ten most profitable trading strategies by the American magazine   Futures Truth   for 15 consecutive years. It boasts a long lifecycle and remains widely used and st
Premium seviye, %80'den fazla doğru tahmin doğruluğuna sahip benzersiz bir göstergedir! Bu gösterge en iyi Ticaret Uzmanları tarafından iki aydan uzun süredir test edilmiştir! Yazarın göstergesini başka hiçbir yerde bulamazsınız! Ekran görüntülerinden bu aracın doğruluğunu kendiniz görebilirsiniz! 1, sona erme süresi 1 mum olan ikili opsiyon ticareti için harikadır. 2 tüm döviz çiftleri, hisse senetleri, emtialar, kripto para birimleri üzerinde çalışır Talimatlar: Kırmızı ok göründüğü an
Trades History Visualizer is a MetaTrader 5 indicator that displays your trading history directly on the chart, providing a clear visual representation of past trades with additional information. Key Features: Visual trade history display with entry arrows Entry, Stop Loss, and Take Profit horizontal lines Color-coded connector lines between entry and exit points (green for profit, red for loss) Risk-Reward ratio display for each closed trade Profit/Loss amount display option Pip display option
Volume Profile V6
Andrey Kolesnik
4.67 (3)
Piyasa Hacim Profili Göstergesi + Akıllı Osilatör. Döviz çiftleri, hisse senetleri, vadeli işlemler, kripto paralar gibi hemen hemen tüm enstrümanlarda hem gerçek hacimler hem de tick hacimleri üzerinde çalışır. Profil oluşturma aralığını otomatik olarak (örneğin bir haftalık veya bir aylık vb.) belirleyebileceğiniz gibi, sınırları (kırmızı ve mavi iki dikey çizgi) hareket ettirerek aralığı manuel olarak da ayarlayabilirsiniz. Histogram şeklinde görüntülenir. Belirli bir seviyedeki histogram gen
L'indicatore SMC Venom Model BPR è uno strumento professionale per i trader che operano nell'ambito del concetto di Smart Money (SMC). Identifica automaticamente due modelli chiave sul grafico dei prezzi: FVG   (Fair Value Gap) è una combinazione di tre candele, in cui c'è un gap tra la prima e la terza candela. Forma una zona tra livelli in cui non c'è supporto di volume, il che spesso porta a una correzione dei prezzi. BPR   (Balanced Price Range) è una combinazione di due modelli FVG che for
# DRAWDOWN INDICATOR V4.0 - The Essential Tool to Master Your Trading ## Transform Your Trading with a Complete Real-Time Performance Overview In the demanding world of Forex and CFD trading, **knowing your real-time performance** isn't a luxury—it's an **absolute necessity**. The **Drawdown Indicator V4.0** is much more than a simple indicator: it's your **professional dashboard** that gives you a clear, precise, and instant view of your trading account status. --- ## Why This Indicator
ALGOTRIBE Volatility Filter (GVZ + ATR) Institutional Volatility Intelligence for Smart Risk Control Category: Volatility & Risk Management Platform: MetaTrader 5 Type: Indicator (Chart Window) Overview ALGOTRIBE Volatility Filter is a next-generation volatility intelligence tool engineered to help traders anticipate, interpret, and manage market volatility with precision. By combining the CBOE Gold Volatility Index (GVZ) with a dynamic ATR-based engine , the indicator identifies real-ti
CosmiCLab SMC FIBO CosmiCLab SMC FIBO is a professional trading indicator designed for traders who use Smart Money Concepts (SMC), market structure analysis and Fibonacci retracement levels. The indicator automatically detects market swings and builds Fibonacci levels based on the latest impulse movement. It also identifies market structure changes such as BOS (Break of Structure) and CHOCH (Change of Character), helping traders understand the current market direction. CosmiCLab SMC FIBO also pr
"Impulses and Corrections 5" is created to help traders navigate the market situation. The indicator shows multi-time frame upward and downward "Impulses" of price movements. These impulses are the basis for determining the "Base" , which is composed of zones of corrections of price movements, as well as "Potential" zones for possible scenarios of price movement. Up and down impulses are determined based on a modified formula of Bill Williams' "Fractals" indicator. The last impulse is always "U
Divergent Stochastic Filter II Catch Reversals Early, Filter Noise, Trade with Confidence The Edge: Why This Stochastic is Different  Every trader knows the Stochastic oscillator. But knowing when to trust its signals, that's the real challenge. The Divergent Stochastic Filter II transforms this classic indicator into a precision reversal detection system by adding critical elements: divergence intelligence, signal filtering and exhaustion detection.  While standard Stochastic oscillators fire s
Was: $249  Now: $99   Market Profile defines a number of day types that can help the trader to determine market behaviour. A key feature is the Value Area, representing the range of price action where 70% of trading took place. Understanding the Value Area can give traders valuable insight into market direction and establish the higher odds trade. It is an excellent addition to any system you may be using. Inspired by Jim Dalton’s book “Mind Over Markets”, this indicator is designed to suit the
Noize Absorption Index - is the manual trading system that measures the difference of pressure between bears forces and bulls forces. Green line - is a noize free index that showing curent situation. Zero value of index shows totally choppy/flat market.Values above zero level shows how powerfull bullish wave is and values below zero measures bearish forces.Up arrow appears on bearish market when it's ready to reverse, dn arrow appears on weak bullish market, as a result of reverse expectation.
Utraspikedetector
Odete Argelio Simbine
UltraSpikeDETECTOR for MQL5 is a professional market indicator designed to detect sudden price spikes and market trends efficiently. It provides real-time alerts, clear visual signals, and full integration with the MQL5 platform. Fully customizable and adaptable to various trading strategies, it helps traders monitor market movements more effectively. This tool is intended to support informed decision-making and improve trading analysis. No profit guarantees are provided, ensuring compliance wit
Universal Soul Reaper
Pieter Gerhardus Van Zyl
Universal Soul Reaper is an atmospheric market-flow oscillator designed to interpret price behavior as a cycle of spiritual energy. Instead of reacting to raw price alone, it visualizes the state of the market’s soul —revealing when momentum is awakening, stabilizing, or fading. The indicator operates in a separate window and presents three interwoven entities: the Ectoplasmic Veil , the Spirit Boundary , and the Soul Core . Together, they form a living framework that helps traders sense pressu
TrendDetect
Pavel Gotkevitch
The Trend Detect indicator combines the features of both trend indicators and oscillators. This indicator is a convenient tool for detecting short-term market cycles and identifying overbought and oversold levels. A long position can be opened when the indicator starts leaving the oversold area and breaks the zero level from below. A short position can be opened when the indicator starts leaving the overbought area and breaks the zero level from above. An opposite signal of the indicator can b
OVERVIEW This script is called "Market Structure Confluence" and it combines classic market structure analysis with a dynamic volatility-based band system to detect shifts in trend and momentum more reliably. It tracks key swing points (higher highs, higher lows, lower highs, lower lows) to define the trend, then overlays a basis and ATR-smoothed volatility bands to catch rejection signals and highlight potential inflection points in the market. CONCEPTS Market structure is the foundation
Axiom Point
Tatiana Savkevych
Axiom Point — Precision Structural Breakout Indicator Axiom Point is a high-performance analytical indicator designed to identify high-probability reversal zones using price-action behaviour and adaptive balance filtering. The indicator applies a multi-layer analytical model to detect moments when price transitions beyond its normal equilibrium area, indicating a potential shift in market momentum. Unlike conventional trend-following tools, Axiom Point focuses on so-called points of no return —
DYJ BoS göstergesi, piyasa yapısındaki değişimlerin temel unsurlarını otomatik olarak belirler ve işaretler, bunlar arasında şunlar yer alır: Yapının Kırılması (BoS): Fiyatın önceki bir yapı noktasını kırarak önemli bir hareket yapması durumunda tespit edilir. Olası yükseliş trendi çizgilerini ve düşüş trendi çizgilerini (UP & DN, yani sürekli yeni zirveler ve yeni dipler) işaretler ve fiyat bu çizgileri aştığında kırmızı (AYI) ve yeşil (BOĞA) okları işaretler BoS genellikle fiyatın önceki f
Trade history
Andriy Konovalov
5 (2)
The indicator plots charts of profit taken at the Close of candles for closed (or partially closed) long and short positions individually. The indicator allows to filter deals by the current symbol, specified expert ID (magic number) and the presence (absence) of a substring in a deal comment, to set the start time and the periodicity of profit reset (daily, weekly or monthly) to calculate the profit chart. The indicator also displays the floating (not fixed) profit of the opened positions at th
Pro Gold System Indicator
PEDRO JOAQUIM GONCALVES GOMES
ADVANCED FUNCTIONALITIES: Trend Score (0-100) with visual bar Intelligent signals with adjustable strength (1-10) Risk management with automatic TP/SL Audible and visual alerts Price zones with smooth filling Multi-indicator analysis (RSI, ATR, BB, EMAs) DESIGN FEATURES Modern Visual: Smooth and well-spaced lines (EMA with 2-3px width) Vibrant and professional colors (Sky Blue, Orange, Gold) Modern arrows (code 233/234) for buy/sell signals Configurable dark/light theme Adjustable transparency f
Price Magnet — Price Density and Attraction Levels Indicator Price Magnet is a professional analytical tool designed to identify key support and resistance levels based on statistical Price Density. The indicator analyzes a specified historical period and detects price levels where the market spent the most time. These zones act as “magnets,” attracting price action or forming a structural base for potential reversals. Unlike traditional Volume Profile tools, Price Magnet focuses on price-time d
This indicator is used to compare the relative strength of the trade on the chart against the other several selected symbols. By comparing the price movement of each traded variety based on the same base day, several trend lines of different directions can be seen, reflecting the strong and weak relationship between the several different traded varieties, so that we can have a clearer understanding of the market trend. For example, you can apply this indicator on a EurUSD chart and compare it w
Hi Traders, MTF FVGs (Extend) – Smart Supply & Demand Zones. This indicator automatically identifies bullish (demand) and bearish (supply) FVG zones on your chart using multi-timeframe analysis. Zones are displayed as rectangles with optional midlines, helping you visualize key support and resistance levels more clearly. Key Features: Multi-timeframe support: detect zones on the current or higher timeframe Adjustable lookback period and minimum zone size Limit the number of visible bullish and
Your Pointer is no ordinary Forex channel. This corridor is built on the basis of the analysis of several candles, starting from the last one, as a result of which the extremes of the studied interval are determined. They are the ones who create the channel lines. Like all channels, it has a middle line as well as a high and low line. This channel is worth watching for its unusual behavior. The use of the Your Pointer indicator allows the trader to react in time to the price going beyond the bo
STRICTLY FOR BOOM INDEX ONLY!!!!! Here I bring the Maximum Trend Arrows OT1.0 MT5 indicator. This indicator is made up of a combination of different trend indicators for entries and exits, for entries an orange arrow will paint on the chart below the current market and a red flag for closing of trades and it produces buy arrows only. When the orange arrow appears, it will appear along with it's sound to notify you. The 1H timeframe is recommended, don't use it anywhere else than on the 1H timefr
Düz ve trend belirleme göstergesi. Fiyat, iki histogramdan ve iki çizgiden (kırmızı ve mavi) herhangi birinin altındaysa, bu bir satış bölgesidir. Göstergenin bu sürümünü satın alırken, bir gerçek ve bir demo hesabı için MT4 sürümü - hediye olarak (almak için bana özel mesaj yazın)! Fiyat, iki histogramdan ve iki çizgiden (kırmızı ve mavi) herhangi birinin üzerindeyse, bu bir satın alma bölgesidir. MT4 versiyonu: https://www.mql5.com/en/market/product/3793 Fiyat iki satır arasında veya hist
Terra Infinity is a flat indicator. This improved version of the CalcFlat indicator has three additional lines that significantly increase its effectiveness. Unlike its predecessor with two static levels, Terra Infinity adds three dynamic lines above the main histogram, which are interpreted as follows: base signal line, minimum signal line, maximum signal line. These lines are formed using the additional parameter Avg, which is the average value of the histogram. Averaging produces a line cl
Fibo Channels
Jeffrey Quiatchon
Fibo Daily Channel Indicator The  Indicator is a powerful tool for traders, providing precise daily support and resistance levels based on Fibonacci retracement and extension calculations. This indicator automatically draws key pivot points (PP, R1, R2, S1, S2) as well as additional extension levels (R3, R4, S3, S4), helping traders identify potential reversal and breakout zones with ease. It includes customizable alerts and push notifications, allowing traders to receive updates whenever the pr
Qauters Theory GBPJPY
Brighton Mufaro Mudzingwa
QT PRO Quarters Theory GBPJPY · London Open Breakout Plots 250-pip major quarters, 125-pip half-quarters, and 25-pip minor levels on GBPJPY. Monitors the London session open (08:00 GMT) and fires a single buy or sell arrow when price breaks and closes beyond the first key level — one signal per day, no repainting How it works now: Arrows only appear between 08:00–12:00 GMT (London session) — nothing outside that window 1 arrow per day maximum — once the first valid break is found, that day is
Ortalama geri dönüş ticareti için profesyonel ve nicel bir yaklaşım uygulayan benzersiz gösterge. Fiyatın tahmin edilebilir ve ölçülebilir bir şekilde ortalamaya döndüğü ve yön değiştirdiği gerçeğinden yararlanır, bu da nicel olmayan ticaret stratejilerinden büyük ölçüde daha iyi performans gösteren net giriş ve çıkış kurallarına izin verir. [ Installation Guide | Update Guide | Troubleshooting | FAQ | All Products ] Ticaret sinyallerini temizle Ticaret yapmak inanılmaz derecede kolay Özelleşt
Bu ürünün alıcıları ayrıca şunları da satın alıyor
SuperScalp Pro
Van Minh Nguyen
4.59 (22)
SuperScalp Pro – Gelişmiş Çoklu Filtre Scalping Gösterge Sistemi SuperScalp Pro, işlem fırsatlarını belirlemeye yardımcı olmak için klasik Supertrend ile birden fazla akıllı onay filtresini birleştiren gelişmiş bir scalping göstergesidir. M1’den H4’e kadar farklı zaman dilimlerinde verimli şekilde çalışır ve XAUUSD, BTCUSD ile majör Forex pariteleri için optimize edilmiştir. Gösterge, net Al ve Sat sinyalleri sunar ve ATR tabanlı otomatik giriş fiyatı, stop loss ve take profit seviyeleri hesapla
Entry In The Zone and SMC Multi Timeframe is a real-time 2-in-1 market analysis tool that combines market structure analysis and a No Repaint BUY / SELL signal system into a single indicator, built on Smart Money Concepts (SMC) — a widely adopted framework used by professional traders to understand market structure. This indicator helps you see the market more clearly, make decisions based on structure rather than guesswork, and focus on high-probability zones where price is more likely to react
Divergence Bomber
Ihor Otkydach
4.9 (87)
Bu göstergeyi satın alan herkese aşağıdaki ekstra içerikler ücretsiz olarak sunulmaktadır: Her işlemi otomatik olarak yöneten, Stop Loss ve Take Profit seviyelerini ayarlayan ve işlemleri strateji kurallarına göre kapatan özel yardımcı araç: "Bomber Utility" Göstergenin farklı varlıklar üzerinde kullanılmasına yönelik ayar dosyaları (set dosyaları) Bomber Utility için 3 farklı modda kullanım sunan ayar dosyaları: "Minimum Risk", "Dengeli Risk" ve "Bekle-Gör Stratejisi" Bu ticaret stratejisini hı
Power Candles V3 - Kendi Kendini Optimize Eden Güç Göstergesi Power Candles V3, döviz ve enstrüman gücünü, eklendiği her grafikte eyleme geçirilebilir bir ticaret planına dönüştürür. Sadece mumları renklendirmek yerine, arka planda canlı bir otomatik optimizasyon çalıştırır ve önünüzdeki sembol için en iyi Stop Loss, Take Profit ve sinyal eşiğini size sunar. Tek bir tıklama ile canlı ticarete uyarlanır - giriş, Stop Loss ve Take Profit ışınları grafikte tam fiyatlarla görünür ve uyarılar yön bil
SignalTech MT5 is a trading system for EURUSD, USDCHF, USDJPY, AUDUSD, NZDUSD, EURJPY, AUDJPY, NZDJPY, CADJPY H2 and H3 Timeframe.  It can generate signals with Buy/Sell Arrows and Pop-Up/Sound Alerts. Each signal has clear Entry and Stop Loss levels, which should be automatically flagged on the chart, as well as potential Targets 1, 2, and 3. The Entry and TP levels are fixed after the trade is taken. The exit level is dynamic. If there are signs of a potential short-term trend reversal, the
Grabber System MT5
Ihor Otkydach
4.83 (23)
Size mükemmel bir teknik gösterge olan Grabber’ı tanıtıyorum. Bu araç, kullanıma hazır bir “her şey dahil” işlem stratejisi olarak çalışır. Tek bir yazılım kodu içinde güçlü piyasa teknik analiz araçları, işlem sinyalleri (oklar), uyarı işlevleri ve push bildirimleri entegre edilmiştir. Bu göstergeyi satın alan herkes aşağıdaki hediyeleri ücretsiz olarak alır: Açık emirleri otomatik yönetmek için Grabber Yardımcı Aracı Kurulum, yapılandırma ve nasıl işlem yapılacağını adım adım anlatan video kıl
FX Trend MT5 NG
Daniel Stein
5 (4)
FX Trend NG: Yeni Nesil Çoklu Piyasa Trend Zekâsı Genel Bakış FX Trend NG , çoklu zaman dilimlerinde çalışan profesyonel bir trend analiz ve piyasa izleme aracıdır. Piyasanın yapısını saniyeler içinde anlamanızı sağlar. Birden fazla grafik arasında geçiş yapmak yerine, hangi enstrümanların trendde olduğunu, momentumun nerede zayıfladığını ve hangi zaman dilimlerinin uyumlu olduğunu anında görebilirsiniz. Lansman Teklifi – FX Trend NG sadece $30 (6 Ay) veya $80 Ömür Boyu Lisans ile edinin. Zate
Bu indikatörü satın alırsanız, Profesyonel Trade Manager’ımı  + EA ÜCRETSİZ olarak alacaksınız. Öncelikle, bu Ticaret Sistemi'nin Non-Repainting, Non-Redrawing ve Non-Lagging Göstergesi olduğunu vurgulamak önemlidir, bu da hem manuel hem de robot ticareti için ideal hale getirir. Online kurs, kılavuz ve ön ayarları indir. "Smart Trend Trading System MT5", yeni ve deneyimli tüccarlar için özelleştirilmiş kapsamlı bir ticaret çözümüdür. 10'dan fazla premium göstergeyi birleştiriyor ve 7'den fazla
Btmm state engine pro
Garry James Goodchild
5 (4)
BTMM State Engine Pro is a MetaTrader 5 indicator for traders who use the Beat The Market Maker approach: Asian session context, kill zone timing, level progression, peak formation detection, and a multi-pair scanner from a single chart. It combines cycle state logic with a built-in scanner dashboard so you do not need the same tool on many charts at once. What it does Draws the Asian session range; session times can follow broker server offset or be set in inputs. Tracks level progression (L
Gann Made Easy , bay teorisini kullanarak ticaretin en iyi ilkelerine dayanan, profesyonel ve kullanımı kolay bir Forex ticaret sistemidir. WD Gann. Gösterge, Zararı Durdur ve Kâr Al Seviyeleri dahil olmak üzere doğru SATIN AL ve SAT sinyalleri sağlar. PUSH bildirimlerini kullanarak hareket halindeyken bile işlem yapabilirsiniz. Satın alma işleminden sonra, alım satım talimatlarını ve harika ek göstergeleri ücretsiz olarak almak için lütfen benimle iletişime geçin! Muhtemelen Gann ticaret yöntem
Quantum TrendPulse
Bogdan Ion Puscasu
5 (23)
SuperTrend   ,   RSI   ve   Stochastic'in   gücünü tek bir kapsamlı göstergede birleştirerek işlem potansiyelinizi en üst düzeye çıkaran nihai işlem aracı olan   Quantum TrendPulse'u   tanıtıyoruz. Hassasiyet ve verimlilik arayan yatırımcılar için tasarlanan bu gösterge, piyasa trendlerini, momentum değişimlerini ve en uygun giriş ve çıkış noktalarını güvenle belirlemenize yardımcı olur. Temel Özellikler: SuperTrend Entegrasyonu:   Güncel piyasa trendlerini kolayca takip edin ve karlılık dalgası
Trend Screener Pro MT5
STE S.S.COMPANY
4.85 (104)
Trend Göstergesi, Trend Alım Satım ve Filtreleme için Çığır Açan Benzersiz Çözüm, Tüm Önemli Trend Özellikleriyle Tek Bir Araç İçinde Yerleştirildi! Forex, emtialar, kripto para birimleri, endeksler ve hisse senetleri gibi tüm sembollerde/araçlarda kullanılabilen %100 yeniden boyamayan çoklu zaman çerçevesi ve Çoklu para birimi göstergesidir. Trend Screener, grafikte noktalarla ok trend sinyalleri sağlayan etkili bir trend trend göstergesidir. Trend analizörü göstergesinde bulunan özellikler: 1.
Tanıtım       Quantum Breakout PRO   , Breakout Bölgeleri ile ticaret yapma şeklinizi değiştiren çığır açan MQL5 Göstergesi! 13 yılı aşkın ticaret tecrübesine sahip deneyimli tüccarlardan oluşan bir ekip tarafından geliştirilmiştir.       Kuantum Breakout PRO       yenilikçi ve dinamik koparma bölgesi stratejisiyle ticaret yolculuğunuzu yeni zirvelere taşımak için tasarlanmıştır. Kuantum Breakout Göstergesi, size 5 kar hedefi bölgesi ile kırılma bölgelerinde sinyal okları ve kırılma kutusuna da
Atomic Analyst MT5
Issam Kassas
3.94 (31)
Öncelikle belirtmek gerekir ki bu Ticaret Göstergesi Yeniden Çizim Yapmaz, Gecikmez ve Gecikme Göstermez, bu da hem manuel hem de robot ticareti için ideal hale getirir. Kullanıcı kılavuzu: ayarlar, girişler ve strateji. Atom Analisti, Piyasada Daha İyi Bir Avantaj Bulmak İçin Fiyatın Gücünü ve Momentumunu Kullanan PA Fiyat Hareketi Göstergesidir. Gürültüleri ve Yanlış Sinyalleri Kaldırmaya ve Ticaret Potansiyelini Artırmaya Yardımcı Olan Gelişmiş Filtrelerle Donatılmıştır. Birden fazla katmanl
OmniSync Projection
Antonio-alin Teculescu
5 (1)
Chronos Fractal Engine is an innovative price projection indicator for MetaTrader 5, designed to transform your technical analysis by intelligently identifying and projecting historical price patterns. Built upon an advanced correlation algorithm and the fractal principles of the market, this powerful tool visualizes potential future price movements, giving you a unique edge in your trading decisions. What is Chronos Fractal Engine? At its core, the Chronos Fractal Engine employs a sophisticat
Bu gösterge paneli, seçilen semboller için mevcut en son   harmonik kalıpları   gösterir, böylece zamandan tasarruf edersiniz ve daha verimli olursunuz /   MT4 sürümü . Ücretsiz Gösterge:   Basic Harmonic Pattern Gösterge sütunları Symbol :   seçilen semboller görünecektir Trend:   yükseliş veya düşüş Pattern :   desen türü (gartley, kelebek, yarasa, yengeç, köpekbalığı, cypher veya ABCD) Entry :   giriş fiyatı SL:   zararı durdur fiyatı TP1:   1. kar alma fiyatı TP2:   2. kar alma fiyatı TP
FX Levels MT5
Daniel Stein
5 (13)
FX Levels: Tüm Piyasalar İçin Son Derece Hassas Destek ve Direnç Hızlı Bakış Döviz kurları, endeksler, hisseler veya emtialar gibi herhangi bir piyasada güvenilir destek ve direnç seviyeleri belirlemek mi istiyorsunuz? FX Levels geleneksel “Lighthouse” yöntemini ileri düzey bir dinamik yaklaşımla birleştirerek neredeyse evrensel bir doğruluk sağlar. Gerçek broker deneyimimize ve otomatik günlük güncellemeler ile gerçek zamanlı güncellemelerin birleşimine dayalı olarak, FX Levels size dönüş nok
Azimuth Pro
Ottaviano De Cicco
5 (7)
Azimuth Pro V2: Synthetic Fractal Structure and Confirmed Entries for MT5 Overview Azimuth Pro is a multi-level swing structure indicator by Merkava Labs . Four nested swing layers, swing-anchored VWAP, ABC pattern detection, three-timeframe structural filtering, and closed-bar confirmed entries — one chart, one workflow from micro-swings to macro-cycles. This is not a blind signal product. It is a structure-first workflow for traders who care about location, context, and timing. V2 Launch Offe
Öncelikle, bu Ticaret Aracının Non-Repainting, Non-Redrawing ve Non-Lagging Gösterge olduğunu vurgulamakta fayda var, bu da onu profesyonel ticaret için ideal hale getiriyor. Çevrimiçi kurs, kullanıcı kılavuzu ve demo. Akıllı Fiyat Hareketi Kavramları Göstergesi, hem yeni hem de deneyimli tüccarlar için çok güçlü bir araçtır. İleri ticaret fikirlerini, Inner Circle Trader Analizi ve Smart Money Concepts Ticaret Stratejileri gibi 20'den fazla kullanışlı göstergeyi bir araya getirerek bir araya
RelicusRoad Pro: Kantitatif Piyasa İşletim Sistemi ÖMÜR BOYU ERİŞİMDE %70 İNDİRİM (SINIRLI SÜRE) - 2.000+ TRADER'A KATILIN Neden çoğu trader "mükemmel" indikatörlere rağmen başarısız olur? Çünkü tekil kavramları boşlukta trade ederler. Bağlamı olmayan bir sinyal kumardır. Sürekli kazanmak için KONFLÜANS (UYUM) gerekir. RelicusRoad Pro basit bir ok indikatörü değildir. Tam bir Kantitatif Piyasa Ekosistemi dir. Tescilli volatilite modellemesini kullanarak fiyatın ilerlediği "Adil Değer Yolu"nu har
Önce dürüst olalım. Hiçbir gösterge tek başına sizi kârlı yapmaz. Eğer biri size aksini söylüyorsa, size bir hayal satıyordur. Mükemmel al/sat okları gösteren her gösterge, kusursuzmuş gibi görünecek şekilde yapılabilir — sadece geçmişin doğru bir bölümünü yakınlaştırıp kazanan işlemleri ekran görüntüsü almanız yeterlidir. Biz bunu yapmıyoruz.  SMC Intraday Formula bir araçtır. Piyasa yapısını sizin için okur, en yüksek olasılıklı fiyat bölgelerini belirler ve şu anda akıllı paranın izinin nası
Trend indicator AI mt5
Ramil Minniakhmetov
5 (17)
Trend Ai göstergesi, trend tanımlamasını işlem yapılabilir giriş noktaları ve geri dönüş uyarılarıyla birleştirerek bir yatırımcının piyasa analizini geliştirecek harika bir araçtır. Bu gösterge, kullanıcıların forex piyasasının karmaşıklıklarında güvenle ve hassasiyetle yol almalarını sağlar. Birincil sinyallerin ötesinde, Trend Ai göstergesi geri çekilmeler veya düzeltmeler sırasında ortaya çıkan ikincil giriş noktalarını belirleyerek, yatırımcıların belirlenen trend içindeki fiyat düzeltmele
Top indicator for MT5   providing accurate signals to enter a trade without repainting! It can be applied to any financial assets:   forex, cryptocurrencies, metals, stocks, indices .  Watch  the video  (6:22) with an example of processing only one signal that paid off the indicator! MT4 version is here It will provide pretty accurate trading signals and tell you when it's best to open a trade and close it. Most traders improve their trading results during the first trading week with the help of
Market Structure Order Block Dashboard MT5, piyasa yapısını ve ana fiyat reaksiyon bölgelerini doğrudan grafikte okumak isteyen traderlar için tasarlanmış bir MT5 göstergesidir. BOS, ChoCH, Order Blocks, Fair Value Gaps (FVG), Likidite, Kill Zones, Volume Profile ve hızlı analiz için kompakt bir paneli bir araya getirir. Bu gösterge, piyasa yapısını, ICT ve Smart Money kavramlarını karar çerçevesi olarak kullanan traderlara yöneliktir. Trend devamlarını, olası tersine dönüşleri, fiyat dengesizli
Smart Stop Indicator – Stop-loss düzeylerini doğrudan grafikte akıllı ve hassas şekilde belirleyin Genel Bakış Smart Stop Indicator, stop-loss seviyesini tahmin ederek veya sezgilere güvenerek değil, net ve sistematik bir şekilde belirlemek isteyen traderlar için özel olarak geliştirilmiştir. Bu araç, klasik price-action mantığını (yükselen tepeler, düşen dipler) modern breakout algılama ile birleştirerek bir sonraki mantıklı stop seviyesini belirler. Trendlerde, yatay piyasalarda veya hızlı k
Crystal Heikin Ashi Signals
Muhammad Jawad Shabir
5 (2)
Crystal Heikin Ashi Signals - Professional Trend & Signal Detection Indicator Advanced Heikin Ashi Visualization with Intelligent Signal System for Manual & Automated Trading Final Price: $149 ---------> Price goes up $10 after every 10 sales . Limited slots available — act fast . Overview Crystal Heikin Ashi Signals is a professional-grade MetaTrader 5 indicator that combines pure Heikin Ashi candle visualization with an advanced momentum-shift detection system. Designed for both manual traders
Bill Williams Advanced
Siarhei Vashchylka
5 (11)
Bill Williams Advanced is designed for automatic chart analysis using Bill Williams' "Profitunity" system. The indicator analyzes four timeframes at once. Manual (Be sure to read before purchasing) Advantages 1. Analyzes the chart using Bill Williams' "Profitunity" system. Signals are displayed in a table in the corner of the screen and on the price chart. 2. Finds all known AO and AC signals, as well as zone signals. Equipped with a trend filter based on the Alligator. 3. Finds "Divergence Bar
ARICoins
Temirlan Kdyrkhan
ARICoin is a powerful trading companion designed to generate high-probability entry signals with dynamic TP/SL/DP levels based on volatility. Built-in performance tracking shows win/loss stats, PP1/PP2 hits, and success rates all updated live. Key Features: Buy/Sell signals with adaptive volatility bands Real-time TP/SL/DP levels based on ATR Built-in MA Filter with optional ATR/StdDev volatility Performance stats panel (Success, Profit/Loss, PP1/PP2) Alerts via popup, sound, push, or email Cust
Market Structure Patterns
Samuel Manoel De Souza
4.47 (19)
Market Structure Patterns ,   smart money concepts   (akıllı para kavramları) temelinde geliştirilen ve   SMC/ICT   öğelerini grafik üzerinde gösteren bir göstergedir. Bu öğeler, işlem kararlarınızı bir üst seviyeye taşımanıza yardımcı olur. Grafikte bir unsur oluştuğunda, fiyat bir seviyeyi geçtiğinde veya bir kutu/bölgeye girdiğinde,   uyarılar ,   bildirimler   ve   e-posta mesajları   aracılığıyla anında bilgilendirilirsiniz. Geliştiriciler,   global variables   (küresel değişkenler) aracıl
IX Power MT5
Daniel Stein
4.92 (13)
IX Power: Endeksler, Emtialar, Kripto Paralar ve Forex Piyasaları için İçgörüler Genel Bakış IX Power , endeksler, emtialar, kripto paralar ve forex sembollerinin gücünü analiz etmek için tasarlanmış çok yönlü bir araçtır. FX Power , tüm kullanılabilir döviz çiftlerinin verilerini kullanarak döviz çiftleri için maksimum doğruluk sağlarken, IX Power yalnızca temel sembolün piyasa verilerine odaklanır. Bu, IX Power 'ı forex dışındaki piyasalar için ideal ve daha basit forex analizleri için güven
Yazarın diğer ürünleri
This is the MT5 Ichimoku Dashboard. This dashboard will scan multiple timeframes in MT5 platform, from M1 chart to D1 chart. It will send the buy/sell signals by alert on the platform or sending notification to your phone or message you via a email. The buy/sell signal can be set by cross of multiple lines: ex: tenkan-sen line, kijun-sen line, the cloud or you can select the price to cross or above/below the kumo cloud... Please discovery in the input setting, You can find the rule that you are
Stochastic Crossover Dashboard Pro uses the value of Stochastic indicator. The Stochastic's parameters can be adjusted via the Edit boxes of this dashboard. The monitoring pairs will be selected by adding to the Market Watch (no need to set  prefixes or suffixes) , you can monitor many pairs as you like. This dashboard will check almost popular time frame (M1,M5,M15,M30,H1,H4 and D1). The colors can be customized. The parameters of Stochastic can be set at the input. Crossover signal can be sent
This small trading tool will send all your trading information to your Telegram channel. It is very simple to use. Please see at the below video to know how install it on your MT4 platform. To use this tool, you need following information: * Your Bot token * Your Telegram channel name. Note: this tool will not touch your trading order. It only send your trading information to your telegram channel for all member can know.
Daklak MT4
The Huy Phan
5 (1)
Daklak MT4  is a EA which use the martingale strategy. This EA has been tested for 20 years historical data with good result and acceptable drawdown. Note: 1. The default setting is set for AUDUSD 30M chart. 2. Minimum deposit: $1000 3. Account type: Hedging Account Parameters  Lot Size per 1000=0.01- Mean the starting lot size will be 0.01 per 1000 unit balance. (ex: if the balance is $3000, the first trade lot size will be 0.01)  Start Distance Rate=5.0- Mean the distance rate of the first
WPR Dashboard  uses the value of William's Percent Range indicator. The parameters can be adjusted via the Edit boxes of this dashboard. The monitoring pairs will be selected by adding to the Market Watch (no need to set  prefixes or suffixes) , you can monitor many pairs as you like. This dashboard will check almost popular time frame (M1,M5,M15,M30,H1,H4 and D1). The colors can be customized. We can have a look at many pairs and many time frames without opening the chart. In addition, we can
RSI Dashboard  uses the value of Relative Strength Index indicator. The parameters can be adjusted via the Edit boxes of this dashboard. The monitoring pairs will be selected by adding to the Market Watch (no need to set  prefixes or suffixes) , you can monitor many pairs as you like. This dashboard will check almost popular time frame (M1,M5,M15,M30,H1,H4 and D1). The colors can be customized. We can have a look at many pairs and many time frames without opening the chart. In addition, we can
Serepok MT4
The Huy Phan
Serepok MT4 is a trending following EA. This EA uses a custom indicators to detect entry signal. The fixed stop loss and take profit are always set for each trade. This EA has smart money management. Users only need to determine the accepted loss for each trade, EA will calculate the lot size for each trade according to stop loss price. Therefore, this EA is very safe. This EA is very easy to use and can apply for many currency pairs. Recommended time frame is H1. Note: 1. Please do back testi
Aroon crossover Dashboard uses the value of Aroon indicator. The Aroon period can be adjusted via the Edit box of this dashboard. The monitoring pairs will be selected by adding to the Market Watch (no need to set  prefixes or suffixes) , you can monitor many pairs as you like. This dashboard will check almost popular time frame (M1,M5,M15,M30,H1,H4 and D1). The colors can be customized. The Aroon indicator has been included in to this Dashboard, you do not need purchasing it. Crossover signal c
MAs Crossover Dashboard Pro uses the value of Moving Average indicator. The periods of 2 MAs can be adjusted via the Edit boxes of this dashboard. The monitoring pairs will be selected by adding to the Market Watch (no need to set  prefixes or suffixes) , you can monitor many pairs as you like. This dashboard will check almost popular time frame (M1,M5,M15,M30,H1,H4 and D1). The colors can be customized. The parameter of MAs can be set at the input. Crossover signal can be sent to you screen, yo
Stochastic Crossover Dashboard Pro uses the value of Stochastic indicator. The Stochastic's parameters can be adjusted via the Edit boxes of this dashboard. The monitoring pairs will be selected by adding to the Market Watch (no need to set  prefixes or suffixes) , you can monitor many pairs as you like. This dashboard will check almost popular time frame (M1,M5,M15,M30,H1,H4 and D1). The colors can be customized. The parameters of Stochastic can be set at the input. Crossover signal can be sent
Eakao is a trending following EA. This EA uses some custom indicators to detect entry signal. There are 2 trades opened per signal, one trade has fixed take profit, EA will use breakeven and trailing stop for another trade. The fixed stop loss and take profit are always set for each trade. Beside stop loss, this EA uses an exit indicator to exit the trade before stop loss or take profit are triggered. This EA has smart money management. Users only need to determine the accepted loss for each tr
Bollinger Bands Multi Dashboard MT4 uses the value of Bollinger Bands indicator. This dashboard will monitor all symbols in the market watch. We can set up to receive an alert, notification or an email when the buy/sell signal appear on each timeframe. You can check all symbols via only 1 chart. This dashboard will check almost popular time frame (M1,M5,M15,M30,H1,H4 and D1). The colors can be customized. We can have a look at many pairs and many time frames without opening the chart. In additio
This is the MT4 Ichimoku Dashboard. This dashboard will scan multiple timeframes in MT5 platform, from M1 chart to D1 chart. It will send the buy/sell signals by alert on the platform or sending notification to your phone or message you via a email. The buy/sell signal can be set by cross of multiple lines: ex: tenkan-sen line, kijun-sen line, the cloud or you can select the price to cross or above/below the kumo cloud... Please discovery in the input setting, You can find the rule that you are
This is the ADX Dashboard MT5. This dashboard will scan multiple timeframes in MT4 platform, from M1 chart to D1 chart. It will send the buy/sell signals by alert on the platform or sending notification to your phone or message you via a email. The buy signal is the cross over of DI+ and DI- The sell signal is the cross under of DI+ and DI-. The up trend color will be displayed when DI+ is greater than DI- The down trend color will be displayed when DI+ is less than DI- The value of ADX value wi
This is the Super Trend Dashboard MT4. This dashboard will scan multiple timeframes in MT4 platform, from M1 chart to D1 chart. It will send the buy/sell signals by alert on the platform or sending notification to your phone or message you via a email. The buy signal is generated when the super trend line flip from SELL to BUY. The sell signal is   is generated when the super trend line flip from BUY to SELL. The up trend color will be displayed depending on the current Super Trend value.
This is the Heiken Ashi Dashboard MT4. This dashboard will scan multiple timeframes and symbols in MT4 platform, from M1 chart to D1 chart. It will send the buy/sell signals by alert on the platform or sending notification to your phone or message you via a email. The buy signal is generated when the heiken ashi bar changes its color from red to white. The sell signal is   is generated  when the heiken ashi bar changes its color from white to red. The up/down trend color will be displayed depend
This is the Parabolic Dashboard MT4. This dashboard will scan multiple timeframes and symbols in MT5 platform, from M1 chart to D1 chart. It will send the buy/sell signals by alert on the platform or sending notification to your phone or message you via a email. The buy signal is generated when the SAR changes its position from above to below of the candle. The sell signal is   is generated  when   the SAR changes its position from below to above of the candle. The up/down trend color will be di
Daklak MT5
The Huy Phan
5 (1)
Daklak MT5  is a EA which use the martingale strategy. This EA has been tested for 20 years historical data with good result and acceptable drawdown. Note: 1. The default setting is set for AUDUSD 30M chart. 2. Minimum deposit: $1000 3. Account type: Hedging Account Parameters  Lot Size per 1000=0.01- Mean the starting lot size will be 0.01 per 1000 unit balance. (ex: if the balance is $3000, the first trade lot size will be 0.01)  Start Distance Rate=5.0- Mean the distance rate of the first
WPR Dashboard  uses the value of William's Percent Range indicator. The parameters can be adjusted via the Edit boxes of this dashboard. The monitoring pairs will be selected by adding to the Market Watch (no need to set  prefixes or suffixes) , you can monitor many pairs as you like. This dashboard will check almost popular time frame (M1,M5,M15,M30,H1,H4 and D1). The colors can be customized. We can have a look at many pairs and many time frames without opening the chart. In addition, we can
RSI Dashboard  uses the value of Relative Strength Index indicator. The parameters can be adjusted via the Edit boxes of this dashboard. The monitoring pairs will be selected by adding to the Market Watch (no need to set  prefixes or suffixes) , you can monitor many pairs as you like. This dashboard will check almost popular time frame (M1,M5,M15,M30,H1,H4 and D1). The colors can be customized. We can have a look at many pairs and many time frames without opening the chart. In addition, we can
Serepok MT5
The Huy Phan
Serepok MT5 is a trending following EA. This EA uses a custom indicators to detect entry signal. The fixed stop loss and take profit are always set for each trade. This EA has smart money management. Users only need to determine the accepted loss for each trade, EA will calculate the lot size for each trade according to stop loss price. Therefore, this EA is very safe. This EA is very easy to use and can apply for many currency pairs. Recommended time frame is H1. Note: 1. Please do back testi
Aroon crossover Dashboard uses the value of Aroon indicator. The Aroon period can be adjusted via the Edit box of this dashboard. The monitoring pairs will be selected by adding to the Market Watch (no need to set  prefixes or suffixes) , you can monitor many pairs as you like. This dashboard will check almost popular time frame (M1,M5,M15,M30,H1,H4 and D1). The colors can be customized. The Aroon indicator has been included in to this Dashboard, you do not need purchasing it. Crossover signal c
MAs Crossover Dashboard Pro uses the value of Moving Average indicator. The periods of 2 MAs can be adjusted via the Edit boxes of this dashboard. The monitoring pairs will be selected by adding to the Market Watch (no need to set  prefixes or suffixes) , you can monitor many pairs as you like. This dashboard will check almost popular time frame (M1,M5,M15,M30,H1,H4 and D1). The colors can be customized. The parameter of MAs can be set at the input. Crossover signal can be sent to you screen, yo
Eakao is a trending following EA. This EA uses some custom indicators to detect entry signal. There are 2 trades opened per signal, one trade has fixed take profit, EA will use breakeven and trailing stop for another trade. The fixed stop loss and take profit are always set for each trade. Beside stop loss, this EA uses an exit indicator to exit the trade before stop loss or take profit are triggered. This EA has smart money management. Users only need to determine the accepted loss for each tr
Set and Forget EA is a trending following Expert Advisor. Basically, this EA uses Price Action method to determine the trend then take the trades at the pull back. The pattern has been tested since 2004 and show a good result. The default setting is set to trade 33 symbols (32 forex pairs and XAUUSD). Please delete the symbol that you do not want to trade in the setting. For each entry signal, EA will open 2 trade with Stop Loss and 2 Take Profit. When first trade hit take profit, second trade w
Bollinger Bands Multi Dashboard MT5 uses the value of Bollinger Bands indicator. This dashboard will monitor all symbols in the market watch. We can set up to receive an alert, notification or an email when the buy/sell signal appear on each timeframe. You can check all symbols via only 1 chart. This dashboard will check almost popular time frame (M1,M2,M3,M4,M5,M6,M10,M12,M15,M20,,M30,H1,H2,H3,H4,H6,H8,H12 and D1) in MT5. The colors can be customized. We can have a look at many pairs and many t
This is the ADX Dashboard MT5. This dashboard will scan multiple timeframes in MT5 platform, from M1 chart to D1 chart. It will send the buy/sell signals by alert on the platform or sending notification to your phone or message you via a email. The buy signal is the cross over of DI+ and DI- The sell signal is the cross under of DI+ and DI-. The up trend color will be displayed when DI+ is greater than DI- The down trend color will be displayed when DI+ is less than DI- The value of ADX value wi
This is the Super Trend Dashboard MT5. This dashboard will scan multiple timeframes in MT5 platform, from M1 chart to D1 chart. It will send the buy/sell signals by alert on the platform or sending notification to your phone or message you via a email. The buy signal is generated when the super trend line flip from SELL to BUY. The sell signal is is generated when the super trend line flip from BUY to SELL. The up trend color will be displayed depending on the current Super Trend value.
This is the Heiken Ashi Dashboard MT5. This dashboard will scan multiple timeframes and symbols in MT5 platform, from M1 chart to D1 chart. It will send the buy/sell signals by alert on the platform or sending notification to your phone or message you via a email. The buy signal is generated when the heiken ashi bar changes its color from red to white. The sell signal is   is generated  when the heiken ashi bar changes its color from white to red. The up/down trend color will be displayed depend
This is the Parabolic Dashboard MT5. This dashboard will scan multiple timeframes and symbols in MT5 platform, from M1 chart to D1 chart. It will send the buy/sell signals by alert on the platform or sending notification to your phone or message you via a email. The buy signal is generated when the SAR changes its position from above to below of the candle. The sell signal is   is generated  when the SAR changes its position from below to above of the candle. The up/down trend color will be disp
Filtrele:
Değerlendirme yok
Değerlendirmeye yanıt