Currencies Strength
- Göstergeler
-
Jinsong Zhang
 MT5 Articles List - Traders' Blogs: https://www.mql5.com/en/blogs/post/90
 - Sürüm: 2.1
- Güncellendi: 20 Kasım 2021
- Etkinleştirmeler: 8
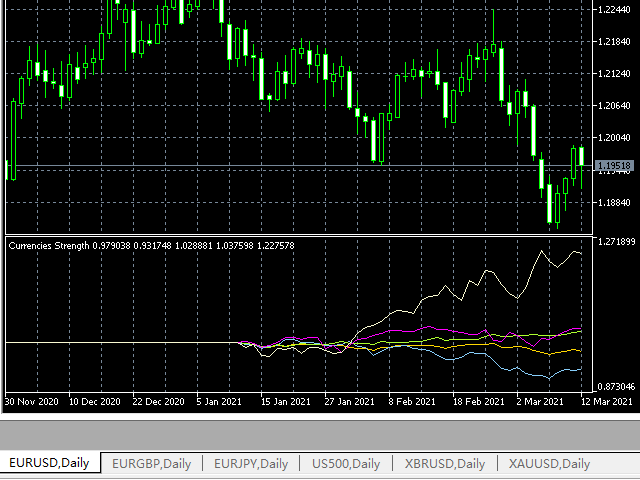
This indicator is used to compare the relative strength of the trade on the chart against the other several selected symbols.
By comparing the price movement of each traded variety based on the same base day, several trend lines of different directions can be seen, reflecting the strong and weak relationship between the several different traded varieties, so that we can have a clearer understanding of the market trend.
For example, you can apply this indicator on a EurUSD chart and compare it with currency pairs EurJPY and EurGBP to see which is stronger.
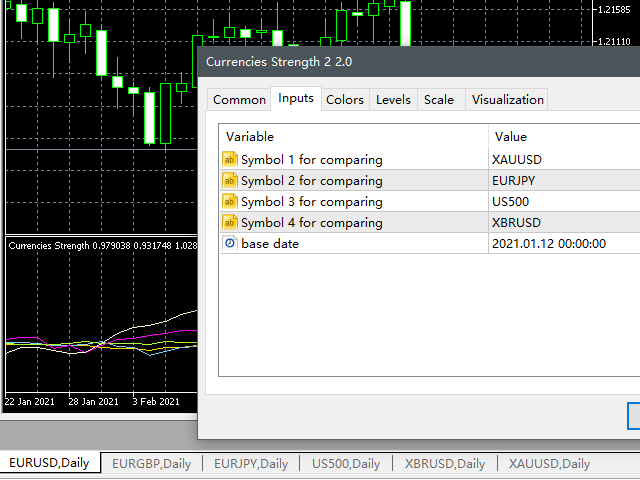
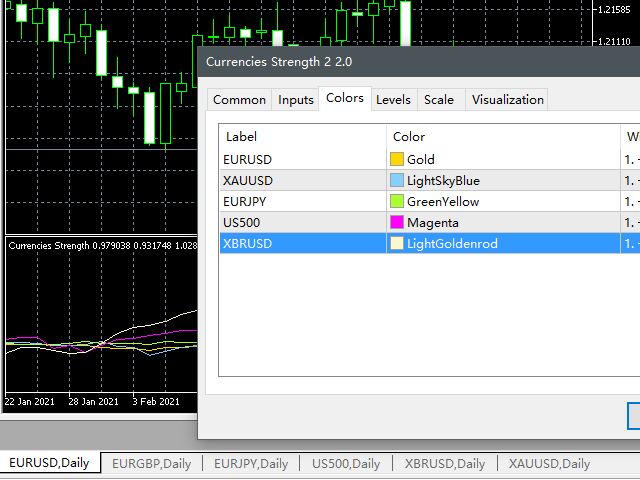
You need to enter parameters for the indicator:
The name of several trading varieties to compare.
You need to select a base date for comparison.
Please note that you should ensure that the historical data of the relevant trading varieties has been downloaded before using the indicator.
The free demo version is: https://www.mql5.com/en/market/product/63921