
Big Trades
- Göstergeler
- Sürüm: 4.3
- Güncellendi: 1 Ekim 2026
- Etkinleştirmeler: 5

Big Trades
Big Trades is an order flow indicator for MetaTrader 5. It detects large aggressive trades from the tick stream and displays them on the chart as coloured bubbles. The indicator is designed for both CFD and futures instruments.
How It Works
MetaTrader 5 does not include native order flow tools. On CFD feeds there is no consolidated tape, and on many instruments there is no real traded volume at all. Big Trades works with what each feed provides.
When an instrument carries real trade prints, the indicator uses real volume. When it does not, the indicator reconstructs aggressive buy and sell pressure from the quote stream and ranks each detected event against a rolling baseline of recent activity on the same symbol. The same build handles both feed types, so the indicator can be used on futures contracts with genuine volume and on CFD instruments without it. The operating mode can also be selected manually.
Detected events are scored relative to the current symbol and session. A quiet EURUSD hour and a volatile index open are judged against their own recent activity, not against a fixed threshold. Confirmed signals do not repaint. The indicator does not use look-ahead logic, external data feeds, or DLLs.
How to Use It
Big Trades is a confirmation tool. It is intended to be used alongside price structure, key levels, and the trader's own analysis.
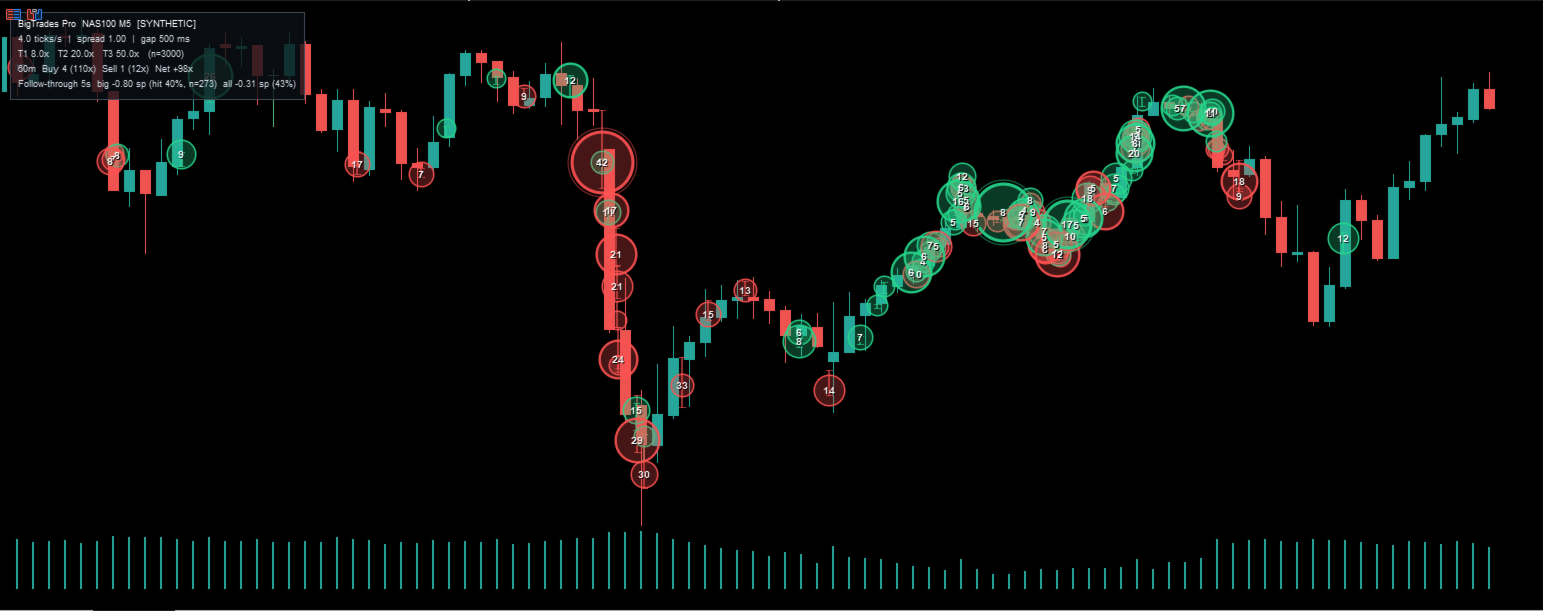
Large trades in the direction of a breakout suggest the move is backed by real participation rather than thin retail flow. A cluster of large trades near support or resistance indicates active interest at that level. A same-direction large trade during a retracement can help align an entry with the trend. The dashboard also reports how the market behaves in the seconds after a large trade is detected, which allows the trader to check whether large events on a given feed behave differently from ordinary events.
Allow the indicator a few minutes on a fresh chart or symbol to establish its baseline before acting on signals. The dashboard shows the current warm-up state.
Display and Dashboard
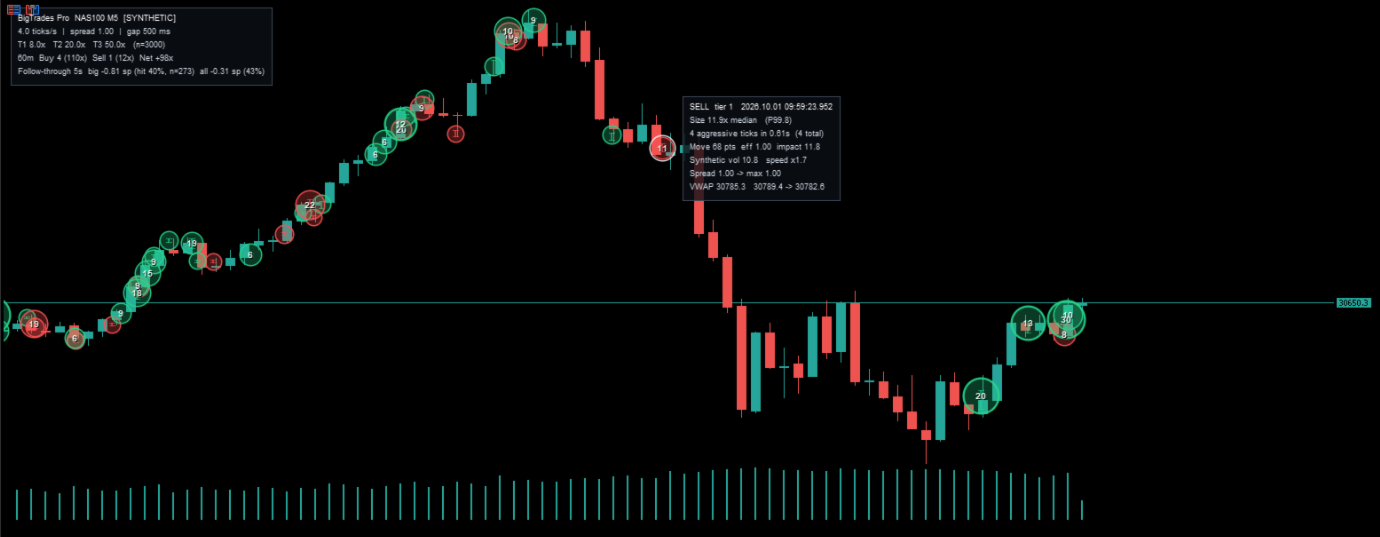
Detected events are plotted as bubbles. Blue bubbles represent buy-side trades and red bubbles represent sell-side trades. Bubble size shows how large the event was relative to normal activity for that symbol. Bubble ring weight increases with the event tier.
An optional on-chart dashboard shows the current operating mode, market activity level, median spread, threshold tiers, and rolling buy and sell activity for a configurable window. It also reports a follow-through statistic for verifying the indicator on a specific broker feed.
Hovering or touching a bubble opens an information panel with the full breakdown of that event, including its size relative to the median, percentile rank, number of aggressive ticks, duration, directional efficiency, price impact, and VWAP.
Alerts and CSV Export
Alerts can be triggered for trades at or above a chosen tier. Popup, sound, and push notification delivery can be enabled independently. A minimum interval between alerts prevents flooding during fast markets.
Every detected event can also be exported to a CSV file in MQL5/Files for external analysis. This is useful for validating the indicator on a specific broker feed, performing statistical research, or integrating the output with other tools.
Input Parameters
The indicator provides input parameters for data handling, detection, scoring, thresholds, display, alerts, and export.
Data inputs control the operating mode, the amount of history to reconstruct, the warm-up period before detection begins, the live update interval, and the history load settings.
Detection inputs control the minimum number of aggressive ticks required per event, the minimum distance for an event to qualify, the maximum allowed gap between aggressive ticks, the maximum event duration, the maximum retracement allowed inside an event, the spread filter that ignores abnormal quotes, and the session reset settings.
Scoring inputs set the weights of impact, speed, and directional efficiency, along with the baseline window, the refresh interval, the number of events kept for ranking, and the minimum number of samples required before signals begin.
Threshold inputs select either percentile-based or multiple-based mode and set the Tier 1, Tier 2, and Tier 3 boundaries.
Display inputs control colours, bubble fill and ring transparency, minimum and maximum bubble radius, the size range mapped to bubble radius, label content and font size, bubble anchor point, span line, forming-event preview, minimum tier to display, maximum bubbles drawn, dashboard position, and hover tooltip.
Alert inputs set the alert tier threshold, the delivery methods, and the minimum interval between alerts. Export inputs set the follow-through horizon and enable or disable CSV export.
Integration and Specifications
The indicator exposes four buffers per chart bar for use in Expert Advisors: Big Buy, Big Sell, Big Net, and Big Count. They are retrieved with iCustom and CopyBuffer.
Example:
int h = iCustom(_Symbol, _Period, "Big Trades");
double net[];
CopyBuffer(h, 2, 1, 1, net); // last closed bar
Platform: MetaTrader 5.
Market: CFDs and futures. Indices, FX, metals, energies, and cryptocurrency CFDs.
Recommended timeframes: M5 to H1. The indicator works on any timeframe.
Repainting: confirmed signals do not repaint. The optional forming-event preview is provisional by design.
Look-ahead: none.
External dependencies: none.
License: one-time purchase with lifetime updates.
Quick Start
Copy the indicator to MQL5/Indicators, compile it in MetaEditor, and attach it to any chart. On load, the indicator replays the configured history window. The terminal downloads missing tick history itself.
To show more or fewer bubbles, adjust the Tier 1 threshold. Tier 2 and Tier 3 follow the same pattern. If events split in two or merge into one, adjust the gap and duration settings. On feeds that produce frequent small fluctuations, raise the minimum aggressive tick count. Hover a bubble for the full breakdown of that event. Enable CSV export to analyse detected events in an external tool.
Important Notes
On CFD feeds without real volume, the reported size is a multiple of the median event on that symbol, not a lot or contract count. The chart label 12x means twelve times the median event, not twelve lots.
Use the follow-through statistic on the dashboard to validate the indicator on the broker feed before relying on it. If large events do not outperform all events in that statistic, tighten the thresholds or try a different symbol.
Big Trades is an analysis and visualisation tool. It does not provide financial advice, does not guarantee any trading result, and does not place trades. Trading involves risk. Past behaviour of any indicator on any feed is not indicative of future results. Use the indicator as one component of a complete trading approach with proper risk management.

































Good indicator helps me stay with the order flow. I use indicator settings with little higher sensitivity compared to the default value for NAS100 to get better trades.