SFT Gravity Line
- Göstergeler
-
Artem Kuzmin
 ALL PRODUCTS ▶️ https://www.mql5.com/ru/users/zombiezorrofx/seller
🔥 Maximum commission discounts:
💠 Binance 35% (trading bypassing sanctions) - Sürüm: 1.0
- Etkinleştirmeler: 5
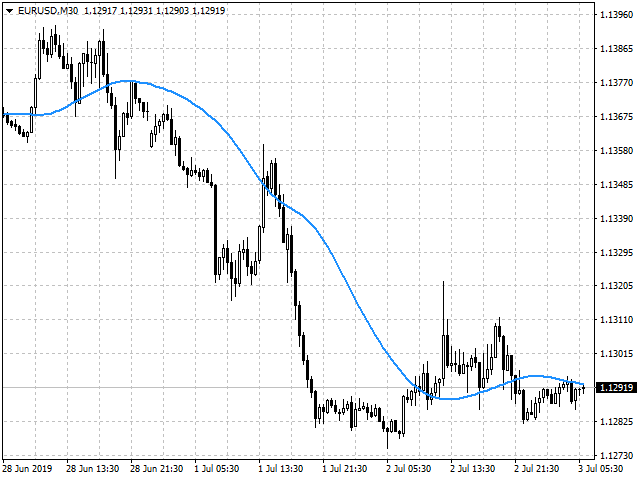
The gravity line indicator to which the price always returns.
This is a kind of center of attraction and a magnet for price.
Allows you to trade on the trend and on pullbacks.
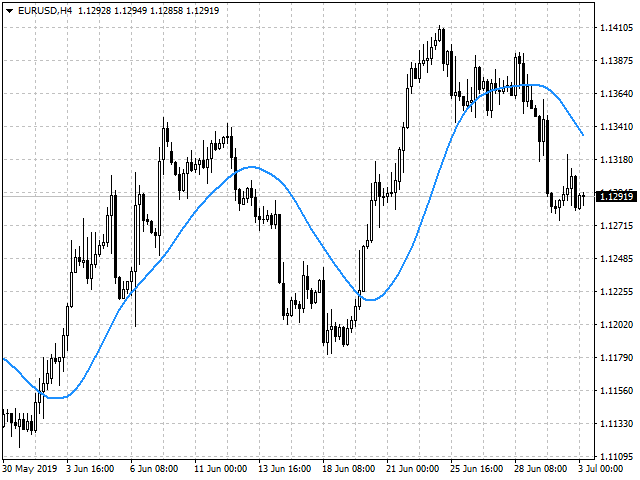
It works on all timeframes, on any currency pairs, metals and cryptocurrency
Can be used when working with binary options
Distinctive features
- Does not redraw its values;
- Price always returns to the line of gravity;
- Based on the laws of balance;
- It has simple and clear settings;
- It works on all timeframes and on all symbols;
- Suitable for trading currencies, metals, options and cryptocurrency (Bitcoin, Litecoin, Ethereum, etc.);
- Suitable for manual trading and for developing advisers;
For more accurate inputs and additional confirmation signals can be used in conjunction with other indicators.
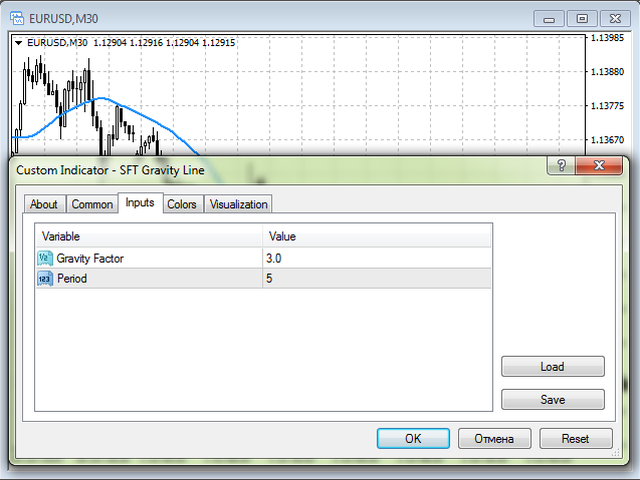
Indicator settings
- Gravity Factor - Gravity algorithm coefficient;
- Period - indicator calculation period;
Trading Recommendations
- The direction of the transaction should correspond to the slope of the indicator line.
- When the indicator crosses the price from top to bottom, only Sell or Put (for options) positions are considered.
- When the indicator crosses the bottom-up, only Buy or Call (for options) positions are considered.
- Exit from the transaction on the reverse intersection of the line or on the established SL and TP.
- When using SL and TP, it is advisable to set the SL for the nearest extremum, TP = 1..2 SL.
Well proven in collaboration with the free indicator SFT Bullet Arrow
For more information and a more detailed overview of trading methods see here:
Trading strategy with SFT Gravity Line
We wish you a stable and profitable trade.
Thank you for using our software.
If you like it, then do a good deed and share the link with your friends.
Not to miss the release of new useful programs for trading - add as a friend: SURE FOREX TRADING


Kullanıcı değerlendirmeye herhangi bir yorum bırakmadı