Fibrelay OTE Fibonacci

  • Göstergeler
  • Markus Hentschel
    Markus Hentschel
    I build tools for MetaTrader 5: market structure, volume profile, liquidity, sessions, risk and trade management. Most of them have a free version.

    I trade with my own Expert Advisors and build the tools I need myself. Questions about MQL5 or my tools are welcome - just send me a message.
  • Sürüm: 1.0
  • Etkinleştirmeler: 5

Every impulse. Its OTE zone. No hand-drawn Fibonacci.

Fibrelay OTE Fibonacci reads the swing structure of your chart and, after every break of structure (BOS) or change of character (CHoCH), draws the Fibonacci of the impulse wave that caused it: premium and discount with the 50 % line, the OTE zone (optimal trade entry, 61.8 - 78.6 % by default) and two extension targets (-27 % and -62 %). Each zone carries a status - fresh, touched or violated - so you see at a glance what price has already done there. A calm panel shows the direction, the last wave, the distance to the OTE and the direction of H1, H4 and D1.

It is an analysis tool. It does not open trades and it does not give buy or sell signals.

What You See On The Chart

  • The impulse wave as a dashed line from its start (100 %) to its extreme (0 %).
  • BOS / CHoCH: the broken swing level with a small label. CHoCH is drawn dashed.
  • Premium (upper half) and discount (lower half) as soft shading, with the 50 % line and its price.
  • OTE zone as a gold box with both edges, an optional middle line (70.5 %) and the status in the label: "OTE · fresh", "OTE · touched", "OTE · violated".
  • Extension targets -27 % and -62 % (both adjustable). A reached target gets a tick.
  • Up to 10 earlier waves, drawn faded, so you can see how the last zones worked out.
  • All labels sit at the right end of the levels, with price, and avoid each other and the panel.

How It Is Defined

Swing point: a candle whose high (low) is higher (lower) than the N candles before it and not exceeded by the N candles after it (N = swing strength, 5 by default). It is confirmed when those N candles have closed.

BOS / CHoCH: a candle CLOSES beyond the last confirmed swing high or low. In the direction of the current structure it is a BOS, against it a CHoCH. After a break, the start of the impulse becomes the swing to watch on the other side.

Impulse wave: 100 % is the lowest low (bullish) or highest high (bearish) between the broken swing and the break candle. 0 % is the extreme of the move. The 0 % point follows new extremes until price first retraces to the 50 % line; from that candle on the whole Fibonacci is fixed and does not move again.

Zone status: fresh = no closed candle has traded into the zone; touched = a closed candle reached it; violated = a candle closed beyond its far edge (OTE: beyond 78.6 %; discount / premium: beyond 100 %, which also ends the wave as invalid).

Targets: -27 % and -62 % of the wave measured beyond 0 %, checked once the Fibonacci is fixed.

A new BOS or CHoCH starts the next wave; the previous one is kept faded (setting "Earlier waves drawn").

Panel

  • Direction: bullish / bearish, last BOS or CHoCH with price and candles ago.
  • Last wave: start and end price, size in points and in ATR, state (extending / fixed / ended / invalid) and the current retracement in %.
  • OTE: price range, status chip, distance from the price to the OTE in points and in ATR, or "price is inside the OTE".
  • Premium / discount: where the price is now, the 50 % price and the status of the discount (bullish wave) or premium (bearish wave) zone.
  • Extension targets with prices and ticks.
  • Higher timeframes: direction of H1, H4 and D1 from the same swing logic on closed candles, with "OTE" when the price is inside the active OTE of that timeframe.
  • Switch bar: Fib, OTE, 50 %, targets and history on / off with one click. Drag the panel, collapse it, size 90 - 150 %, automatic DPI scaling. Dark and light colours follow your chart. English / German.

Alerts

Popup, sound, push and e-mail when price enters the OTE zone (on by default), and optionally on a new BOS / CHoCH and on a reached target. Each alert fires once per wave, on a closed candle.

No Repainting On Closed Candles

Every candle is processed once, in time order, after it has closed. Swing points appear N candles after the swing and are never moved. The only thing that moves is the 0 % point of the running wave while price makes new extremes and has not yet reached 50 % - this is stated in the label ("extending"). After that, only the status of a zone changes.

Checked before release: a replay self test on 8 symbol / timeframe combinations (EURUSD M15, H1, H4, XAUUSD M15, H1, GBPUSD H4, USDJPY H1, GBPJPY H1; 1,600 closed candles each). History cut at 20 points against the full history: 0 differences in the state and in every event. Every one of the 616 waves recounted by brute force from the raw candles (swing, break close, 100 % and 0 % point, the candle that fixed the Fibonacci, OTE touched / violated, target, invalid): 0 deviations. Strategy Tester runs like the Market check (M1 to D1, Pro and One): no errors.

Quick Start

1. Attach Fibrelay OTE Fibonacci to any chart from M1 to D1. The defaults work on forex, metals, indices and crypto.

2. More or fewer waves: swing strength 3 gives more, smaller waves; 8 - 10 gives fewer, larger ones.

3. Your OTE: set start and end in % (for example 62 / 79 or 70.5 / 79).

4. Switch on the alerts you need. Push needs the MetaQuotes ID in the terminal settings.

Good To Know (honest limits)

  • An analysis tool, not a signal service. A Fibonacci zone describes where price retraced in the past; it does not predict a reaction. No result is promised. Trading leveraged products carries a high risk of loss.
  • A swing is confirmed N candles late, so a BOS cannot be shown before that.
  • The multi-timeframe row needs history of H1, H4 and D1; while it loads it shows "loading".
  • No DLL, no web requests, no files. 1,500 candles by default, only new closed candles are calculated.

Input Parameters

General: language, bars to analyse (1500), colour theme, label font size (8), zone opacity (60 %). Structure: swing strength (5), mark BOS / CHoCH, impulse wave line. Fibonacci: OTE start (61.8) and end (78.6), OTE middle line, premium / discount shading, extension targets on / off, target 1 (27) and target 2 (62), earlier waves drawn (2). Panel: on / off, position X / Y, size, DPI scaling, multi-timeframe row. Alerts: OTE entry, BOS / CHoCH, target, popup, sound, sound file, push, e-mail. Colours: bullish, bearish, OTE, levels, targets.

Önerilen ürünler
My Point MT5
Claudia Ramona Angerer
Diagnosis of major and minor pivot Trend detection with many signals Can be used in all symbols Can be used in all time frames Settings: Back Show: The number of candles it displays If you need any adjustments, or have any questions or suggestions, message me How to trade: Blue: sell signal Red: buy signal Blue and red at the same time: no signal Exit signal: Opposite signal
Bir seviye çizin ve takip başladıktan sonra fiyatın bu seviyeye nasıl tepki verdiğini gözlemleyin. MetaTrader 5 için Support Resistance Price Action, çizdiğiniz yatay çizgiler, dikdörtgen bölgeler ve trend çizgileriyle çalışır. Temasları, seviyeden dönüşleri ve kırılımları kaydeder; sonraki fiyat hareketinin istatistiklerini toplar. Grafikte bir nesne oluşturun, seçin ve Track düğmesine basın. Gösterge, nesnenin geometrisini ve etkinleştirme zamanını kaydeder. Bu andan önceki olaylar, seviyenin
BOS CHOCH STRUCTURE DETECTOR BOS CHOCH STRUCTURE DETECTOR, Break of Structure (BOS) ve Change of Character (CHoCH) olaylarını doğrudan grafik üzerinde tespit etmek ve görsel olarak göstermek için tasarlanmış bir MetaTrader 5 piyasa yapısı göstergesidir. Gösterge, yapılandırılabilir bir Swing Lookback dönemi kullanarak swing zirvelerini ve swing diplerini tespit eder ve ardından fiyat kapanışlarının bu yapısal seviyeleri kırıp kırmadığını izler. Bir yapısal kırılma tespit edildiğinde gösterge, kı
Send me a message so I can send you the setfile Birkaç yapılandırma seçeneği bulunan sağlam robot, Aşağıdaki ekran görüntüsündeki ayarlarla 10 dakikalık bir zaman diliminde BTC ile kullanın. Uzman robotu satın aldığınızda, botu geliştirmeye devam etmek için değişiklik talep etme hakkına sahipsiniz. Temel Özellikler Hareketli Ortalama Geçiş Stratejisi: EA, işlem sinyalleri üretmek için iki hareketli ortalama (MA1 ve MA2) kullanır. Daha hızlı MA'nın (MA1) daha yavaş MA'nın (MA2) üstüne veya
Anubi Terminal MT5
Marco Maria Savella
Anubi Terminal is a professional trade management assistant designed for manual traders who demand precision, speed, and strict risk control. Unlike automated bots, Anubi puts the trader in control, providing a sophisticated interface to execute and manage trades according to institutional-grade risk management rules. Why Anubi Terminal? Manual trading often fails due to calculation errors and emotional exits. Anubi eliminates these risks by automating position sizing and trade management based
NeuronStructure reads market structure the way a desk does and labels every event on the exact closed bar that confirmed it, so what you see now is what you would have seen then. It is an indicator for chart analysis only: it draws on the chart, it does not place, modify or close trades, it does not send orders, and it does not manage positions or accounts. It is the market-structure companion to NeuronLiquidity, built to sit alongside it: structure tells you the framework and bias, liquidity te
Percent Range PRO
Esmelindro Gedeao Rios Jacobsen
Percent Range PRO Professional percentage-based intraday levels for precision Day Trading. Automatically projects key expansion, support, resistance and exhaustion zones from the previous daily close. Designed for traders who use context and confluence with: • VWAP • Moving Averages • Fibonacci • Price Action • Support & Resistance Works across multiple markets: • Indices • Forex • Gold • Crypto • Futures Automatic daily levels Clean professional visualization MT4 & MT5 compatible Precis
Bu çoklu zaman çerçevesi ve çoklu sembol göstergesi, ikili üst/alt, baş ve omuz, flama/üçgen ve bayrak desenlerini tanımlar. Uyarıları yalnızca bir boyun çizgisi/üçgen/bayrak direği kopması meydana geldiğinde ayarlamak da mümkündür (boyun çizgisi kırılması = üst/alt ve baş ve omuzlar için onaylanmış sinyal).       Gösterge, tekli grafik modunda da kullanılabilir. Lütfen bu seçenek hakkında daha fazla bilgiyi ürünün       blog   Kendi kurallarınız ve tekniklerinizle birlikte bu gösterge, kendi gü
Five Point Turn
Brighton Mufaro Mudzingwa
FiveZero Spike & Trend Engine  The Ultimate Non-Repainting Multi-Asset Signal & Pattern System Take control of the markets with an elite, precision-engineered trading indicator designed to capture explosive market moves with extreme accuracy. Built on the powerful 5-0 Harmonic Pattern Structure (0-X-A-B-C) combined with a real-time Bollinger/Structure Block Engine and Reciprocal Ratio Validation, this tool gives you non-repaint buy and sell signals right at the candle open . Whether you trade Fo
MFOP Market Forecast
Oscar Josue Pin Bacuzoy
Develop this indicator for periods of 30 minutes or more, focus on getting market trends right and making sure they are met. MFOP v8.1 gets straight to the point: it scans the market and tells you exactly when there is enough strength to enter a trade. This indicator doesn't do magic, it uses mathematical algorithms to filter out market noise, not enter into false breakouts and show you clear BUY (blue arrow) and SELL (red arrow) opportunities. It is designed and optimized specifically to take
Most traders buy oversold and sell overbought. This system does the exact opposite — on purpose. In strong trending markets, price can stay overbought or oversold for a very long time. We deliberately enter when the market is already “stretched” because that is exactly when the trend is strongest and most likely to continue. We put a tight Stop Loss (eg. 3 ATR) and hold the position till the trend ends. This is the same style of the famous Turtles traders.
I  recommend you to read the   product's blog  (manual) from start to end so that it is clear from the beginning what the indicator offers. This multi time frame and multi symbol indicator scans for engulfing and tweezer formations.  The indicator can also be used in single chart mode. Combined with your own rules and techniques, this indicator will allow you to create (or enhance) your own powerful system. Features Can monitor all symbols visible in your Market Watch window at the same time. A
Atlantic Wick EURUSD H2 Historical statistics Period: 2023-04-10–2026-09-09 Data split: 70% in-sample / 30% out-of-sample (OOS) Cumulative return over the full period: 23.04% Maximum drawdown: 2.37% Trades: 109 Win rate: 76.15% Profit factor: 2.45 Reference-test risk: 1.00% per trade Broker data: Blueberry Markets Pty Ltd Longest losing streak in the reference test: 2 trades Historical reference backtest of the source strategy; these are not live results. This version defaults to 2.00% risk
KT Tether Line MT5
KEENBASE SOFTWARE SOLUTIONS
The KT Tether Line is a trend-following tool consisting of three indicators that work together to generate trading signals. It can correctly identify market trends while signaling trade entries. It was first introduced by Bryan Strain in the Stock & Commodities magazine in 2000 in "How to get with the trend and out at the end." The Concept When a market trend is confirmed, the most challenging part is determining the timing of the entries. This indicator alerts you to potential trend reversals
Adaptive Math Zones Indicator is a professional MT5 indicator designed to identify high-probability price reaction areas using mathematical price projections and Fibonacci-based channel structures. The indicator automatically builds a reference price channel, highlights neutral zones, and projects future price levels (50%, 100%, and 200%), helping traders visually understand market structure and potential reaction points. This tool is especially effective during ranging and corrective market con
Apex Level MT5
Solomon Ndirangu Macharia
Apex Level MT5 is a high discipline, stable and long term growth momentum EA designed to exploit significant price levels in the market. It doesn't guess where the market might go, it waits for the market to commit to a direction and then follows the flow and by focusing on daily liquidity expansion, the EA avoids the noise of midday trading which results in a cleaner equity curve and high quality setups. EA philosophy Quality over Quantity: The Ea focuses on the most important breakout levels o
Bu çoklu zaman çerçevesi ve çoklu sembol göstergesi, Pin çubukları, Sabah/akşam yıldızları, Yutma, Cımbız, Üç Çizgi Darbesi, İç çubuklar ve Flamalar ve Üçgenler için tarama yapar.   Gösterge, tekli grafik modunda da kullanılabilir. Lütfen bu seçenek hakkında daha fazla bilgiyi ürünün       blog   .       Kendi kurallarınız ve tekniklerinizle birlikte bu gösterge, kendi güçlü sisteminizi oluşturmanıza (veya geliştirmenize) izin verecektir. Özellikleri Piyasa İzleme pencerenizde görünen tüm sembol
MT5'in yenilikçi göstergesi Auto Trendline ile tanışın; bu gösterge, trend çizgisi izleme sürecini otomatikleştirir. Grafiklerinizde trend çizgileri çizmek. Trend çizgilerini elle çizmenin zahmetli ve zaman alıcı işine veda edin. Gerisini Auto Trendline'a bırakın! *Satın alma işleminden sonra   talimatları ve adım adım kılavuzu göndermek için benimle iletişime geçin. Gelişmiş algoritması sayesinde Auto Trendline, trend çizgilerini otomatik olarak algılar ve sizin için çizer. Zaman ve emekten tas
ZigZagAllinOne
Alberto Da Silva Lira
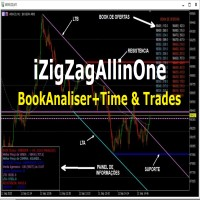
Indicator focusing on the market's ZigZag, also adding 2 other already established indicators: Book of Offers and Balance Aggressor (Time & Trades), this indicator allows to detect the best price trigger (buy or sell) in the aggressions to the Book of Offers including filters important as Aggression in Candle. Recommended use on the Brazilian iBovespa B3, but it also serves in Forex as long as the assets have information from the Book, in the case of Forex it is not possible to use the Aggress
. . is designed for traders who want a clean and practical way to identify bullish and bearish trend changes directly on the MT5 chart. The indicator uses a dual high/low smoothing engine to detect market direction and show a clear active trend line. When the market confirms a bullish or bearish flip
I recommend you to read the   product's blog  (manual) from start to end so that it is clear from the beginning what the indicactor offers. This multi time frame and multi symbol indicator identifies double or triple top/bottom formations or a following neckline breakout (confirmed top/bottom). It offers RSI, pin bar, engulfing, tweezer, morning/evening star filters as well divergence filter options which makes it possible to filter out only the strongest setups. The indicator can also be used
GannNexus
issam rahhal sabour
GannNexus : Fiyat ve Zaman Geometrisinin Nihai Birleşimi Piyasanın gizli geometrik yapısını ortaya çıkarın. GannNexus v3.10 , sıradan bir Destek/Direnç göstergesi değildir. John Murphy 'nin klasik piyasa yapısı analizini, W.D. Gann 'ın gelişmiş "Fiyat-Zaman Açıları" teorisi, 9'un Karesi (Square of 9) matematiği ve kutsal geometri ile birleştiren kapsamlı bir analiz motorudur. Hassasiyet arayan yatırımcılar için tasarlanan bu araç; piyasa formasyonlarını (Kareler, Üçgenler, Altıgenler) otomatik o
Beholder
Joao Marcilio
BEHOLDER – THE INDICATOR THAT REVEALS HIDDEN PATTERNS IN TIME THE REAL TRADER’S PROBLEM: TEMPORAL BLINDNESS Every week, thousands of traders face the same dilemma: A flood of economic events (NFP, CPI, Interest Rates, Retail Sales…) Very little time to analyze correlations Decisions made on “gut feeling,” without reliable historical context Trying to do this manually is insane: Scrolling back through dozens of weeks on the calendar Comparing event by event Trying to calculate patt
Zigzag X Fibo
Ian David Emmanuel Bello
The ZigZag indicator's main objective is to highlight significant price movements by filtering out minor price fluctuations. It enables the visualization of trends by eliminating market "noise," which can assist traders in making more informed decisions. Adding the Fibonacci indicator, which is a powerful tool for identifying potential support and resistance levels in financial markets.
N/B: All our product purchase comes with our free ‘’DAILY   SCALPER EA’’ -   bit.ly/4qlFLNh Whatsapp Developer for yours after successful purchase PROFESSIONAL DOUBLE TOP/BOTTOM PATTERN SCANNER The Ultimate Reversal Trading System for Forex & Crypto Traders  TRANSFORM YOUR TRADING WITH INSTANT PATTERN RECOGNITION Are you tired of missing profitable reversal setups? Exhausted from staring at charts for hours, trying to spot double tops and bottoms? Frustrated with false breakouts and misse
Liquidity Map
Alex Amuyunzu Raymond
Liquidity Map  Overview The Liquidity Map indicator is an advanced visualization tool based on ICT Smart Money Concepts . It automatically identifies daily Buy Zones , Sell Zones , and Liquidity Levels , showing where price is likely to reverse or continue based on institutional order flow. It calculates key levels from the daily session — such as the previous day’s high, low, and midpoint — then derives a premium (sell bias) and discount (buy bias) structure. When price trades into these mapped
Five Candles Pattern MT5
Miguel Antonio Rojas Martinez
The "Five Candle Pattern" indicator is a novel way to see the market, because with it we can compare and/or seek training or the pattern of the past 4 or 5 Candles, and identify them in the same graph, to view your behavior at an earlier time. The indicator creates a pattern of those 4 or 5 candles and searches backward, identifies, and marks the same formation or pattern. With that information you adjust the strategy that is operating, or create a new one, because you can compare the past devel
Product Title Multi-Stage Fibonacci Structure – Wave-Based Support & Resistance English Description A Fibonacci structure designed to identify high-value price levels by preserving the Fibonacci relationships created during previous market waves. Instead of drawing Fibonacci levels only from the most recent high and low, this method keeps the important levels created during previous 1st to 5th wave structures and uses them as reference points for future price action. The key concept is simple: P
Adaptive Fibonacci Trend Zones is an MT5 indicator built for traders who want a clean structure-based Fibonacci workflow without constantly redrawing anchors by hand. The indicator automatically detects the dominant swing, builds the active Fibonacci map, projects trade-map zones and adapts its behavior across scalp, intraday and swing conditions. Instead of leaving outdated levels on the chart when structure changes, the indicator can disable the active trade map and wait for a new anchor. T
Session Killzones Asia London New York marks the most important trading sessions on your chart. Asia, London and New York session boxes , each labelled with its range in pips. Previous Day High and Low (PDH / PDL) levels. Asian range breakout alerts during London and New York. Automatic broker GMT offset detection , with a manual override. Session hours you can change, given in GMT. Custom colors and the number of days to show. Inputs Detect broker GMT offset automatically / Manual GMT offset –
Bu ürünün alıcıları ayrıca şunları da satın alıyor
Trend Sniper X
Sarvarbek Abduvoxobov
4.87 (46)
Trend Sniper X , tüccarların trend yönünü ve olası dönüş noktalarını netlik ve hassasiyetle belirlemelerine yardımcı olan MetaTrader 5 için çoklu zaman dilimli bir trend takip göstergesidir. MT4 için: https://www.mql5.com/en/market/product/193245 Fiyat Bilgisi: Mevcut fiyat tanıtım amaçlıdır ve gelecek güncellemeler ile yeni özellikler yayınlandıkça değişebilir. Bonus Fırsatı: Bu indikatör için ÜCRETSİZ Oto-Trade Assistant EA'yı almak için lütfen satın aldıktan sonra yazara mesaj gönderin. Code
Şehre yeni bir Kral geldi - Gösterge + Emir Yönetimi göstergeleri (TP1 + TP2 + TP3) + Opsiyonel Telegram Sinyal Gönderici DAHİL (ÜCRETSİZ) (TAM TRADING ve SİNYAL SİSTEMİ) Altın için en iyi EA’mız: Gold Slayer Bu gösterge; gelişmiş bir strateji, özelleştirilebilir emir yönetimine sahip bir trading sistemi ve envelope uzantılarını birleştiren bir mean reversion sistemi içerir. Ayrıca RSI gibi birçok akıllı onay filtresiyle desteklenerek yüksek olasılıklı dönüş girişlerini AL ve SAT sinyalleriyle y
Smart Trend Trading System — MetaTrader 5 Satın aldıktan sonra Smart Universal Expert Advisor'ı ÜCRETSİZ edinmek ve beraberinde çevrimiçi kurs, PDF kılavuzu ve özel gruba erişim almak için MQL5 üzerinden bana mesaj gönderin. STTS; trend yönünü, giriş ve çıkış sinyallerini, dönüş bölgelerini ve önemli fiyat seviyelerini doğrudan grafiğinizde bir araya getirir. Sistemi manuel işlemler için kullanabilir veya ayrı bir uyumlu EA’yı bağlayarak seçtiğiniz ayarlarla otomatik işlem gerçekleştirebilirsini
Entry Points Pro, emri vermeden önce nereden gireceğinizi, stopu nereye koyacağınızı ve hangi lotla işlem yapacağınızı gösterir. FİYAT Şu anda 199 USD: bu fiyattan 4 kopya, sonra 249 USD. Nihai fiyat 349 USD. Paramı piyasalarda işlem yaparak kazanıyorum ve bunu gösteriyorum, bu yüzden bu indikatörü herkese satmak zorunda değilim. Bu, kendi kafasıyla düşünen traderlar için bir araç, sihirli bir düğme değil. Kırılım yoksa işlem de yok. Gri ok, iptal edilmiş bir sinyaldir: fiyat sinyal mumunu kırm
Gann Made Easy , bay teorisini kullanarak ticaretin en iyi ilkelerine dayanan, profesyonel ve kullanımı kolay bir Forex ticaret sistemidir. WD Gann. Gösterge, Zararı Durdur ve Kâr Al Seviyeleri dahil olmak üzere doğru SATIN AL ve SAT sinyalleri sağlar. PUSH bildirimlerini kullanarak hareket halindeyken bile işlem yapabilirsiniz. Satın alma işleminden sonra, alım satım talimatlarını ve harika ek göstergeleri ücretsiz olarak almak için lütfen benimle iletişime geçin! Muhtemelen Gann ticaret yöntem
SuperScalp Pro
Van Minh Nguyen
4.54 (37)
SuperScalp Pro - Professional Multi-Layer Confluence Scalping System SuperScalp Pro, klasik Supertrend sistemini birden fazla akıllı doğrulama filtresiyle geliştiren ileri düzey bir scalping göstergesidir. Yanlış sinyalleri önemli ölçüde azaltırken başarı olasılığı daha yüksek Buy/Sell işlem fırsatlarını belirlemenize yardımcı olur. Buy ve Sell okları doğrudan grafik üzerinde net bir şekilde görüntülenir. ATR tabanlı Stop Loss ve Take Profit seviyeleri de gerçek zamanlı olarak otomatik hesaplanı
İşlem avantajınızı görüş alanınıza alın! M5 Sniper , MeanFX tarafından geliştirilen yeni bir indikatördür. Hassas işlem sinyallerini adaptif TP/SL seviyeleriyle birleştirir — bunun sonucunda mümkün olan en iyi istatistiksel işlemleri oluşturur! Fiyat her 5 satın alımda bir artar, bir sonraki fiyat 69$ olacaktır. Satın aldıktan sonra ipuçları/rehber ve bonus EA almak için bana mesaj gönderin. Onu öne çıkaran nedir? Kanıtlanmış istatistiksel performans Gold XAUUSD üzerinde ( neredeyse her varlıkta
SMC Intraday Formula
VividMind Digital Solutions
5 (26)
Önce dürüst olalım. Hiçbir gösterge tek başına sizi kârlı yapmaz. Eğer biri size aksini söylüyorsa, size bir hayal satıyordur. Mükemmel al/sat okları gösteren her gösterge, kusursuzmuş gibi görünecek şekilde yapılabilir — sadece geçmişin doğru bir bölümünü yakınlaştırıp kazanan işlemleri ekran görüntüsü almanız yeterlidir. Biz bunu yapmıyoruz.  SMC Intraday Formula bir araçtır. Piyasa yapısını sizin için okur, en yüksek olasılıklı fiyat bölgelerini belirler ve şu anda akıllı paranın izinin nası
Zoryk Gold
Reda El Koutbane
4.68 (22)
ZORYK — MetaTrader 5 İçin Gelişmiş XAUUSD Sinyal Sistemi Bu hissi biliyorsunuz. Altını analiz etmek için uzun zaman harcarsınız. Doğru giriş noktasını beklersiniz. Sonunda işlemi açarsınız ve fiyat hemen aleyhinize hareket etmeye başlar. İşlemi çok erken kapatırsınız, Stop Loss seviyesini değiştirirsiniz veya birkaç saniye tereddüt edersiniz. Daha sonra piyasa, başlangıçta beklediğiniz hedefe tam olarak ulaşır; ancak siz artık işlemin içinde değilsinizdir. Sorun her zaman yön değildi. Asıl sorun
Ultra Indicator
Ihor Otkydach
5 (1)
ULTRA, “hepsi bir arada” prensibiyle çalışan bir teknik göstergedir; piyasayı bağımsız olarak analiz eder, işlem sinyalleri üretir, stop-loss emirlerinin verileceği seviyeleri gösterir ve kârı garantilemek ya da zararı en aza indirmek için işlemlerin ne zaman kapatılması gerektiğini önerir. Başka bir deyişle, piyasayı nasıl analiz edeceğinizi bilmeseniz, seviyeleri (stop-loss'unuzu nereye koyacağınızı) belirleyemeseniz ya da para yönetimi konusunda zorluk yaşasanız da fark etmez. ULTRA tüm bunla
GoldenX Entry MT5
VividMind Digital Solutions
5 (17)
GoldenX Entry, adaptif Smart Entry Trend algoritmasına, sinyal skorlaması sistemine, piyasa rejimi algılayıcısına ve volatilite filtresine sahip bir MT5 indikatörüdür. Her sinyal; hesaplanmış bir giriş seviyesi, üç adet Take-Profit seviyesi (TP1, TP2, TP3) ve bir Stop-Loss seviyesi içerir. Farklı piyasa koşullarına uyum sağlamak için tasarlanmış çok katmanlı analitik yapı üzerine kuruludur ve yerleşik optimizasyon aracı ile istatistik takip sistemini birleştirir. Risk-ödül (RR) metrikleri ve geç
Gold Trend Coach MT5
Cristhian Alexander Gaibor Cuasquer
4.27 (11)
MetaTrader 5 için altında (XAUUSD) repaint yapmayan al-sat sinyalleri. Her sinyal bir stop loss ve üç take profit ile gelir. BOS ve CHoCH içeren Smart Money Concepts filtresi sayesinde yapıya karşı değil, yapıyla birlikte işlem açarsın. Paneldeki canlı Mentor, girişten TP3'e kadar her adımda sana yol gösterir. Alarmlar doğrudan telefonuna ve kendi Telegram kanalına gelir. İşte Gold Trend Coach. Artık asla yalnız işlem yapma. Satın alımla birlikte ÜCRETSİZ ALICI KİTİ: 1. Telegram Alert Bridge: s
Boba Analysis Suite
Trade Ready Solutions LLC
5 (2)
Boba Analysis Suite Boba Analysis Suite, MetaTrader 5 için geliştirilmiş bir analiz göstergesidir. Piyasa yapısını, önemli fiyat bölgelerini ve genel piyasa bağlamını tek bir grafik görünümünde bir araya getirir. Trader ve trading eğitmeni olarak edinilen uygulamalı deneyimden yola çıkarak geliştirilmiştir. Piyasanın yönünü değerlendirme, önemli seviyeleri belirleme ve birden fazla zaman dilimini birlikte inceleme gibi adımlardan oluşan sistematik bir analiz sürecini destekler. Piyasa Bağlamını
FX Power MT5 NG
Daniel Stein
5 (33)
FX Power: Daha Akıllı Ticaret Kararları için Para Birimlerinin Gücünü Analiz Edin Genel Bakış FX Power , her piyasa koşulunda başlıca para birimlerinin ve altının gerçek gücünü anlamak için vazgeçilmez bir araçtır. Güçlü para birimlerini alıp zayıf olanları satarak, FX Power ticaret kararlarınızı basitleştirir ve yüksek olasılıklı fırsatları ortaya çıkarır. İster trendlere sadık kalın ister Delta'nın aşırı değerlerini kullanarak tersine dönüşleri öngörün, bu araç ticaret tarzınıza mükemmel bir
Power Candles MT5
Daniel Stein
4.58 (12)
Power Candles V3 - Kendi Kendini Optimize Eden Güç Göstergesi Power Candles V3, döviz ve enstrüman gücünü, eklendiği her grafikte eyleme geçirilebilir bir ticaret planına dönüştürür. Sadece mumları renklendirmek yerine, arka planda canlı bir otomatik optimizasyon çalıştırır ve önünüzdeki sembol için en iyi Stop Loss, Take Profit ve sinyal eşiğini size sunar. Tek bir tıklama ile canlı ticarete uyarlanır - giriş, Stop Loss ve Take Profit ışınları grafikte tam fiyatlarla görünür ve uyarılar yön bil
M1 Sniper MT5
Oleg Rodin
5 (7)
M1 SNIPER   kullanımı kolay bir işlem göstergesi sistemidir. M1 zaman dilimi için tasarlanmış bir ok göstergesidir. Gösterge, M1 zaman diliminde scalping için bağımsız bir sistem olarak kullanılabilir ve mevcut işlem sisteminizin bir parçası olarak kullanılabilir. Bu işlem sistemi özellikle M1'de işlem yapmak için tasarlanmış olsa da, diğer zaman dilimleriyle de kullanılabilir. Başlangıçta bu yöntemi XAUUSD ve BTCUSD ticareti için tasarladım. Ancak bu yöntemi diğer piyasalarda işlem yaparken de
Atomic Analyst MT5
Issam Kassas
4.51 (65)
Atomic Analyst — MetaTrader 5 Satın aldıktan sonra Smart Universal Expert Advisor'ı ÜCRETSİZ edinmek ve beraberinde çevrimiçi kurs, PDF kılavuzu ve özel gruba erişim almak için MQL5 üzerinden bana mesaj gönderin. Atomic Analyst; fiyat hareketini, trend yönünü, giriş ve çıkış sinyallerini, Stop Loss ve birden fazla Take Profit seviyesini doğrudan grafiğinizde bir araya getirir. SİNYALİ GÖRÜN. İŞLEM KOŞULLARINI ANLAYIN. Atomic Analyst, analizini anlaşılır görsel bilgiler halinde sunar: • Olası gir
Smc Pro ToolKit
Talal N Z Aljarusha
5 (13)
SMC PRO TOOLKIT — SMART MONEY ANALYSIS & STRUCTURED TRADE PLANNING SMC Pro ToolKit is a professional Smart Money Concepts analysis workspace for MetaTrader 5. It combines market structure, multi-timeframe analysis, institutional price zones, setup evaluation, confirmation tools, volume context, alerts, and risk planning inside one organized chart environment. One workspace. Multiple layers of confirmation. One structured trading plan. OPEN COMPLETE USER GUIDE MULTI-CONDITION SETUP ENGINE At
Auto Optimized SpeedAngle , sürekli İleriye Dönük Optimizasyon (Walk-Forward Optimization, WFO) yoluyla eğri uydurmayı (curve-fitting) ortadan kaldıran kurumsal düzeyde bir momentum vektörleme sistemidir. Piyasa rejimleri değiştiğinde etkinliğini yitiren statik girdilere güvenmek yerine, gösterge, örneklem dışı (Out-of-Sample, OOS) doğrulama kullanarak parametrelerini dinamik olarak yeniden kalibre eder ve böylece gösterilen sinyallerin geçmişteki rastgele anomalileri değil, gerçek bir istatisti
Azimuth Pro
Ottaviano De Cicco
5 (7)
Azimuth Pro V2: Synthetic Fractal Structure and Confirmed Entries for MT5 Overview Azimuth Pro is a multi-level swing structure indicator by Merkava Labs . Four nested swing layers, swing-anchored VWAP, ABC pattern detection, three-timeframe structural filtering, and closed-bar confirmed entries — one chart, one workflow from micro-swings to macro-cycles. This is not a blind signal product. It is a structure-first workflow for traders who care about location, context, and timing. 1. What Change
Gold Entry Sniper
Tahir Mehmood
5 (23)
Gold Entry Sniper – Altın Scalping & Swing Trading için Profesyonel Çoklu Zaman Çerçeveli ATR Paneli Gold Entry Sniper , XAUUSD ve diğer enstrümanlar için doğru al/sat sinyalleri veren, ATR Trailing Stop mantığı ve çoklu zaman çerçevesi analizi ile geliştirilmiş gelişmiş bir MetaTrader 5 göstergesidir. Temel Özellikler ve Avantajlar Çoklu Zaman Çerçevesi Analizi – M1, M5, M15 trendlerini tek panelde gösterir. ATR Tabanlı Trailing Stop – Volatiliteye göre dinamik olarak ayarlanır. Profesyonel Gra
Apex Patterns PRO İndikatörü Satın Alın - Üzerine Kurulu Expert Advisor'a ÜCRETSİZ Sahip Olun. Kendini Optimize Eden Grafik Formasyonu ve Kırılım Zekası Geleneksel formasyon tarayıcıları sabit girdilere dayanır ve piyasa volatilitesi ile yapıları değiştiğinde genellikle düşük performans gösterir. Apex Patterns PRO, yapısal grafik formasyon tanımayı, momentum filtrelemeyi ve istatistiksel kendi kendini optimizasyonu tek bir analitik çerçevede birleştirerek değişen piyasa koşullarına uyum sağlama
Meridian Pro
Ottaviano De Cicco
4 (3)
Meridian Pro 2.00: Professional Multi-Timeframe Trend Matrix for MT5 Meridian Pro 2.00 is a professional adaptive trend matrix for MetaTrader 5. It combines the original Meridian trend engine, a clean chart ribbon, closed-bar signal arrows, an 8-timeframe dashboard, Fuel momentum, weighted consensus, synthetic HTF processing and chart-native higher-timeframe context lines. The goal is simple: read current trend, multi-timeframe structure, strength, momentum and EA-ready state from one discipline
Sonraki Güncelleme — Sürüm 2.52 Çok Yakında! [YENİ] Piyasa Analizinizi ve İşlem Sürecinizi Geliştirmek İçin Tasarlanmış 4 Büyük Yeni Özelliğe Hazır Olun İşlem ihtiyaçlarınızı karşılamak üzere tasarlanmış 4 yeni özellikle piyasa analizini bir üst seviyeye taşıyoruz. İşte yeni özellikler: 1. TRADE OVERVIEW DASHBOARD 2. CONFLUENCE AT ZONE 3. STRONG & WEAK HIGH/LOW 4. OTE 1. TRADE OVERVIEW DASHBOARD Piyasanın genel görünümünü daha kolay anlamanıza yardımcı olan, işlem kararlarınızı desteklemek için
Divergence Bomber
Ihor Otkydach
4.89 (94)
Bu göstergeyi satın alan herkese aşağıdaki ekstra içerikler ücretsiz olarak sunulmaktadır: Her işlemi otomatik olarak yöneten, Stop Loss ve Take Profit seviyelerini ayarlayan ve işlemleri strateji kurallarına göre kapatan özel yardımcı araç: "Bomber Utility" Göstergenin farklı varlıklar üzerinde kullanılmasına yönelik ayar dosyaları (set dosyaları) Bomber Utility için 3 farklı modda kullanım sunan ayar dosyaları: "Minimum Risk", "Dengeli Risk" ve "Bekle-Gör Stratejisi" Bu ticaret stratejisini
Adaptive Price Action Engine Göstergeyi al, EA'sı (Uzman Danışman) bedava gelsin Kendi Kendini Optimize Eden Multi-Timeframe Trend ve Mum Formasyonu Analizi Piyasalar sürekli değişir ve her Price Action formasyonu her piyasa koşulunda aynı değere sahip değildir. Adaptive Price Action Engine , değişen piyasa koşullarına uyum sağlamak amacıyla trend yapısını, Multi-Timeframe analizini, mum formasyonlarını ve istatistiksel optimizasyonu tek bir analiz sistemi içerisinde birleştirir. İki Adaptif Mod
Currency Strength Wizard , başarılı ticaret için size hepsi bir arada çözüm sağlayan çok güçlü bir göstergedir. Gösterge, birden çok zaman dilimindeki tüm para birimlerinin verilerini kullanarak şu veya bu forex çiftinin gücünü hesaplar. Bu veriler, şu veya bu para biriminin gücünü görmek için kullanabileceğiniz, kullanımı kolay para birimi endeksi ve para birimi güç hatları biçiminde temsil edilir. İhtiyacınız olan tek şey, işlem yapmak istediğiniz tabloya göstergeyi eklemektir ve gösterge size
Crystal Heikin Ashi Signals
Muhammad Jawad Shabir
5 (5)
Crystal Heikin Ashi Signals—Professional Trend & Signal Detection Indicator Advanced Heikin Ashi Visualization with Intelligent Signal System for Manual & Automated Trading Final Price: $149 ---------> Price goes up $10 after every 10 sales . Limited slots available — act fast . Overview User Guide PDF Crystal Heikin Ashi Signals is a professional-grade MetaTrader 5 indicator that combines pure Heikin Ashi candle visualization with an advanced momentum-shift detection system. Designed for both m
Naked Forex Tweezer Pro Indicator Tweezer Pro Indicator is a pattern recognition indicator for Forex, Stocks, Indices, Futures, Commodities and Cryptos. The standard Tweezer is a two bar pattern. Our enhanced version is a multi-bar pattern. We filter the patterns for you so that you only get the     best and most effective patterns   and ignore the noise. The Tweezer pattern is a simple and effective pattern to trade. The strategy that comes with the Tweezer is based on price action. The Twe
FiboSniper Pro
Van Minh Nguyen
5 (4)
FiboSniper Pro – Multi-Filter Fibonacci System with Auto SL/TP and Control Panel FiboSniper Pro, seçilmiş Buy ve Sell sinyalleri üretmek için dinamik Fibonacci Envelopes ile birden fazla doğrulama filtresini birleştiren teknik bir göstergedir. Fibonacci seviyeleri Moving Average ve ATR temel alınarak hesaplanır ve ardından ADX, EMA, RSI, ATR, Volume, Time ve Candle yapısı ile filtrelenir. Gösterge, ATR tabanlı otomatik Stop Loss ve Take Profit seviyelerini doğrudan grafik üzerinde görüntüler ve
Yazarın diğer ürünleri
Lotwise Risk Console works out the lot size from the risk you choose and the stop loss line you drag on the chart. You click Buy or Sell, and the manager can then look after the open position: break-even, partial closes, trailing, time exit. It never opens a trade by itself. It takes the lot calculation off your hands for every order. Example on a 10,000 USD account: 1 % risk and a stop of 191 points give 0.51 lot on EURUSD. The panel shows the money at risk (97.41 USD) and the possible gain at
Limitline Prop Monitor shows the limits of a funded or challenge account in one foldable panel on the chart and warns you before a limit is reached. If you enable the trade brake or the emergency stop, it can also close trades and delete orders that would break a limit. It does not open trades by itself. The reason I built it: the daily loss limit usually resets at the firm's own time, not at broker midnight, and open stops and pending orders count too. The panel does that arithmetic for you. In
Event Window Manager reads the economic calendar that is already built into your terminal and opens a protection window around important events. Inside the window it can warn you, block new trades, delete and later restore pending orders, and close positions or move them to break-even. Your other EAs can ask for its state through global variables. It needs no DLL, no WebRequest and no website. The calendar comes through your broker connection. One instance on one chart covers the whole account,
Magic Atlas Journal reads the closed positions of your account and sorts them by magic number, symbol, calendar day, weekday and entry hour. You see profit factor, win rate, drawdown and expectancy for each EA without a spreadsheet. It only reads history and places no orders on a live account. I use it when several EAs run on one account and the broker statement only gives one total. A profitable account can hide one EA that has been losing for weeks, and a flat account can hide one that works.
Twinlane Copier copies positions and pending orders from one MetaTrader 5 terminal to one or more other terminals that run on the same PC or VPS. The same EA works as Master or as Slave, and the terminals exchange a small snapshot file in the shared common folder. No DLL, no web request, no account passwords. It is built so that a copied trade is never opened twice: every copy carries the master ticket in its comment, the slave checks open positions and orders before it sends anything, and a sta
Fleetdeck shows the state of every MetaTrader 5 account that runs on your computer in one panel on one chart. You see total equity, profit of the day and week, open risk and the health of each account at a glance, and you get an alert when something is wrong. Fleetdeck only reads. It never opens, closes or changes a trade. Problems it solves You run several terminals (own accounts, funded accounts, demo) and have to switch windows to see how they are doing. An account goes offline, or Algo Tradi
Magic Brake watches every EA on your account, one row per magic number. It scores each EA from 0 to 100, tells you why, and, if you want it to, brakes only the EA that misbehaves: it closes its new trades, closes all of its trades, or sets the stop loss it forgot. Default mode is warn only. Problems it solves 1. You run five or ten EAs on one account. One of them starts doubling its lot after every loss or piles up a grid, and you only see it when the account equity has already dropped. 2. Some
Daymark Chart Companion puts the timing of your trading day on the chart: a candle countdown on five timeframes, the four trading sessions with their average range, the levels of the previous day, week and month, today's range against the daily ATR and your own event times. Everything sits in one calm panel and every part can be switched off. The indicator never trades. It is built for traders who plan entries around session opens, candle closes and key levels. Example from the screenshots: GBPU
Clear structure. Clean zones. No repaint. Zonecraft SMC Suite 2.0 draws market structure, order blocks, fair value gaps, liquidity, sessions and premium / discount zones on your MetaTrader 5 chart. Every element follows a written rule, is calculated from closed candles only and is drawn as a soft, semi-transparent zone with a small label that does not cover other labels. A dashboard shows the trend on four timeframes, the nearest zones with their status and the reasons behind them, the running s
Anchored VWAP from structure, time and your own click. Anchorline Anchored VWAP draws up to eight volume weighted average price lines at the same time. Each line starts at a point you choose: the last swing high or low, the last BOS or CHoCH, the start of the day, week or month, the London or New York session start, or a candle you click. Standard deviation bands (+/-1 and +/-2) show how far price has moved away from each average. A compact panel lists every anchor with the distance from price i
Currency strength with an open formula: see which of the 8 major currencies leads and which lags. Tideline Currency Strength calculates the strength of USD, EUR, GBP, JPY, CHF, CAD, AUD and NZD from the 28 major and cross pairs and draws one line per currency in a sub-window. A panel ranks the eight currencies, shows a bar for each strength value and compares the rank on four timeframes (default M15, H1, H4, D1). It also names the pair that combines the strongest and the weakest currency, as a d
Plan the trade on the chart, see the risk before you click, and let the panel handle the exits. Pilotdeck is a manual trade manager for MetaTrader 5. You drag Entry, Stop Loss and Take Profit lines on the chart; Pilotdeck calculates the lot size from your risk, shows money, percent, R:R and distance live next to each line, and sends the order with one click. After the entry it manages the position: partial take profits, break-even and trailing stop. A built-in prop-firm guard watches the daily l
Read trade signals from Telegram, turn them into orders with your own risk, and get every trade event back on your phone. Relaywire is an Expert Advisor for MetaTrader 5 that connects the terminal with Telegram in both directions: Telegram -> MT5: it reads signal messages, understands BUY / SELL, entry or entry zone, SL, up to 5 targets and management messages ("close half", "SL to entry", "close all", "cancel"), calculates the lot from your risk and places the orders. MT5 -> Telegram: it sends
Liquidity pools, sweeps with strength, CRT on H1/H4/D1, SMT divergence, FVG and inverse FVG, kill zones - one clean panel, closed bars only. Sweepwell ICT Liquidity Suite marks where liquidity sits on your chart and shows when it is taken. It combines the ICT concepts that are discussed most often today - liquidity pools and sweeps, candle range theory (CRT), SMT divergence and inverse fair value gaps - in one indicator with one calm, readable look. What It Draws 1. Liquidity pools (buy-side abo
Replay the market in the MT5 Strategy Tester and practise manual trading bar by bar - with a pause button, a trade panel and statistics for your session. Rewindeck is an Expert Advisor for the visual mode of the MetaTrader 5 Strategy Tester. It adds a replay control (pause, play, next bar, jump to a date) and a trade panel to the tester chart. You place trades like on a live chart: set the Entry, Stop Loss and Take Profit lines with one click on the chart (or move them with the - / + buttons), t
Scoutmark SMC Scanner shows the smart money structure of all your markets in one table. Every row is a symbol, every column a timeframe. Each cell tells you in one look where the structure stands, what is close to the price and whether liquidity was just taken. Click a cell and the chart opens on that symbol and timeframe. Analysis tool. No signals, no profit promises. What Every Cell Shows 1. Structure The last swing break of that timeframe: BOS (break of structure) or CHoCH (change of characte
Stratamark Volume Profile shows where the volume really traded, period by period. Each profile is a histogram next to the candles with the point of control (POC), the value area (VAH / VAL), high and low volume nodes, and the POCs of earlier periods that price has not touched yet (naked POC). One chart object, no clutter, no signals: you read the levels and decide. Analysis tool. No signals, no profit promises. WHAT YOU GET 1. Profiles for every period you work with Sessions: Asia, London and Ne
Filtrele:
Değerlendirme yok
Değerlendirmeye yanıt