FiboZoneLines
- Göstergeler
- Sürüm: 3.10
- Etkinleştirmeler: 5
Short Description
Automatically draws multi-layered Fibonacci zone lines from your manually placed Fibonacci retracement. No repainting. Fully customizable.
Overview
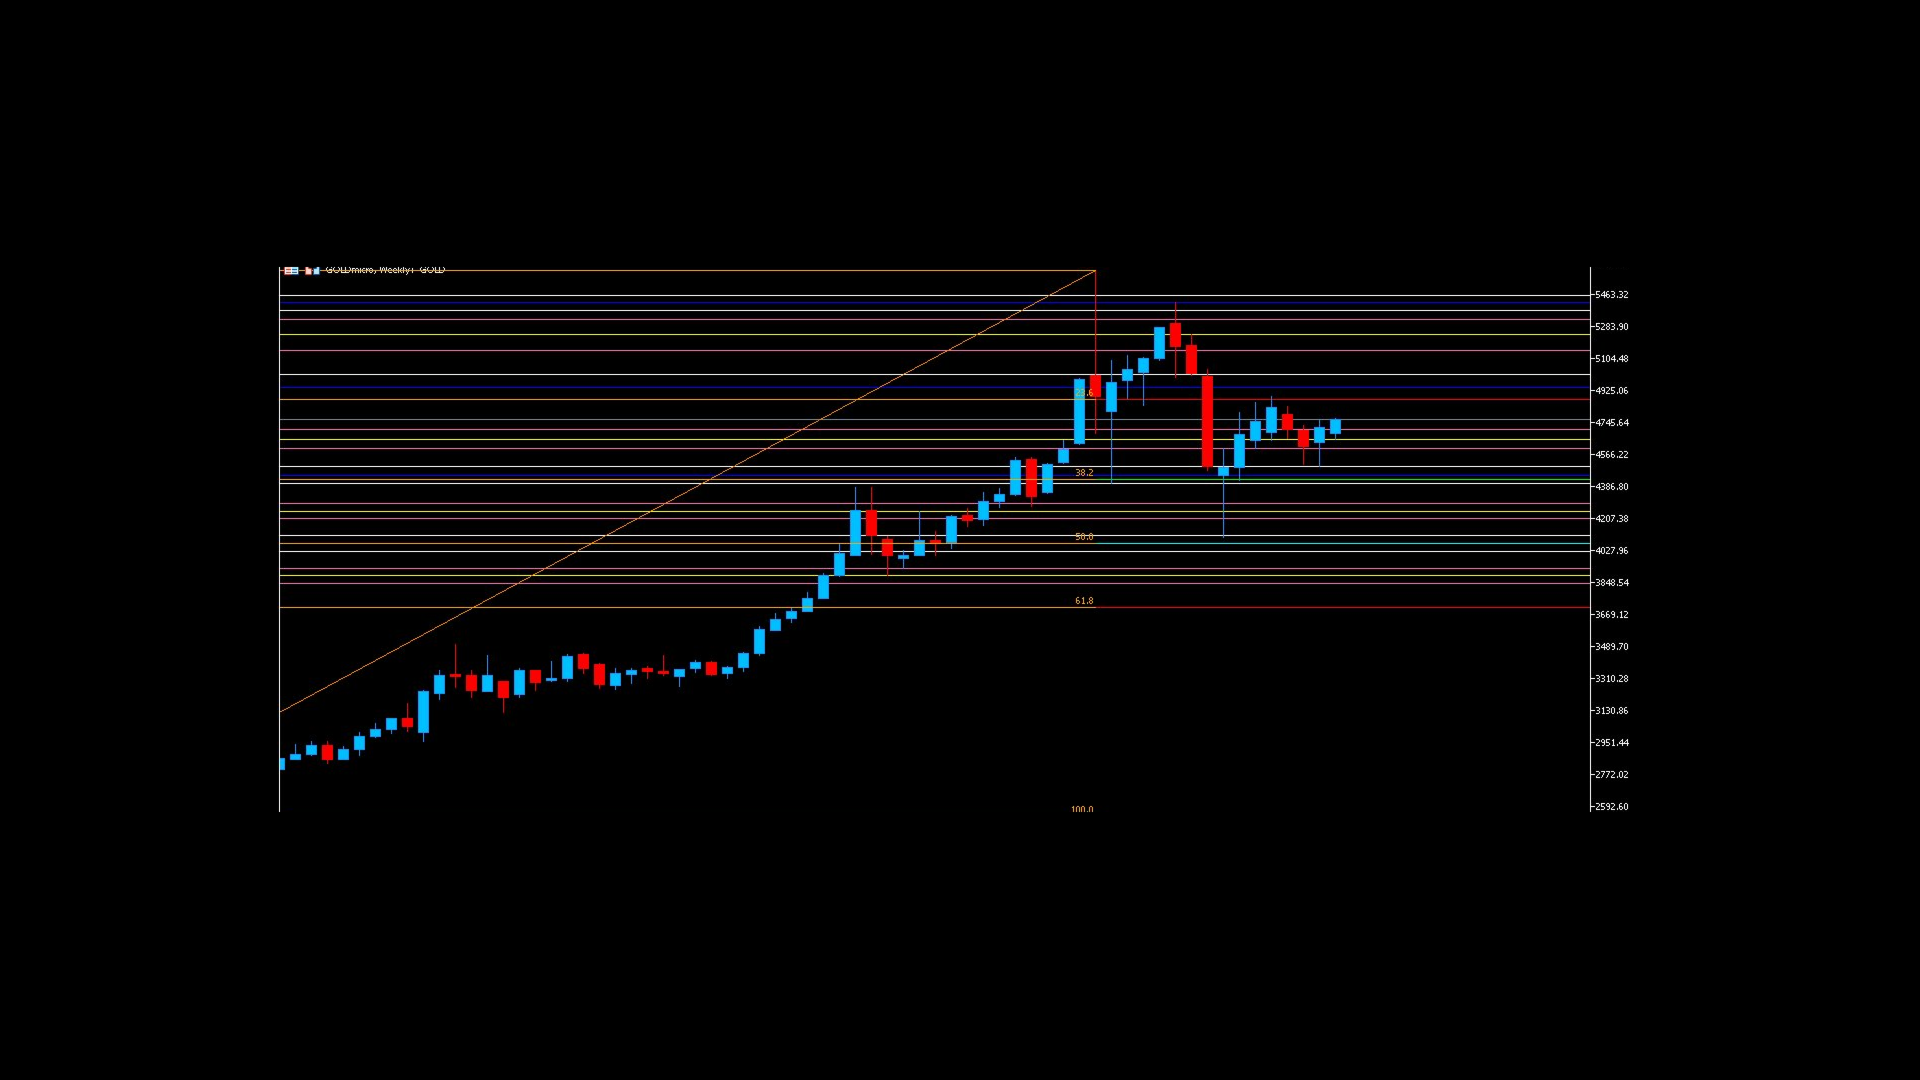
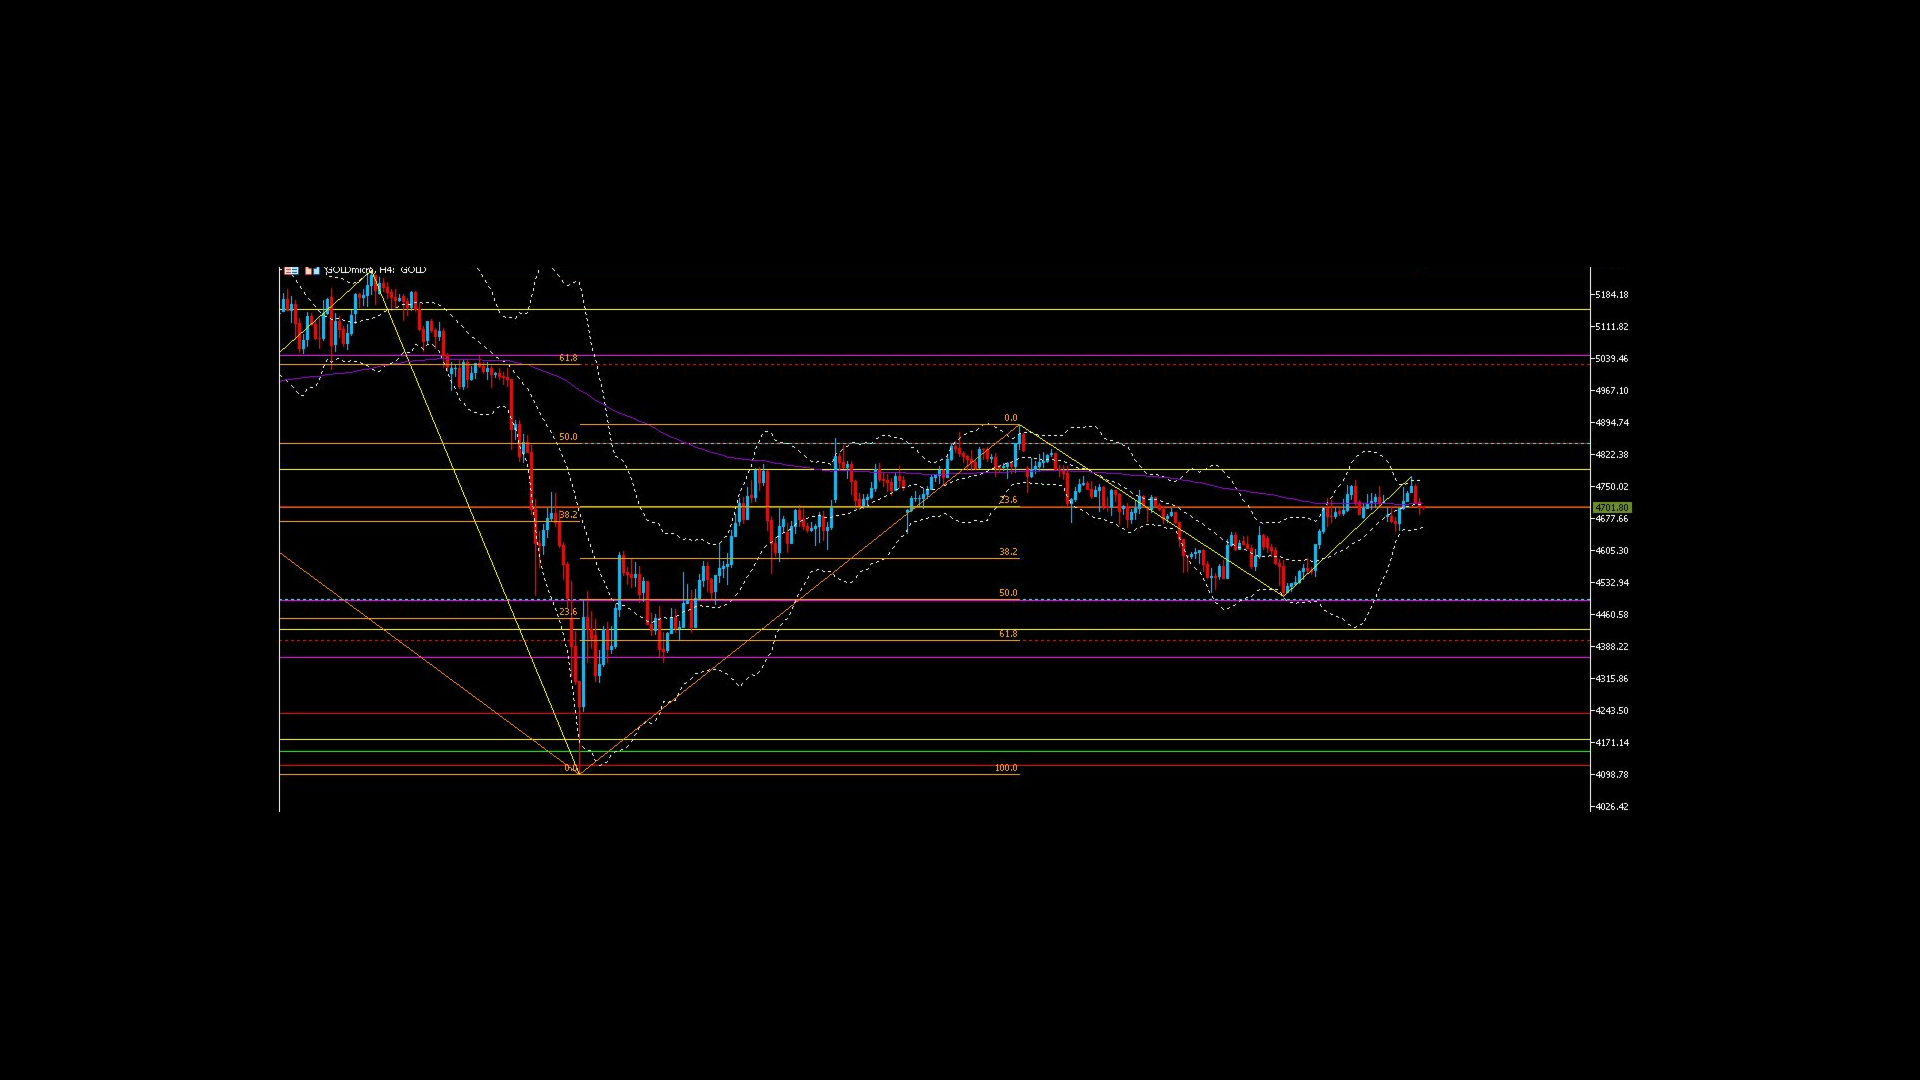
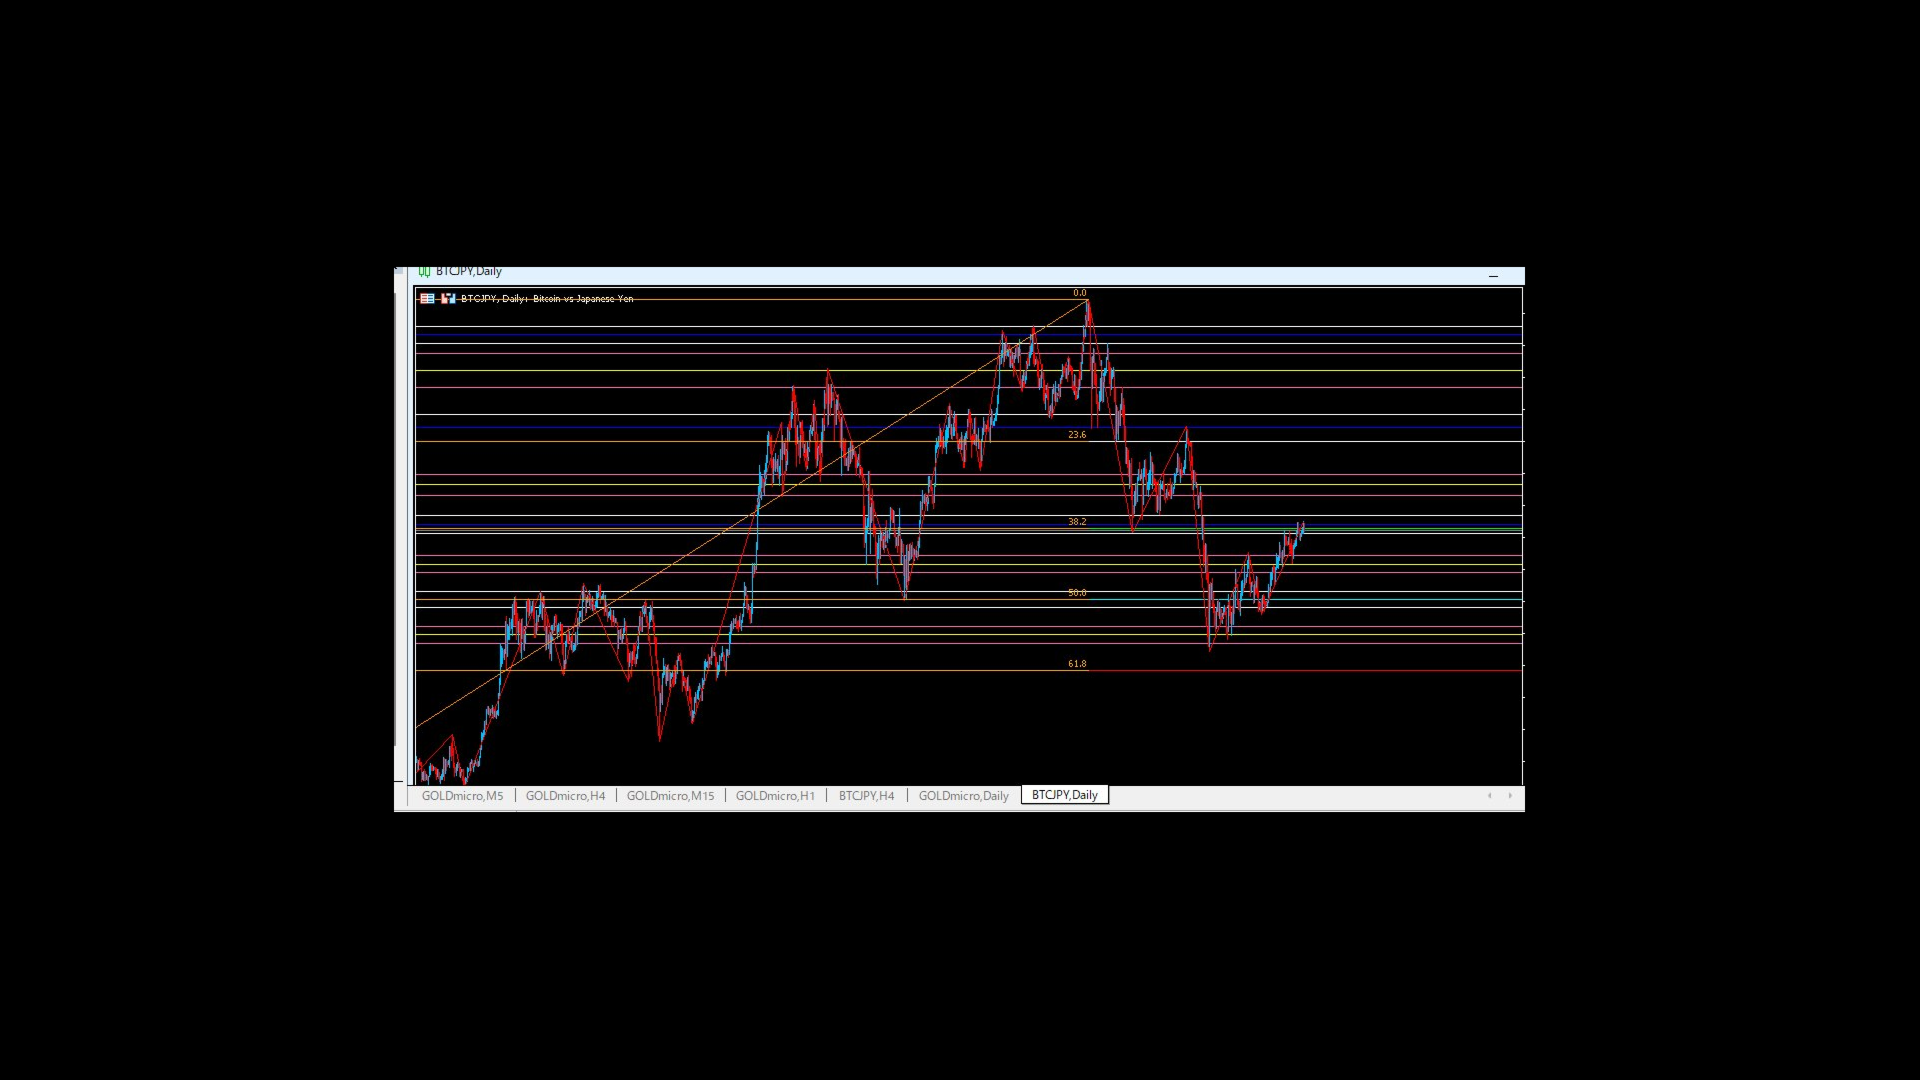
FiboZoneLines is a powerful Fibonacci-based indicator for MetaTrader 5 that automatically generates a complete set of multi-layered support and resistance lines from a single manually drawn Fibonacci retracement object on your chart.
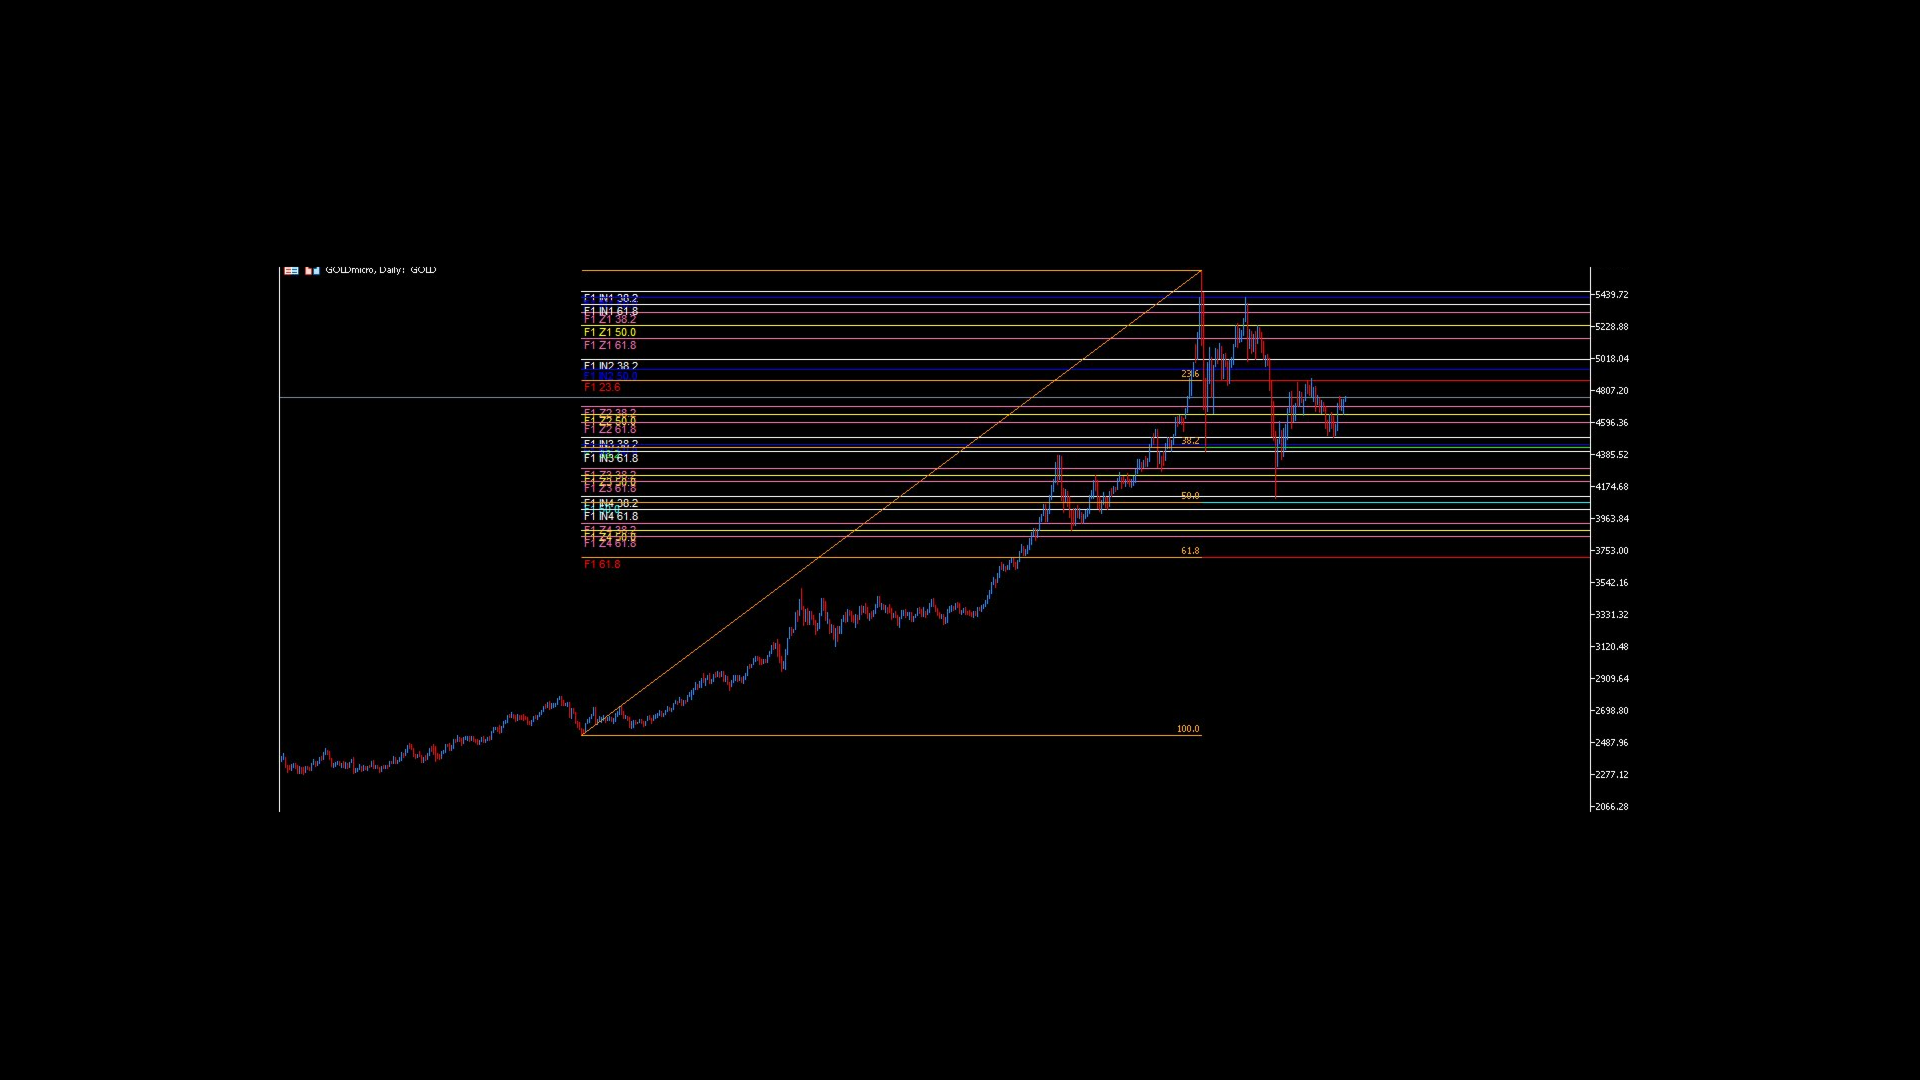
Unlike standard Fibonacci tools, FiboZoneLines divides the entire retracement range into 5 zones and calculates inner Fibonacci levels within each zone — giving you a highly detailed price map that most traders never see.
How It Works
Simply draw a Fibonacci Retracement object on your chart. FiboZoneLines will instantly plot three layers of lines:
Layer 1 — Main Fibonacci Lines The core retracement levels: 23.6, 38.2, 50.0, and 61.8.
Layer 2 — Zone Lines The full range is divided into 5 sub-zones:
- 0.0 ~ 23.6
- 23.6 ~ 38.2
- 38.2 ~ 50.0
- 50.0 ~ 61.8
- 61.8 ~ 100.0
Within each zone, three inner levels are drawn: 38.2, 50.0, and 61.8 of that zone's range.
Layer 3 — Inner Fibonacci Lines Further sub-divisions between the zone 50.0 levels, providing micro support/resistance clusters for precision entries and exits.
Bonus — Top Zone Lines An additional Fibonacci is drawn between the 23.6 main level and the 0.0 origin, revealing hidden resistance levels above the standard range — ideal for detecting breakout targets.
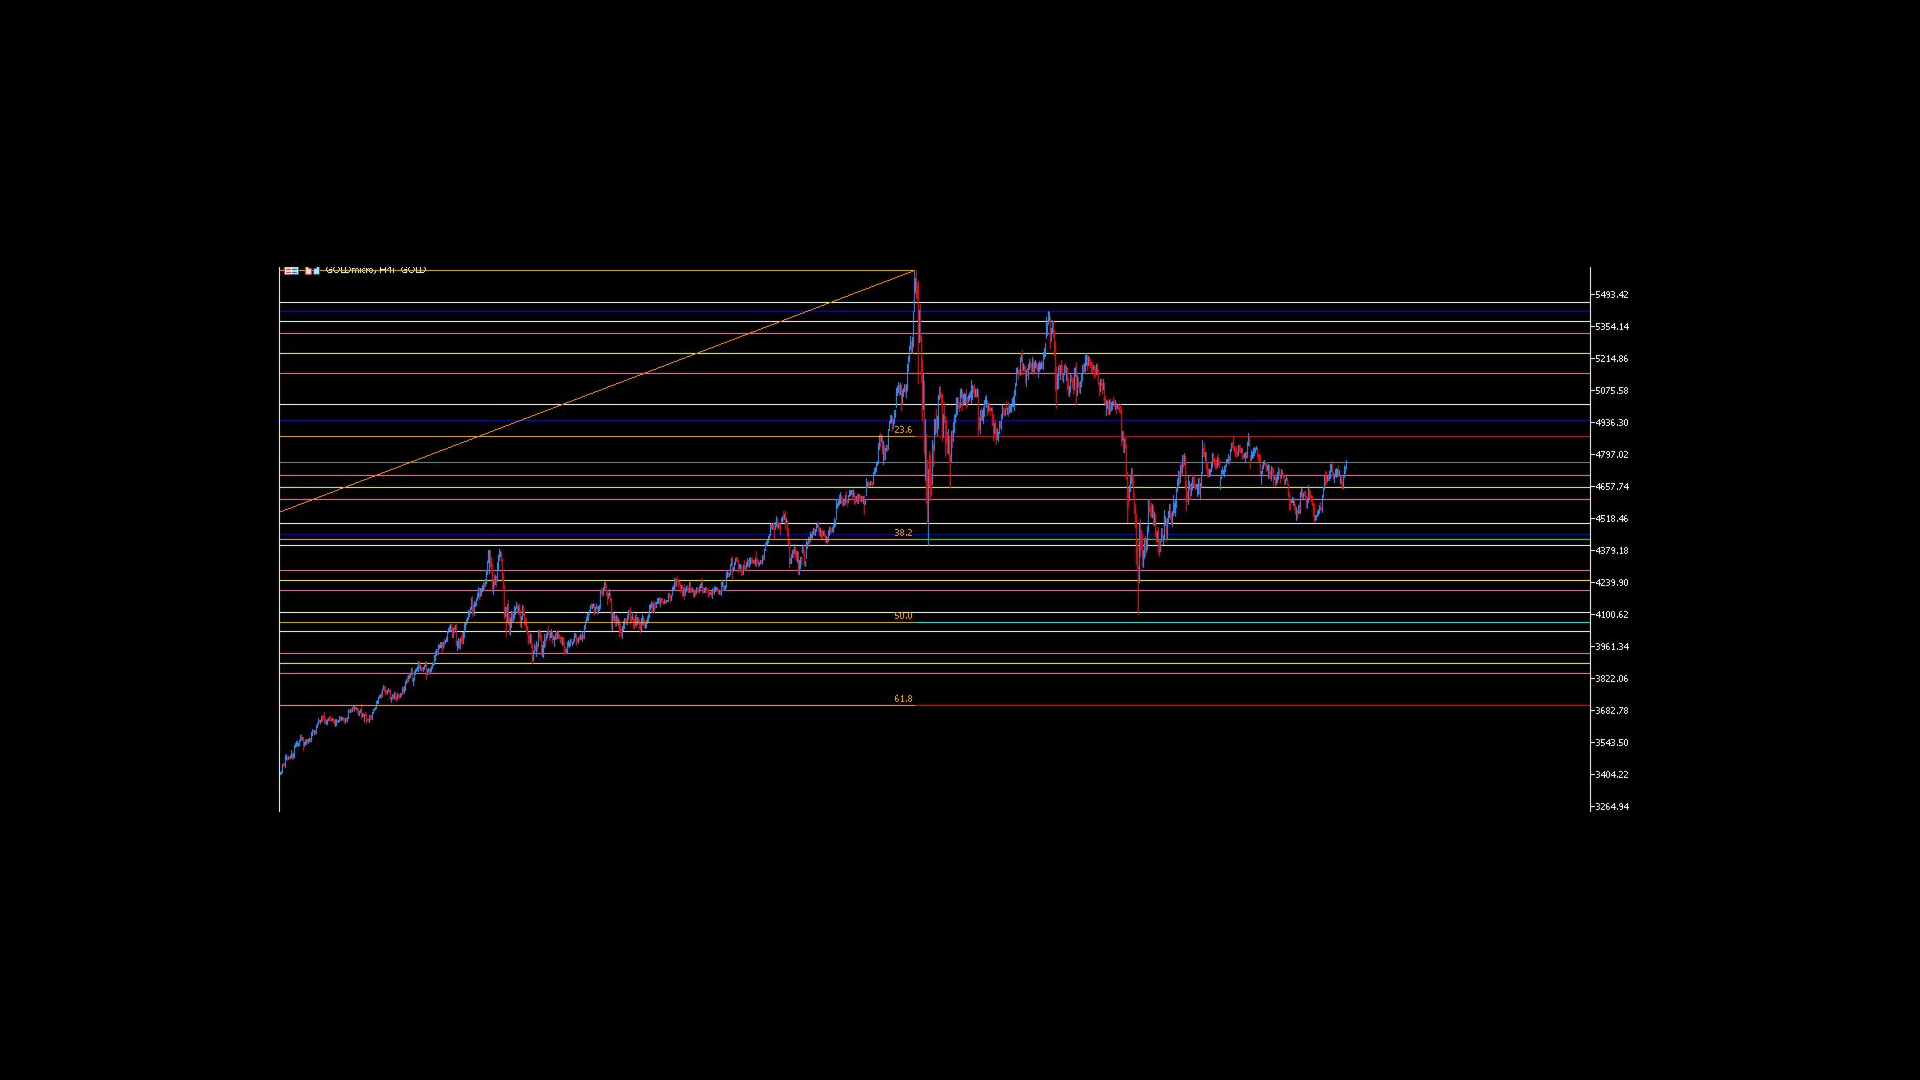
Trading Logic
Zone 50.0 as the Key Level When price breaks above (or below) the 50.0 level within a zone, it signals readiness to move to the next Fibonacci layer.
Confluence = High Probability Reversal At that point, if a separately drawn Fibonacci's 50.0 or 61.8 level confluences with a line from this indicator, the probability of a reversal is significantly higher.
However, if price breaks back through that confluence line, the move is negated — and on the return, that same line becomes a strong wall acting as resistance (or support).
Lines Become Walls When price repeatedly reacts to a line and stalls, that level becomes a strong wall — acting as reliable support or resistance for future price action. The more times price respects a line, the stronger the wall becomes.
Works in Both Directions The zone structure is symmetrical — the same price levels appear whether you draw the Fibonacci from top to bottom or bottom to top. This means the lines work equally well for both long and short setups.
Role Reversal of 38.2 and 61.8 Depending on the direction of the trend, the roles of 38.2 and 61.8 are reversed.
- In a downtrend: 61.8 acts as support (floor) and 38.2 acts as resistance (ceiling)
- In an uptrend: 61.8 becomes resistance (ceiling) and 38.2 becomes support (floor)
This role reversal is a key concept for identifying high-probability trade setups and is one of the most powerful — yet overlooked — principles of Fibonacci analysis.
Key Features
- Fully automatic — just draw one Fibonacci object and all lines appear instantly
- No repainting — lines are based on your manually placed object
- Confluence detection — lines too close together are automatically hidden to keep the chart clean
- Up to N Fibonacci objects supported simultaneously (configurable)
- All colors and line widths are fully customizable
- Labels can be toggled on/off
- Works on all timeframes and all instruments (Forex, Gold, Indices, Crypto, etc.)
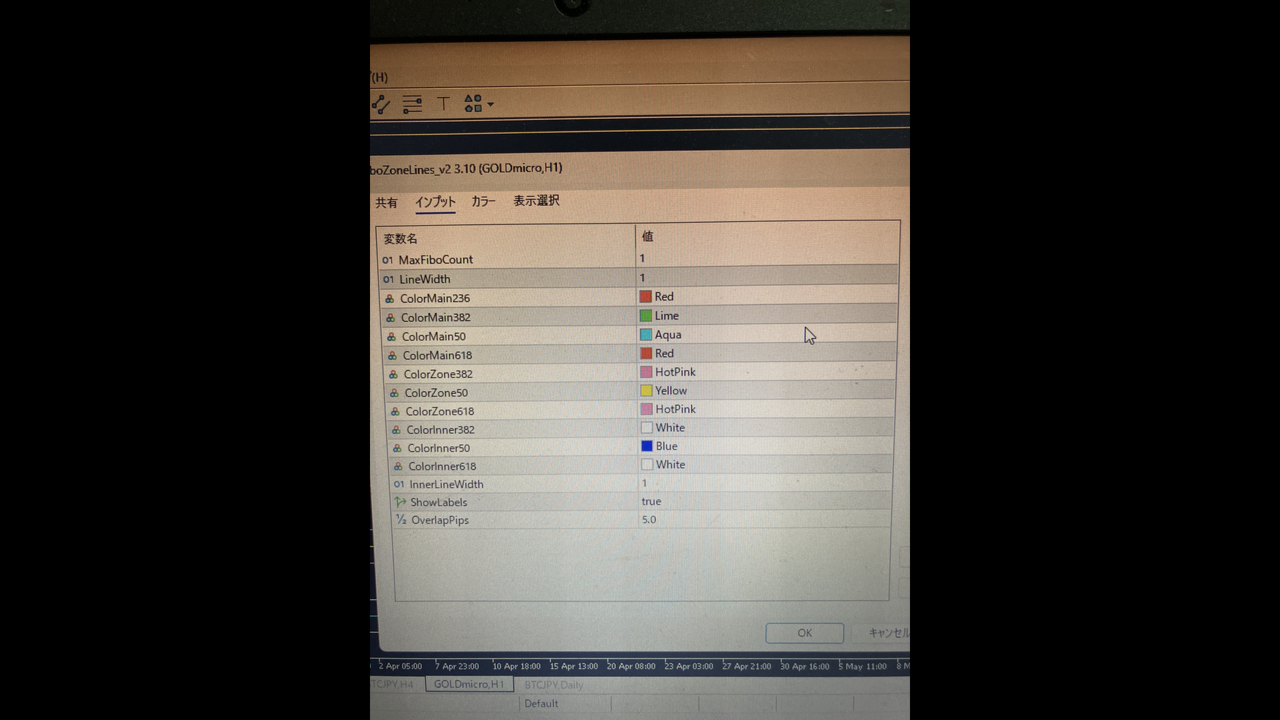
Input Parameters
| Parameter | Default | Description |
|---|---|---|
| MaxFiboCount | 1 | Number of Fibonacci objects to process (leftmost on chart) |
| LineWidth | 1 | Width of main and zone lines |
| InnerLineWidth | 1 | Width of inner Fibonacci lines |
| ColorMain236 | Red | Color of 23.6 main line |
| ColorMain382 | Lime | Color of 38.2 main line |
| ColorMain50 | Aqua | Color of 50.0 main line |
| ColorMain618 | Red | Color of 61.8 main line |
| ColorZone382 | HotPink | Color of zone 38.2 lines |
| ColorZone50 | Yellow | Color of zone 50.0 lines |
| ColorZone618 | HotPink | Color of zone 61.8 lines |
| ColorInner382 | White | Color of inner 38.2 lines |
| ColorInner50 | Blue | Color of inner 50.0 lines |
| ColorInner618 | White | Color of inner 61.8 lines |
| ShowLabels | true | Show/hide line labels |
| OverlapPips | 5.0 | Minimum pip distance to suppress duplicate inner lines |
Who Is This For?
- Fibonacci traders who want deeper market structure beyond standard levels
- Traders of Gold (XAUUSD), Forex majors, indices, and crypto
- Anyone looking for high-confluence zones for entries, exits, and stop placement
- Traders who prefer manual Fibonacci placement with automated zone calculation
Notes
- This indicator does not auto-detect swing highs/lows. You place the Fibonacci object manually — FiboZoneLines does the rest.
- Compatible with MetaTrader 5 only.
- Recommended timeframes: H1, H4, Daily, Weekly
Clean. Precise. Powerful. FiboZoneLines gives your Fibonacci the depth it deserves.