RSIAdaptiveT3
- Göstergeler
- Sürüm: 1.0

RSI Adaptive T3
Short description
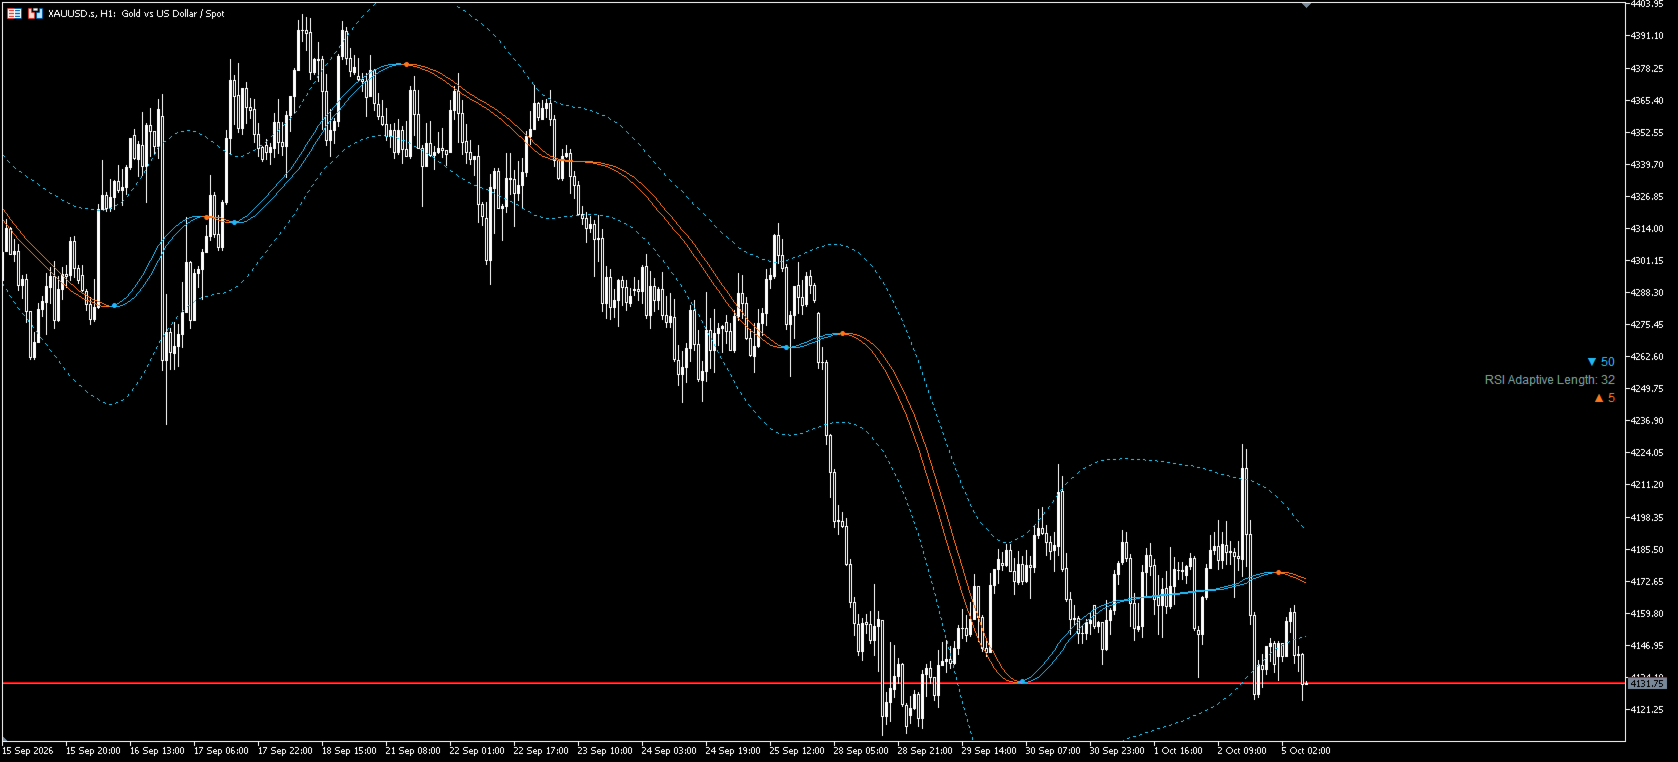
RSI Adaptive T3 is a trend and momentum indicator for MetaTrader 5. It is drawn directly on the price chart and combines two elements: a T3 moving average whose smoothing length changes automatically with the value of the RSI, and a second copy of the same line delayed by two bars. The gap and the crossing between these two lines show the current direction and short-term changes in momentum. Optional volatility bands and crossover markers complete the picture.
What the indicator draws
Adaptive T3 line
The main line is a T3 (Tillson) moving average calculated on the close price. Its smoothing length is not fixed: on every bar the length is derived from the RSI value and kept inside a user-defined range. When the RSI rises, the length becomes shorter and the line follows the price more closely. When the RSI falls, the length becomes longer and the line becomes smoother. The line is repainted in the up color when it is above its own value of two bars ago, and in the down color when it is below.
Delayed line (T3 of two bars ago)
The second line shows the same adaptive T3 shifted two bars into the past. Using two lines instead of one makes the short-term slope visible: when the lines separate, momentum is building; when they come together, momentum is fading. Both lines use the same color logic, so the chart stays readable.
Crossover markers
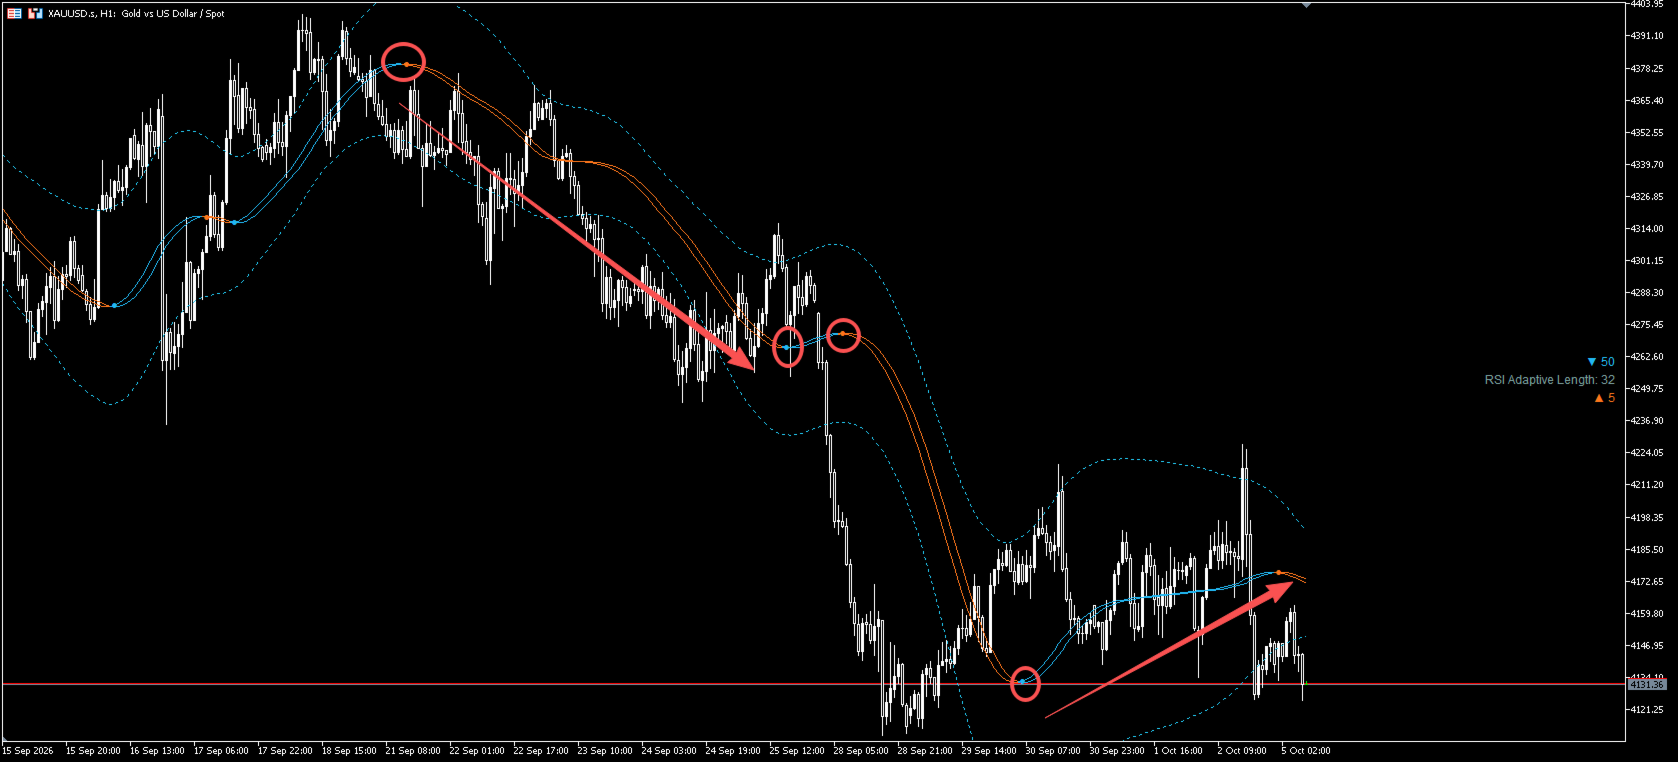
When the current line crosses the delayed line, a small arrow is printed at the level of the adaptive T3 line. An arrow pointing up marks a crossing from below, an arrow pointing down marks a crossing from above. The arrow color follows the same up and down colors as the lines.
Volatility bands
Two dotted lines are placed around the adaptive T3 line at a distance of one standard deviation of the T3 value over the selected volatility period. They show how far the price is currently deviating from the smoothed line compared with its recent behavior. The bands can be switched off.
Length panel
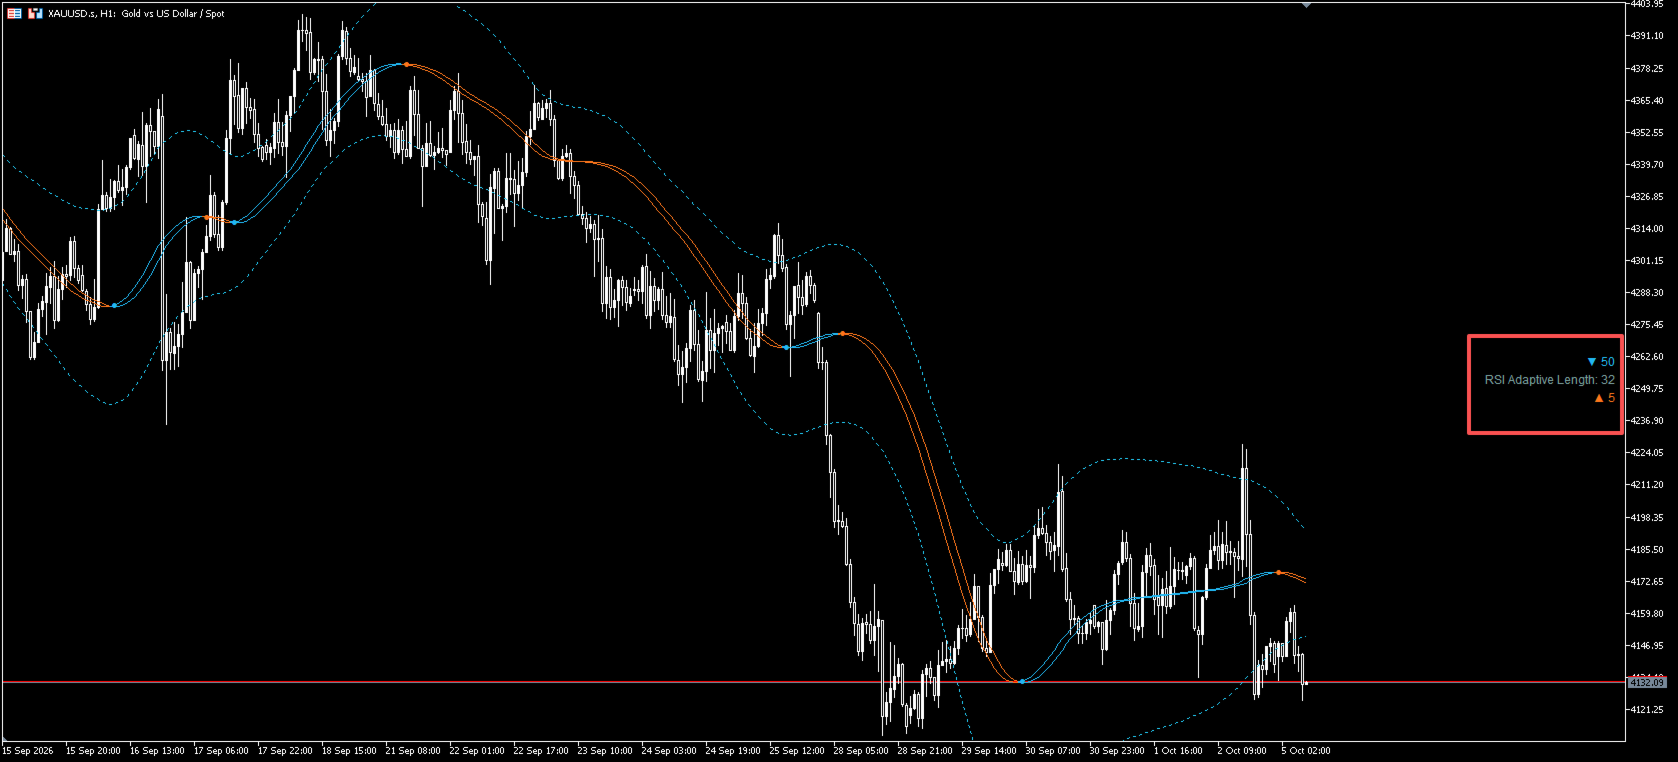
In the upper right corner of the chart, the indicator prints the adaptive length currently in use, together with the lower and upper limits of the allowed range. The number is tinted between the down color and the up color, so the current position inside the range can be seen at a glance. The panel is a chart object and disappears when the indicator is removed.
How it can be used
The indicator works on any symbol and any timeframe and does not depend on a particular trading style. Typical ways of reading it:
- Direction. The color of both lines shows whether the adaptive T3 is rising or falling over the last two bars. A change of color draws attention to a possible change of short-term direction.
- Momentum. The distance between the current line and the delayed line reflects the strength of the move. A growing distance means the move is accelerating, a shrinking distance means it is slowing down.
- Crossings. The arrow markers show the bars where the fast line crosses the delayed line. These bars are often used together with other tools, for example support and resistance levels or a higher timeframe trend filter.
- Volatility. The dotted bands give a visual reference for how unusual the current distance from the line is. When the price moves outside the bands, the current move is stronger than most of the moves inside the selected period.
The indicator is a visual analysis tool. It does not open, manage or close trades, and it does not produce trade orders on its own. All decisions remain with the user.
Input parameters
Calculation
Parameter | Default | Description |
|---|---|---|
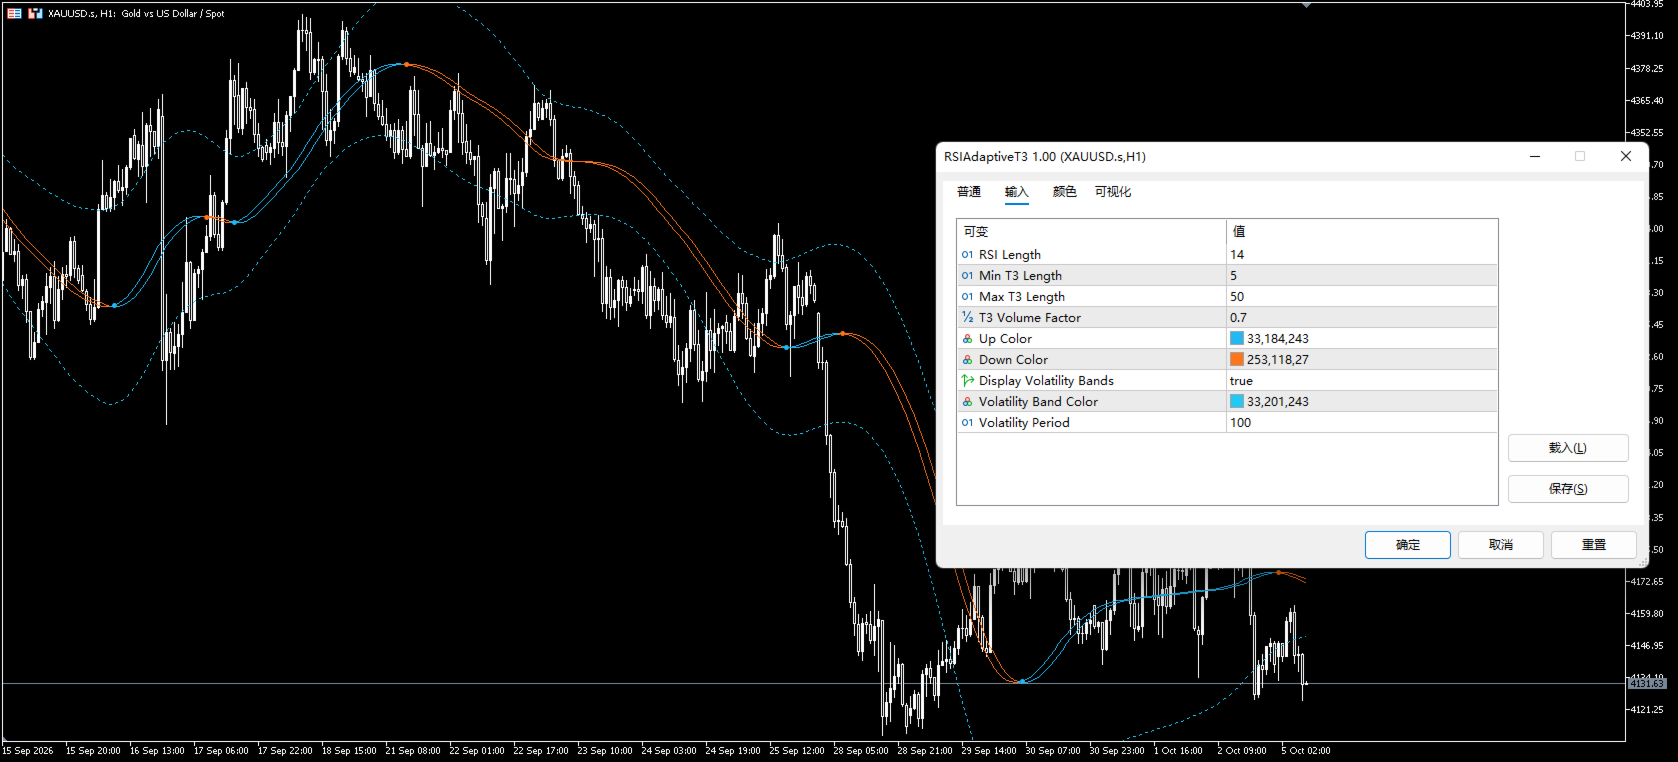
RSI Length | 14 | Period of the Wilder RSI used to control the adaptive length. |
Min T3 Length | 5 | Lower limit of the adaptive T3 length, used when the RSI is at its highest. |
Max T3 Length | 50 | Upper limit of the adaptive T3 length, used when the RSI is at its lowest. |
T3 Volume Factor | 0.7 | Volume factor of the T3 smoothing, from 0 to 1. Higher values give a more responsive line. |
Volatility bands
Parameter | Default | Description |
|---|---|---|
Display Volatility Bands | true | Switches the dotted bands above and below the adaptive T3 line on or off. |
Volatility Period | 100 | Number of bars used to calculate the standard deviation of the T3 value for the bands. |
Volatility Band Color | C'33,201,243' | Color of both dotted bands. |
Colors
Parameter | Default | Description |
|---|---|---|
Up Color | C'33,184,243' | Color of the lines and markers when the adaptive T3 is above its value of two bars ago. |
Down Color | C'253,118,27' | Color of the lines and markers when the adaptive T3 is below its value of two bars ago. |
Installation
Attach the indicator to a chart as usual. The adaptive length needs a short warm-up period: the first bars up to the RSI Length are left empty, and the volatility bands appear after the number of bars set in Volatility Period. All parameters can be changed without reloading the indicator; the chart is recalculated automatically.
Availability
The indicator is currently distributed free of charge. Once the number of downloads exceeds 100, the product will be switched to a subscription offer on the Market. The functionality of the indicator is not affected by this change.
Support
Questions, bug reports and feature requests are handled through the comments section of this product and through the private messages on mql5.com. Please include the symbol, timeframe, terminal build and the parameter values used, so that a reported situation can be reproduced.
Notes
- The product is supplied as a compiled EX5 file for MetaTrader 5 and does not use DLL calls.
- The indicator is drawn in the chart window, so it shares the scale with the price.
- The delayed line and the crossover markers are calculated from the same adaptive T3 value and are shown for reference only.