RSICloud
- Göstergeler
- Sürüm: 1.0
- Etkinleştirmeler: 5

RSI Cloud — RSI Dual Moving Average Cloud Indicator
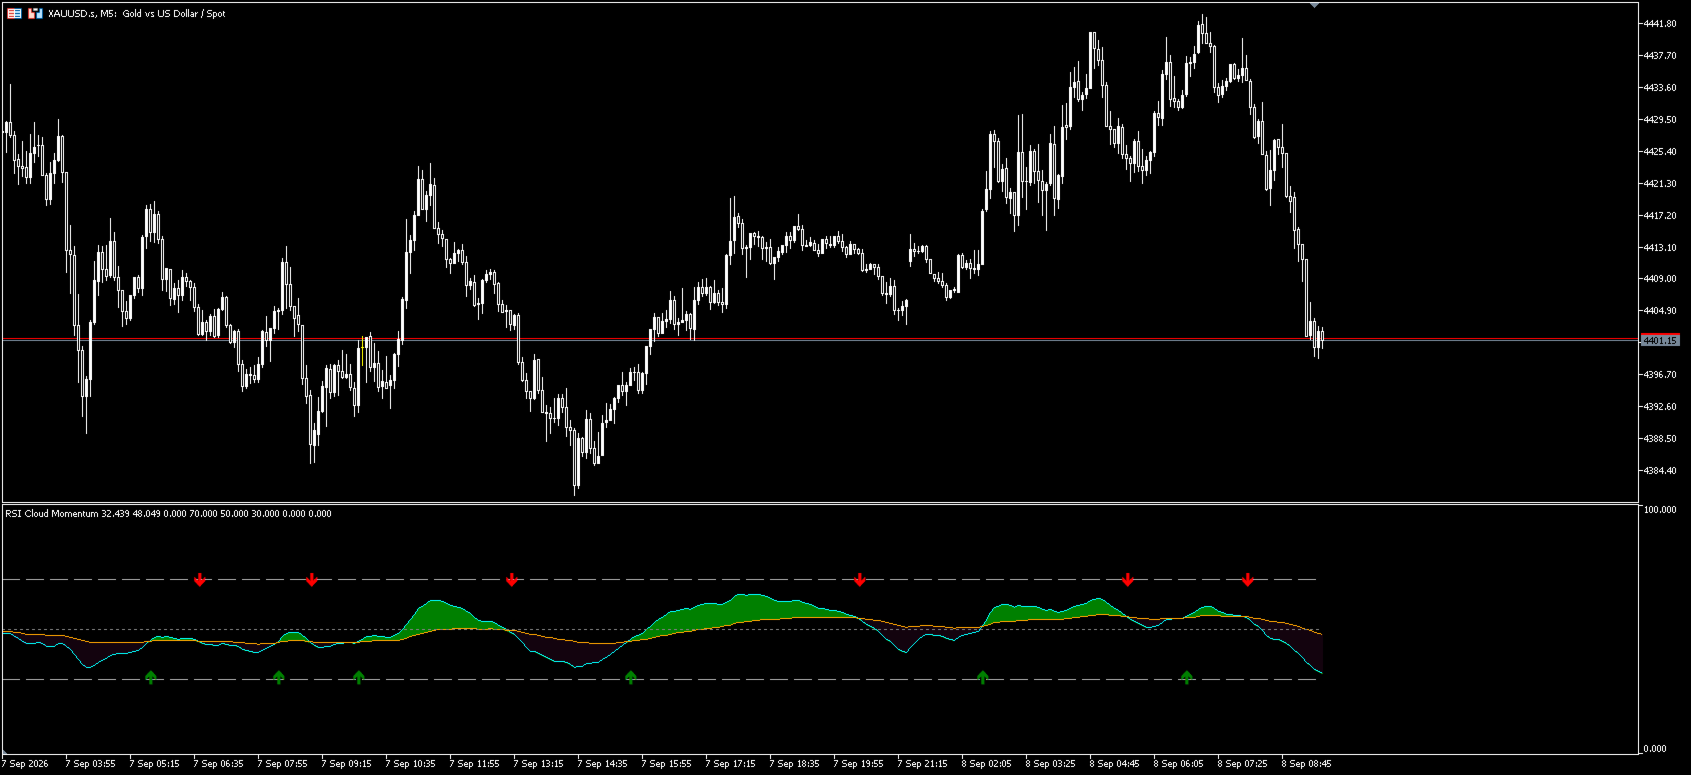
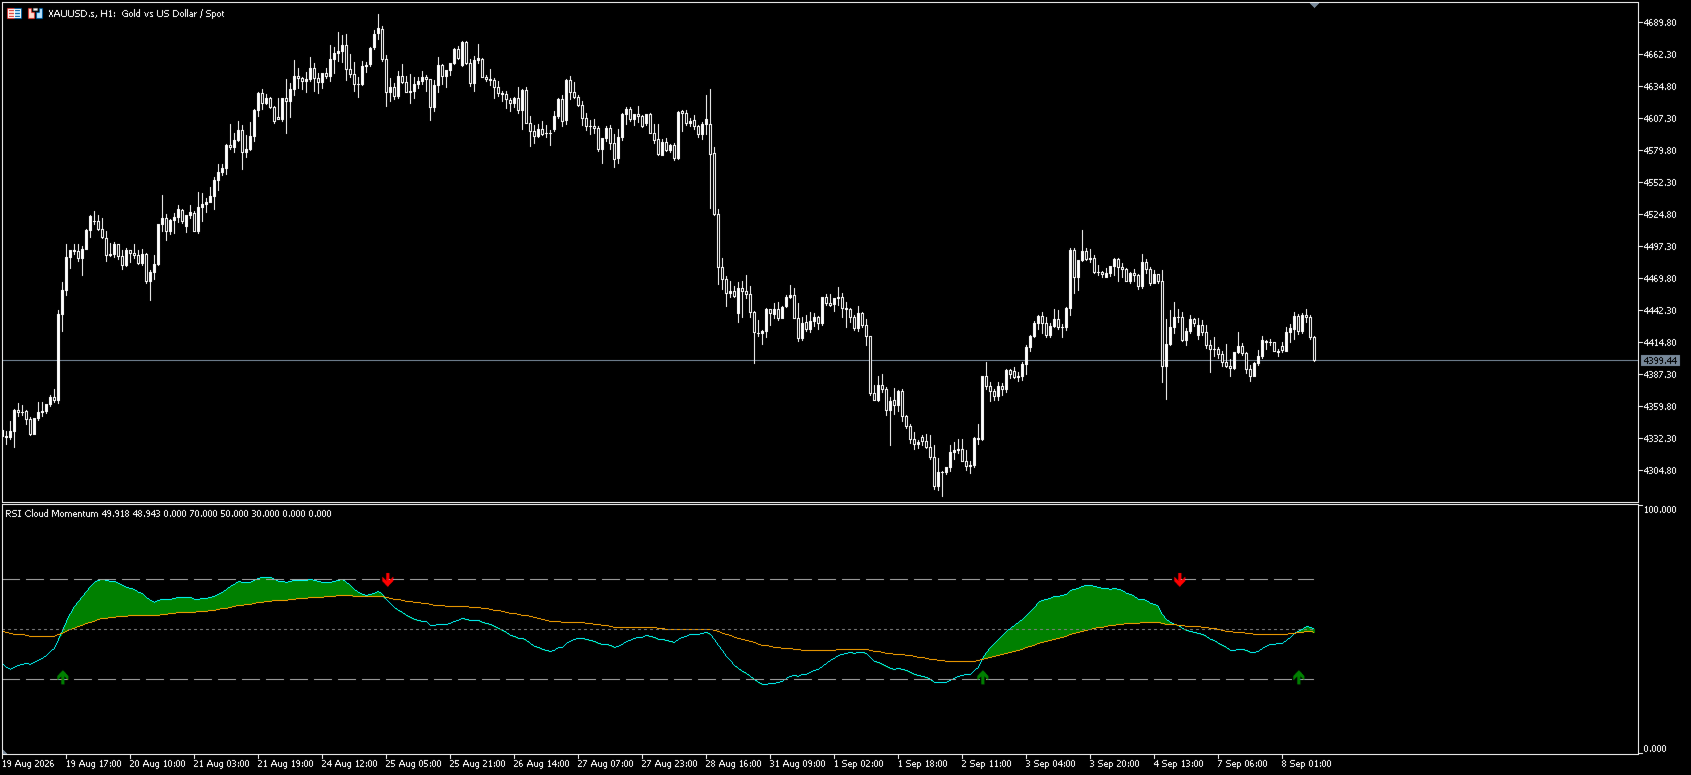
This indicator calculates RSI in a separate window, applies fast and slow moving averages to the RSI values, and displays the relative position of the two averages as a filling cloud. It also provides an optional raw RSI line, fixed 70/50/30 reference levels, and arrow markers when the fast and slow RSI averages cross. The indicator is for analysis and signal filtering only; it does not place trades.
How it works
- Wilder RSI is calculated from the selected price source. Default RSI period is 14. Price source can be close, open, high, or low.
- The RSI series is smoothed by a fast average and a slow average. Average type can be SMA or EMA.
- When the fast RSI average is above the slow RSI average, a bullish cloud is drawn. When the fast average is below the slow average, a bearish cloud is drawn. The cloud shows the relative position of the two averages only.
- An optional raw RSI line can be displayed together with fixed 70, 50, and 30 levels for overbought, midpoint, and oversold reference.
- When the fast and slow RSI averages cross up or down, an arrow is plotted. If popup alerts are enabled, the terminal notifies once on the new bar where the cross is detected.
Input parameters
RSI settings
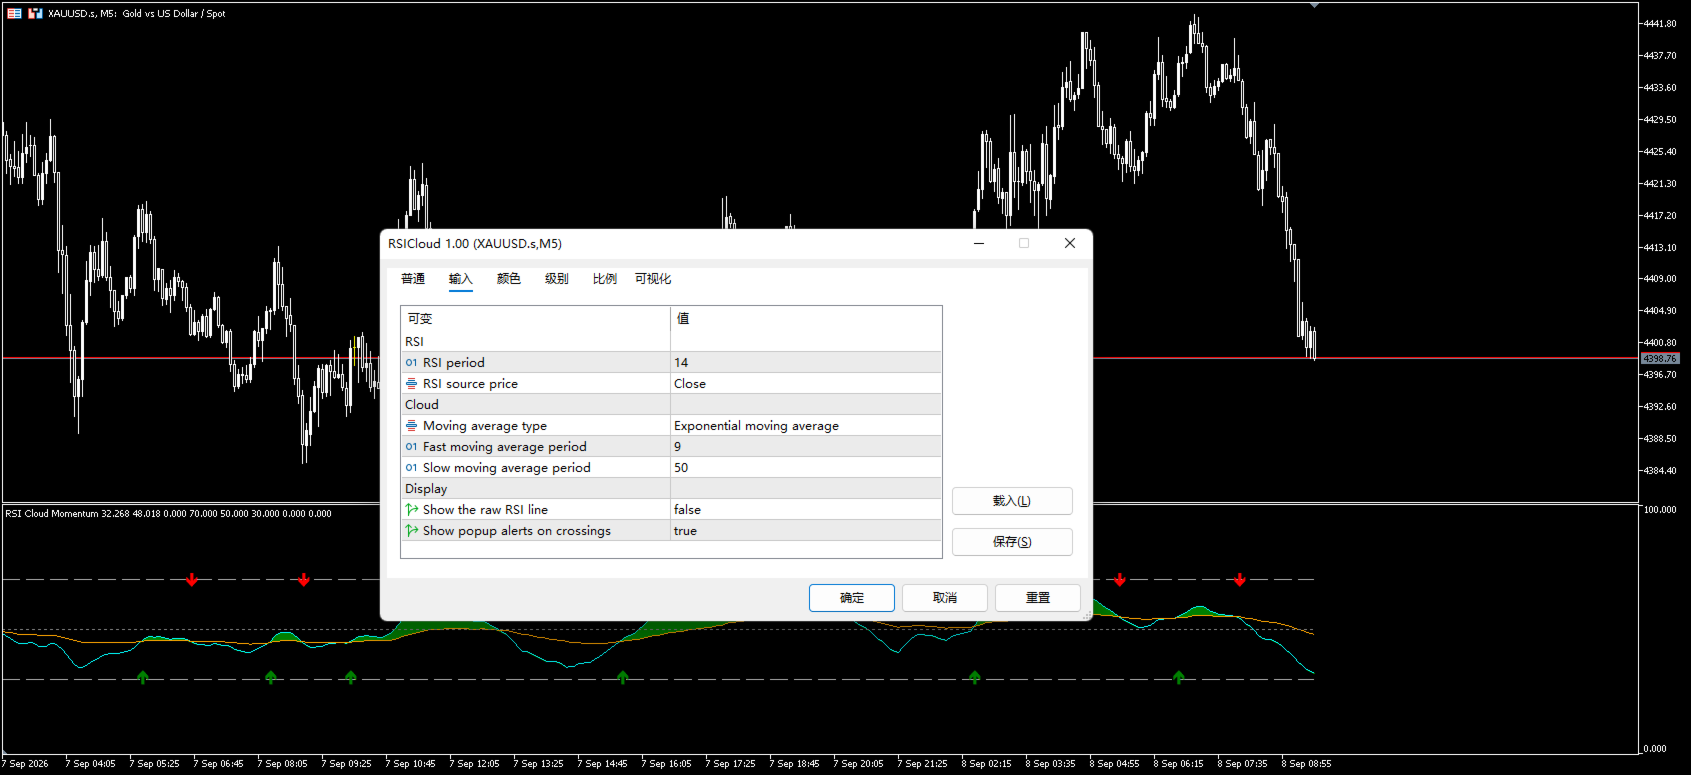
- RSI period: default 14, used for Wilder RSI calculation.
- RSI source price: close, open, high, or low.
Cloud settings
- Moving average type: SMA or EMA.
- Fast period: default 9, used for the fast RSI average.
- Slow period: default 50, used for the slow RSI average.
Display settings
- Show raw RSI: when enabled, the raw RSI line is plotted; when disabled, only the averaged cloud and reference levels are shown.
- Enable alerts: when enabled, a popup alert is sent when the fast and slow RSI averages cross on a new bar.
Plot elements
- Bullish cloud: shown when the fast RSI average is above the slow RSI average.
- Bearish cloud: shown when the fast RSI average is below the slow RSI average.
- Fast RSI average line: used to observe short-term smoothed RSI direction.
- Slow RSI average line: used to observe long-term smoothed RSI direction.
- Raw RSI line: optional, for comparison between smoothed averages and original RSI.
- 70, 50, and 30 lines: overbought, midpoint, and oversold references.
- Cross arrows: upward marker for bullish average cross, downward marker for bearish average cross.
Usage notes
The indicator is designed as an auxiliary filter for momentum and trend strength. A bullish cloud means the fast RSI average is relatively stronger than the slow average; a bearish cloud means the opposite. It can be combined with price structure, volume, higher-timeframe bias, and a clear risk plan.
Values on the forming bar are updated with each tick. For signal confirmation, it is recommended to check arrow and cloud status after the bar closes, and to test all parameters on a demo account first.
Alerts and performance
Alerts are based only on fast/slow RSI average crosses and are limited to one notification per new bar by default. If popup alerts are not required, disable “Enable alerts”. The indicator uses 12 buffers and incremental Wilder RSI calculation, which keeps normal-timeframe resource usage low.
Risk disclaimer
This indicator provides technical calculations based on historical and real-time data. It is not investment advice and does not guarantee profit. Trading forex, CFDs, and derivatives involves substantial risk, including possible loss of capital. Test the indicator thoroughly on a demo account and adjust parameters according to your risk tolerance.
For support, please use the product comment section or MQL5 internal messaging.