EFPercentageChannel
- Göstergeler
- Sürüm: 1.20

EF Percentage Channel
A trend-state indicator that combines volatility-adaptive averaging, an Ehlers nonlinear filter, and statistical percentile bands into a single, self-adjusting channel.
Overview
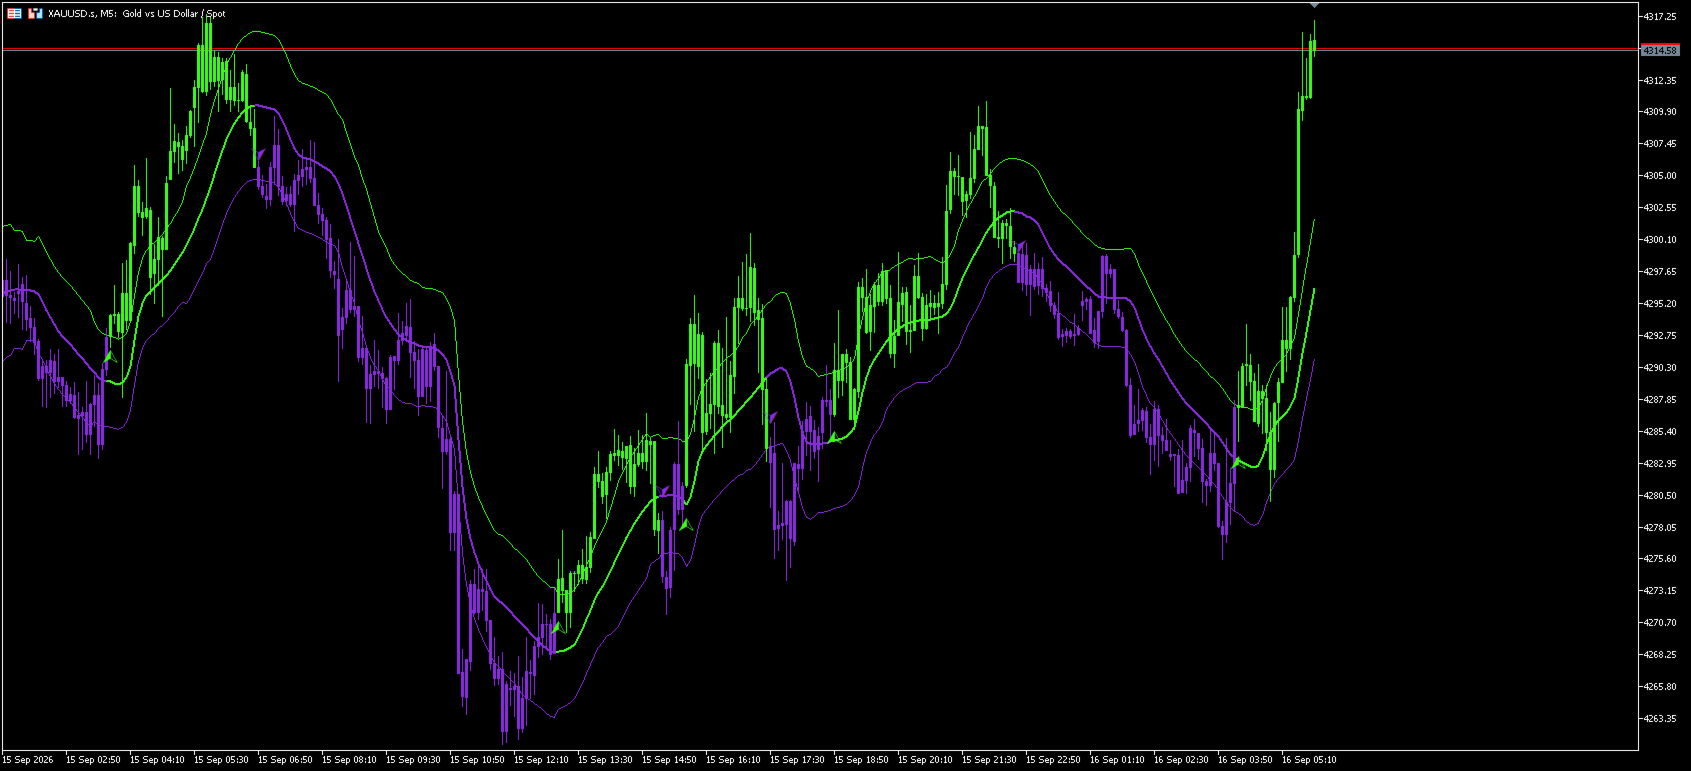
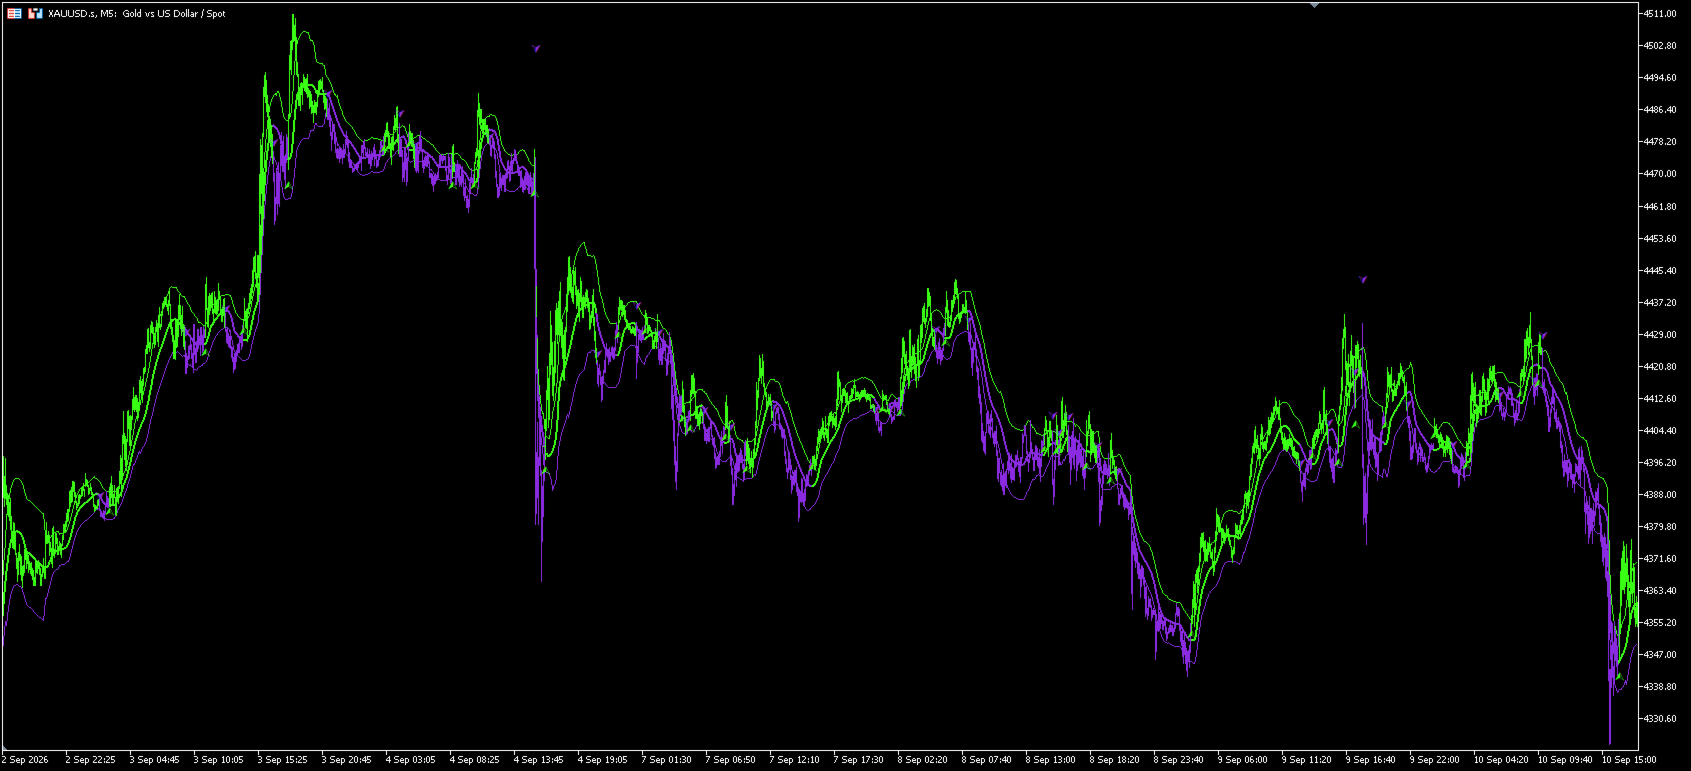
The indicator builds an adaptive trend baseline on the chart and wraps it with statistical percentile bands. When price moves above the upper band, the market is flagged as bullish; below the lower band, bearish; inside the channel, the previous state is retained. The trend line, channel bands, candles, and state-flip arrows are all colored according to the active state, making trend structure immediately readable.
How It Works
-
Price source — applied price is selectable (close, open, high, low, median, typical, weighted).
-
Volatility measure — a rolling standard deviation of bar-to-bar price changes is computed, then smoothed by its own moving average.
-
Adaptive average — the smoothed volatility is mapped to a moving-average period between 3 and 30 (default). Higher volatility shortens the period to reduce lag; lower volatility lengthens it to suppress noise.
-
Ehlers nonlinear filter — a nonlinear weighting is applied to the adaptive average. Each weight is proportional to the displacement of price relative to a reference point several bars back. During trends, weight concentrates on recent prices; in flat markets, it degenerates to an equal-weight average.
-
Percentile channel — the rolling percentile of the distance between price and the filtered value defines the upper and lower bands. Channel width is driven by the recent distribution of actual deviations rather than a fixed multiplier.
-
State machine — price above the upper band → bullish; below the lower band → bearish; inside the channel → previous state is held. Signals fire only on state transitions.
Key Features
-
Adaptive by design — both channel width and smoothing speed adjust automatically to market volatility
-
State-holding logic — no new signals inside the channel, reducing whipsaw in ranging conditions
-
Multiple visual layers — colored trend line, channel bands, state-colored candles, and flip arrows can each be toggled independently
-
Hide original candles — optionally hide the chart's native candles and display only state-colored ones
-
Customizable colors — bullish and bearish colors are fully configurable from the inputs
-
Stable history — values on closed bars are not rewritten as new data arrives
Input Parameters
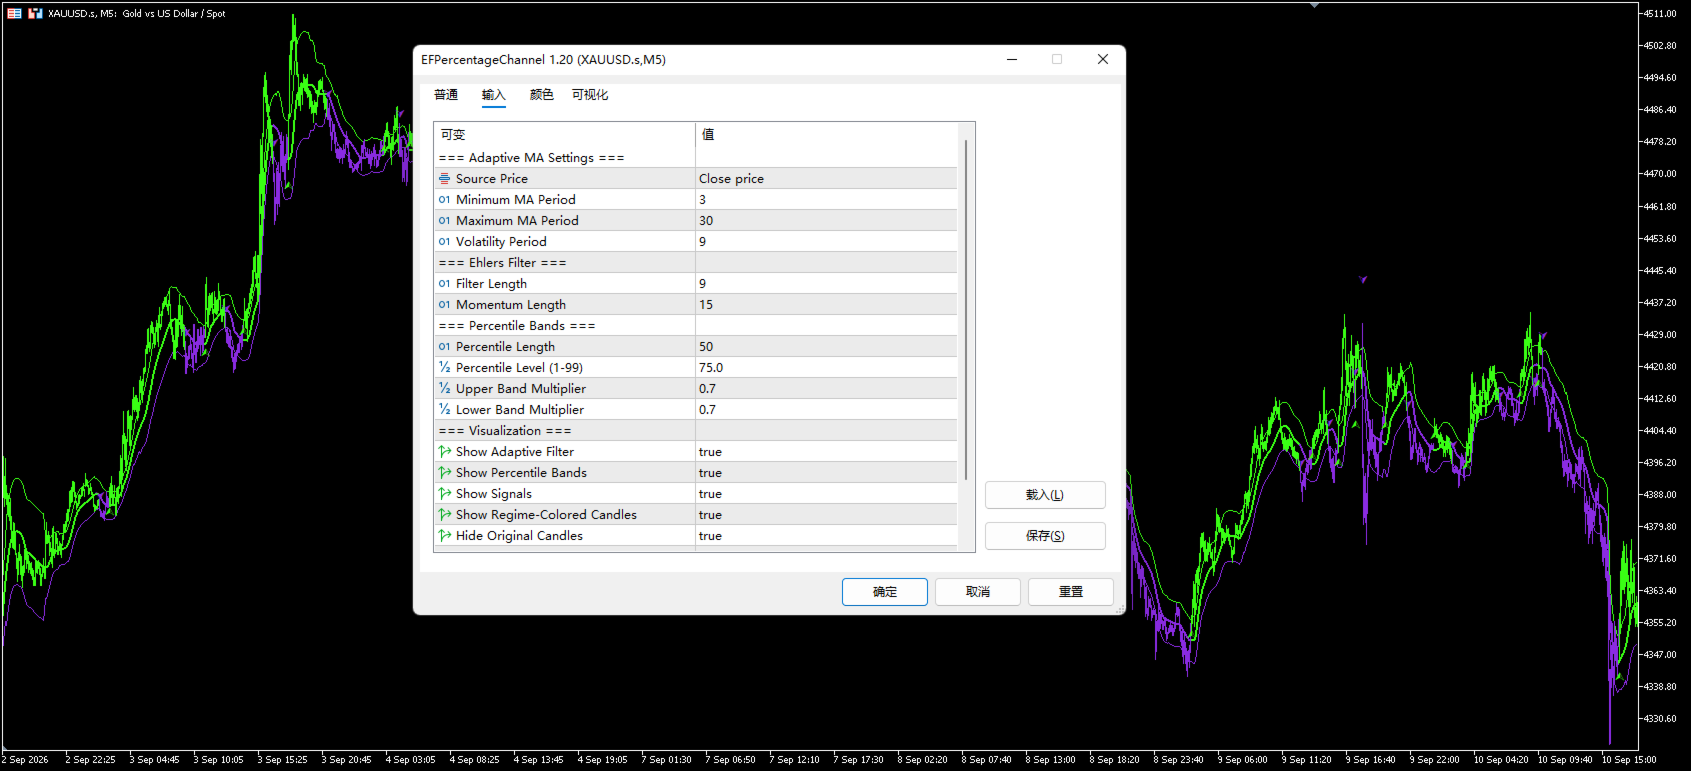
| Group | Parameter | Default | Description |
|---|---|---|---|
| Adaptive MA | InpSource | PRICE_CLOSE | Applied price |
| InpMAMin | 3 | Minimum averaging period | |
| InpMAMax | 30 | Maximum averaging period | |
| InpVolLen | 9 | Volatility window | |
| Ehlers Filter | InpEhlersLen | 9 | Filter length |
| InpEhlersMom | 15 | Momentum reference distance | |
| Percentile Bands | InpPctLen | 50 | Percentile window |
| InpPctLevel | 75.0 | Percentile level (1–99) | |
| InpUpperMult | 0.7 | Upper band multiplier | |
| InpLowerMult | 0.7 | Lower band multiplier | |
| Visualization | InpShowMA | true | Show trend line |
| InpShowBands | true | Show channel bands | |
| InpShowSignals | true | Show signal arrows | |
| InpShowCandles | true | Show state candles | |
| InpHideOriginal | true | Hide original candles | |
| Colors | InpLongColor | Lime | Bullish color |
| InpShortColor | MediumOrchid | Bearish color |
Usage Notes
-
Trend direction — the trend line color reflects the current state and can be used as a directional filter
-
Breakout observation — a decisive break of either band typically coincides with a volatility expansion phase
-
Entry reference — arrows mark state flips; consider combining them with a higher-timeframe trend or additional confirmation
-
Parameter tuning — a larger percentile window produces a smoother but slower channel; a higher percentile level widens the channel and reduces signal frequency
-
Multi-market validation — volatility characteristics vary widely across symbols and timeframes; test in the Strategy Tester before use
Important Notes
-
This indicator is a technical analysis tool. It provides an objective description of market state and does not constitute investment advice.
-
On an unclosed bar, values update in real time and the state may change within the bar.
-
Enabling "Hide original candles" modifies the current chart's display properties; these are restored automatically when the indicator is removed.
-
Validate thoroughly on a demo account or in the Strategy Tester before live use.