Inverseprobabilitydistribution

Inverse probability distribution — Analytical Visualization Tool Based on Pivot Points & K-Means Clustering

Overview
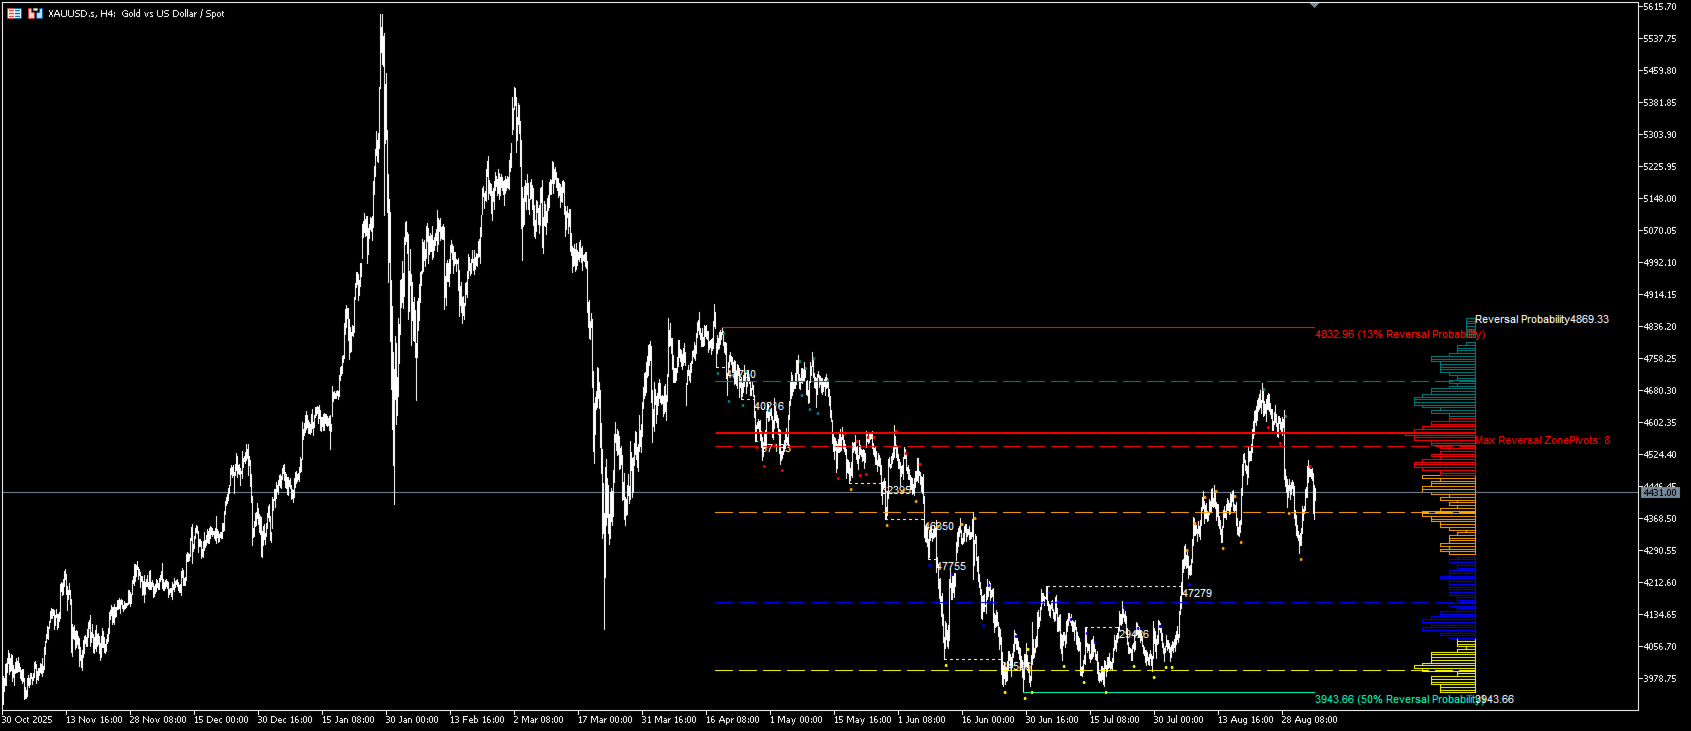
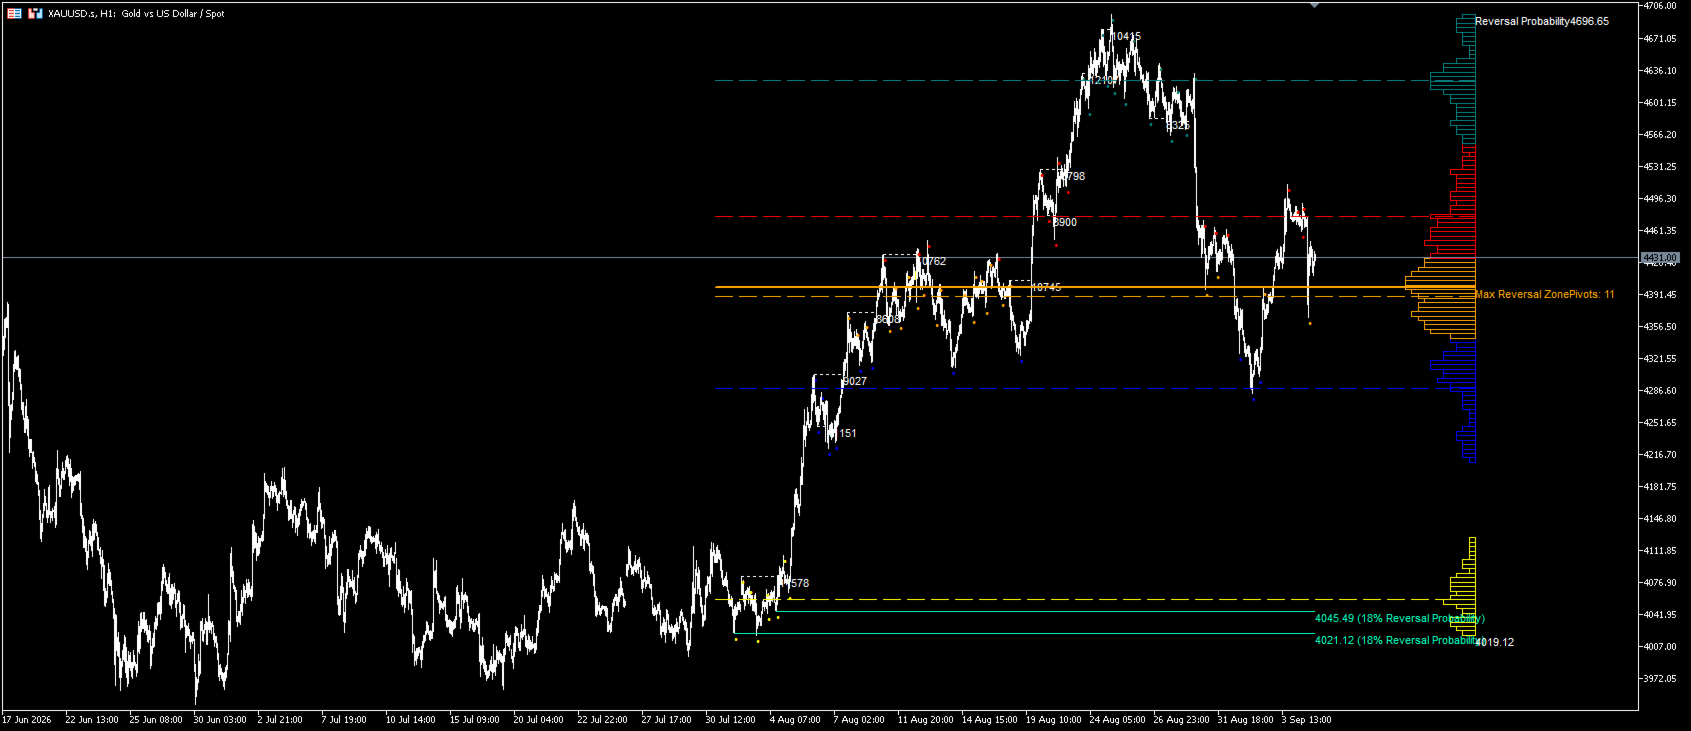
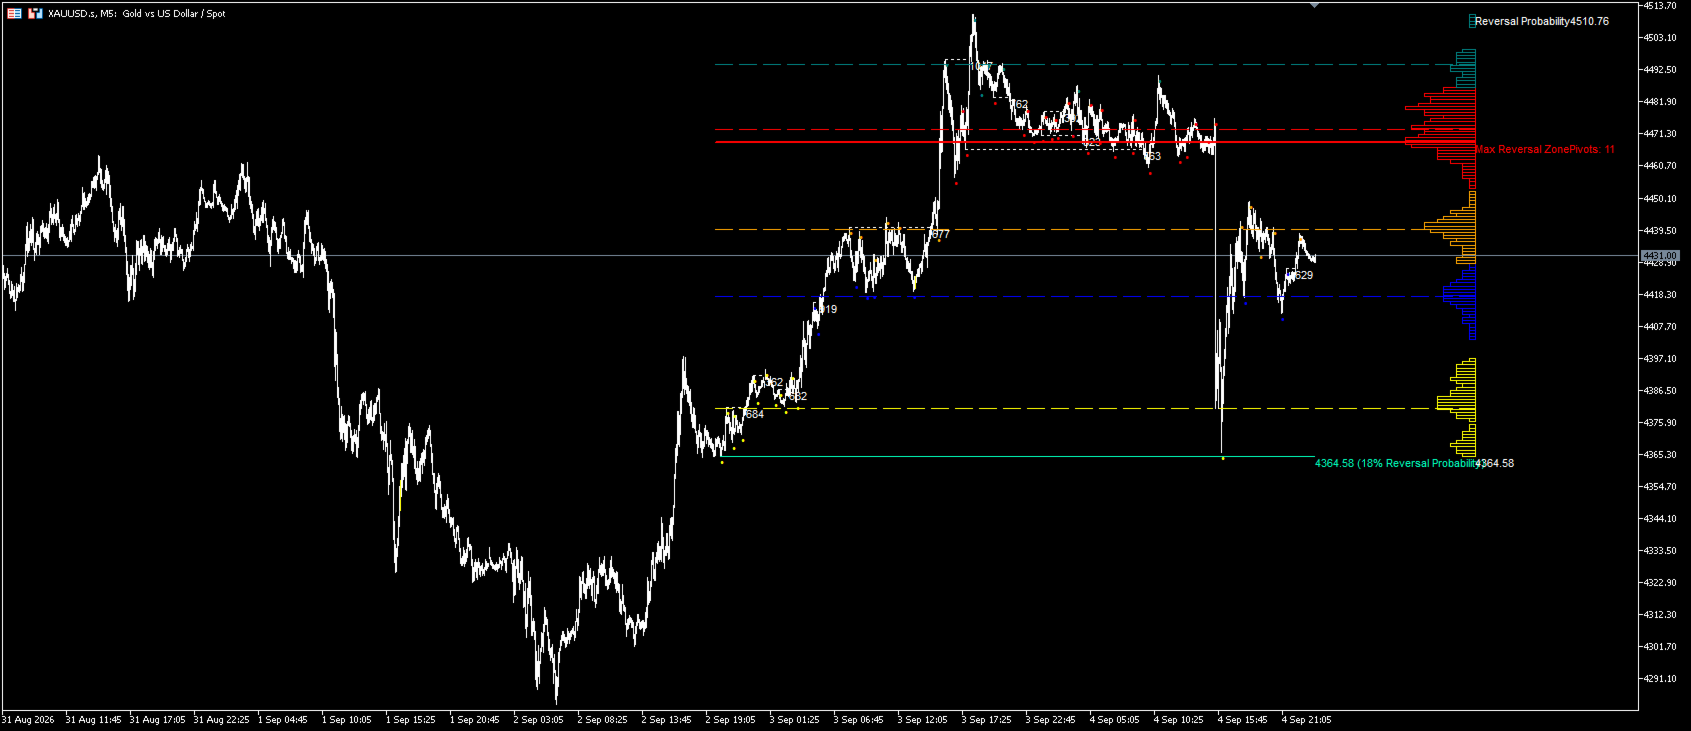
This indicator is a pure technical-analysis visualization tool​ for MetaTrader 5. It detects confirmed pivot highs/lows on historical bars, groups pivot prices using K-Means clustering, and builds a Inverse probability distribution projected to the right of the chart — allowing traders to visually inspect how pivot points are statistically distributed across price levels.
⚠️ This indicator does not generate trading signals and does not execute any trades. It only presents a statistical distribution of historical pivot points and reference support/resistance levels on the chart.
How It Works
  1. Pivot Detection​ — Using user-defined left/right bar parameters, each bar is strictly evaluated as a pivot high (local maximum of high ) or pivot low (local minimum of low ).
  2. Pivot Memory & Pruning​ — Detected pivots are stored and automatically pruned according to InpPivotMemory (storage cap) and InpLookbackBars (lookback window).
  3. K-Means Clustering​ — Stored pivot prices are clustered via K-Means ( InpClusterCount clusters, InpKMeansIterations optimization passes), partitioning the price axis into statistical groups.
  4. Profile Construction​ — Within the InpLookbackBars window, pivots are binned at InpProfileBins resolution with InpBinSmoothing radius; the bin with the highest count is marked as the POC (Point of Control).
  5. ATR-Filtered S/R Lines​ — An ATR-based ( InpAtrPeriod × InpAtrMultiplier ) overlap threshold prevents excessively dense pivot lines; support (pivot low) and resistance (pivot high) reference lines are drawn and visually de-emphasized after a break.
Key Features
  • Reversal Probability Profile​ (histogram) projected to the right of the chart; width controlled by InpProfileWidth , offset by InpProfileOffset
  • POC marker​ with dominant cluster color highlight
  • K-Means cluster center lines​ (dashed)
  • ATR-filtered pivot support/resistance lines​ that automatically switch style upon break
  • Optional pivot dots​ colored by cluster
  • Optional bin text​ (probability % or raw count)
  • Optional alerts​ (on POC touch or high-probability zone touch) — disabled by default
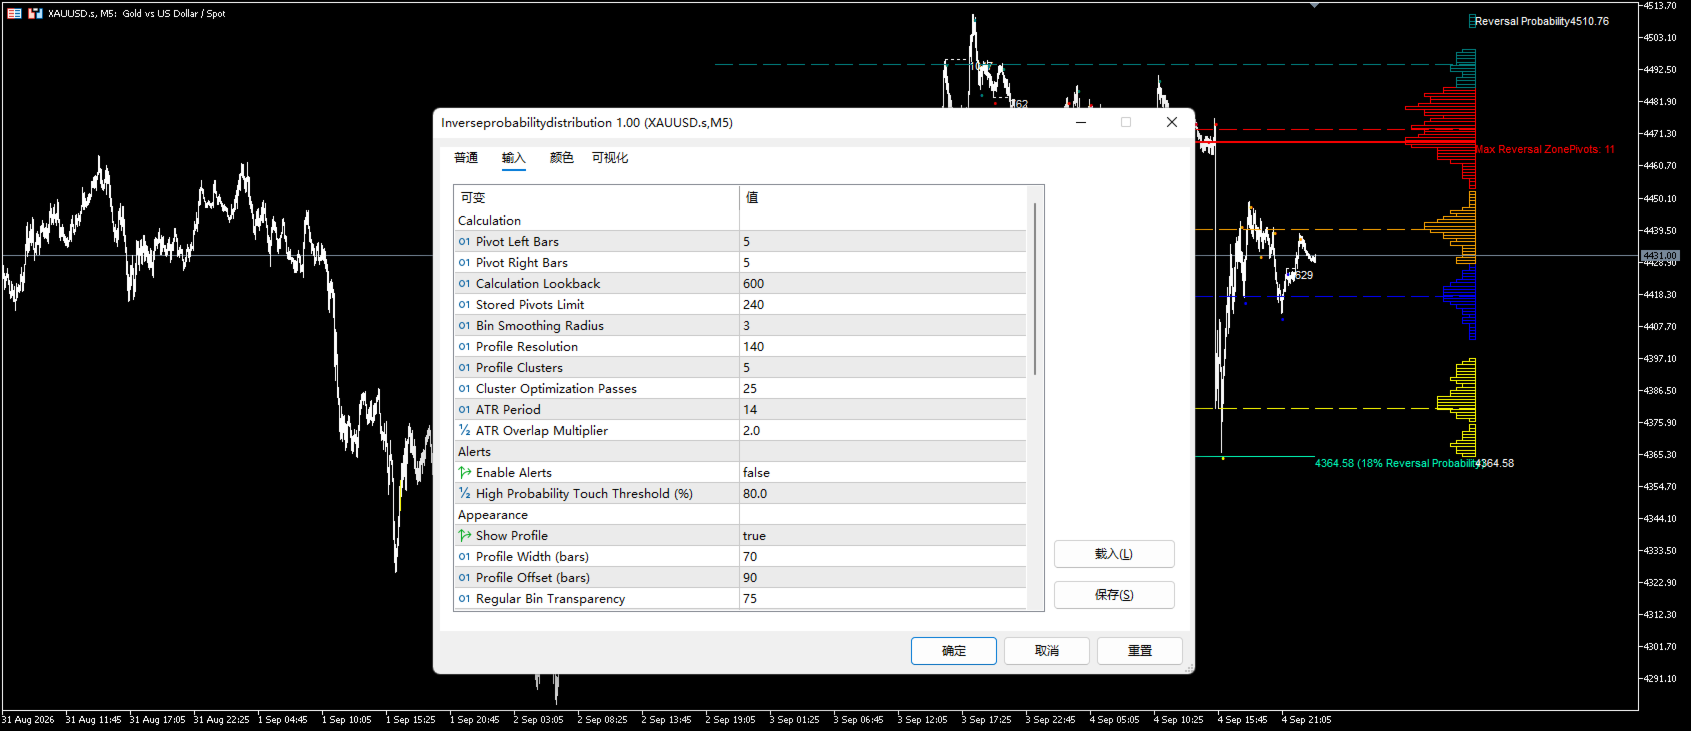
Main Input Parameters
Parameter
Description
Pivot Left / Right Bars
Bars to the left / right for pivot confirmation
Calculation Lookback
Number of bars used for calculation
Stored Pivots Limit
Maximum number of pivots kept in memory
Profile Resolution
Number of histogram bins
Profile Clusters
K-Means cluster count
Cluster Optimization Passes
K-Means iteration count
ATR Period / Multiplier
ATR period and overlap-threshold multiplier
High Probability Threshold
Alert threshold for high-probability zones (%)
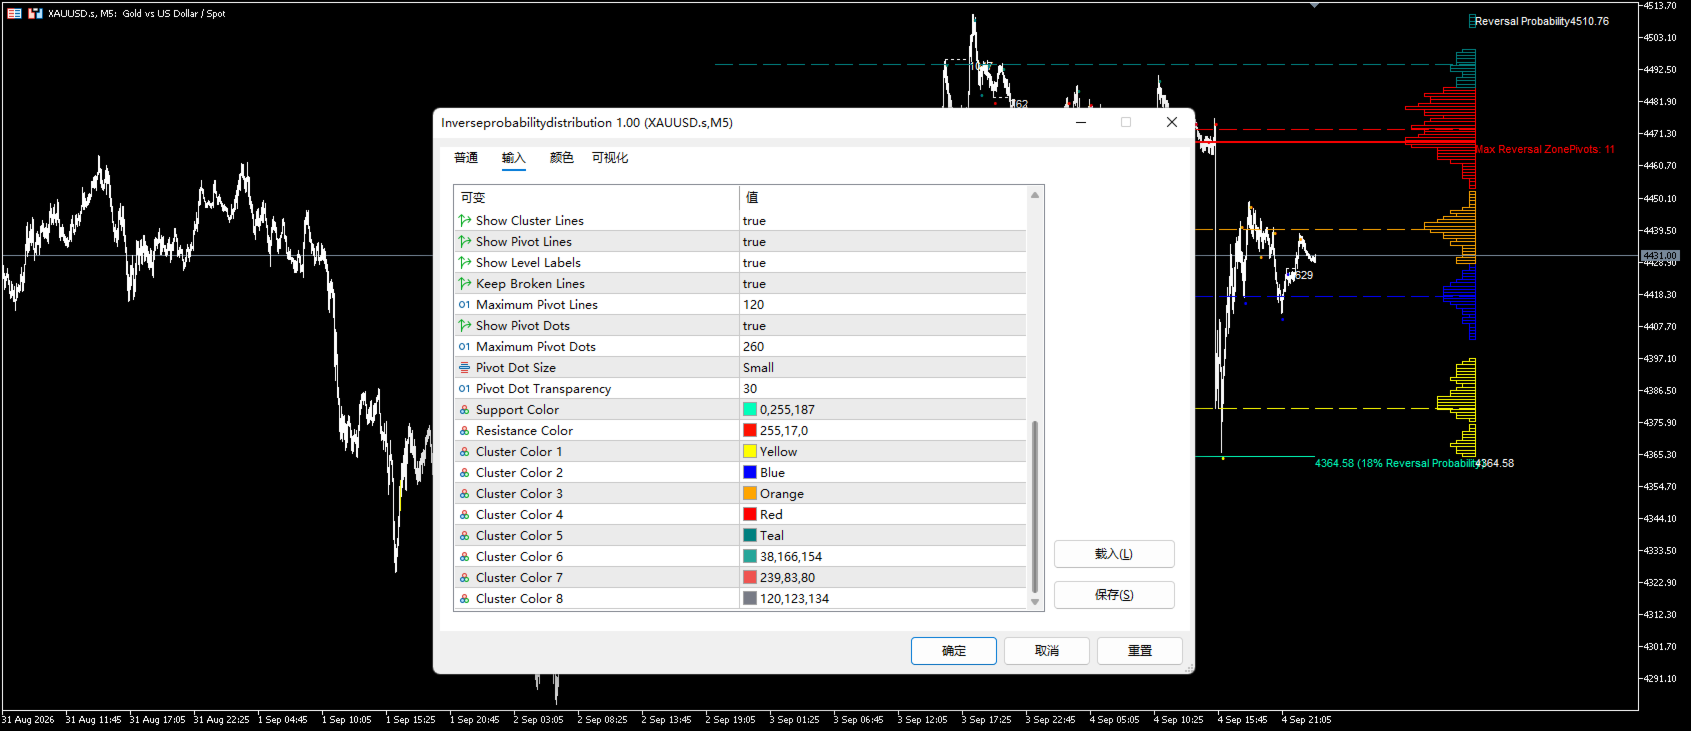
Appearance parameters (colors, transparency, line width, text mode, dot size, etc.) are all configurable under the "Appearance" input group.
Usage
  1. Place Inverseprobabilitydistribution.mq5 into MQL5/Indicators/ , compile, then drag onto a chart from the Navigator
  2. Adjust Pivot Left/Right Bars and ATR Multiplier according to the volatility of your instrument
  3. The profile appears on the right side of the chart — longer bars indicate higher historical pivot density at that price region
  4. The POC line marks the price level with the highest historical reversal density; support/resistance lines help identify potential price-reaction zones
  5. Observe extensively on a demo account​ before using for live-reference purposes
📌 Risk Disclosure: This indicator is a visualization of historical-price statistics only. It does not constitute investment advice and does not predict future price movement. A high pivot density does not guarantee that price will reverse. Users bear full responsibility for their trading decisions.
Compatible Instruments: All MT5 symbols — forex, CFDs, futures, indices.
Recommended Timeframes: 5-minute and above; very low timeframes may reduce readability due to pivot noise.

Yazarın diğer ürünleri
FibonacciSuite
Shi Yuan Wang
5 (1)
Title: Fibonacci Suite — Advanced Multi-Swing Confluence & Adaptive Fibonacci Indicator The Fibonacci Suite is a premium technical analysis indicator designed for MetaTrader 5. It automatically draws classic Fibonacci retracement and extension levels, and integrates multi-swing confluence detection, adaptive volatility adjustment, Golden Pocket highlighting, Fibonacci time zones, and a real-time status table. Whether you are a trend follower or a pullback trader, this tool provides clear, action
FREE
MACandleApprox — Moving-Average Approximate Candle Indicator MACandleApprox is a custom indicator that, on the main price chart, applies a selected type of moving average to the open, high, low, and close price series respectively, and replots them as "approximate candles". It does not modify the original candlesticks; instead, it overlays a smoothed candle view based on moving averages, helping traders observe the smoothed price movement and directional changes more intuitively. The indicator s
FREE
Daily trend strength (Daily Trend Strength) The Daily trend strength  is a visual analytical tool designed to track the relative strength of price movement compared to the daily opening price. It displays the percentage change of the current price from the daily open, using a color-coded line and area fill for instant trend recognition. Key Features Daily Percentage Change: Shows how far the price has moved from the daily open in percentage terms. Color-Coded Visualization: Green indicates price
FREE
Adaptive MACD - R² Based Adaptive MACD Indicator Overview Adaptive MACD is an innovative MetaTrader 5 indicator that improves upon the traditional MACD. By introducing the Pearson correlation coefficient to calculate the R² value of price trends, this indicator can adapt to market conditions and dynamically adjust its sensitivity. It helps traders capture trends more effectively while filtering out market noise. How It Works Traditional MACD uses a fixed difference between fast and slow EMAs. Ad
FREE
ZigZag Trader EA - Intelligent ZigZag Trading Assistant Introduction ZigZag Trader EA is a fully automated trading assistant based on the ZigZag indicator. It intelligently identifies previous highs and lows of the ZigZag indicator, combined with an advanced risk management system, to provide you with precise trading signals and automated trade execution. Whether you are a novice or experienced trader, ZigZag Trader EA can help you simplify trading decisions and achieve stable trading performa
FREE
# MASignalPanel — Multi-MA Signal Panel with Trend Filter ## Overview MASignalPanel is an all-in-one moving-average signal indicator designed for MetaTrader 5. It combines up to three moving averages (SMA, EMA, SMMA, LWMA) with four trade signal modes — Cross, Breakout, Pullback and Channel — and adds a higher-timeframe trend filter line (default EMA240) to keep you on the right side of the market. A fully interactive control panel lets you change MA type, MA count, periods, s MA indicator, movi
FREE
MACandleApproxPro — Advanced MA Candle Reconstruction & Multi-Dimensional Market Structure Indicator Overview MACandleApproxPro ​ is a comprehensive technical analysis tool designed for professional traders. It breaks through the limitations of traditional moving averages by reconstructing MA data into "MA Candles" ​ through complex algorithms. This unique visualization filters out market noise, allowing you to examine price trends, momentum shifts, and critical market structures from a more
SweepReversalMap — Liquidity Sweep Reversal Zone Mapper Overview SweepReversalMap is a price-action-based custom indicator that detects "Liquidity Sweep" events and maps potential reversal zones once price reclaims the swept level. It works on any symbol and timeframe. Core Logic Pivot Detection : Identifies the most recent valid swing high/low based on user-defined Swing Length. Sweep Trigger : When price penetrates the swing high (or low) by at least the ATR-filtered minimum penetration thres
FREE
HubDynamicTrendLine This indicator identifies strict pivot highs and lows based on N bars to the left and right (default 15), connecting consecutive pivots of the same type to build a dynamic channel with upper and lower boundaries. Key Features Pivot Connections : Consecutive pivot highs and pivot lows are connected with solid trend lines, forming a visible channel structure. Slope Projection : When the price difference between two consecutive pivots of the same type is at least one 200-period
FREE
Filtrele:
Değerlendirme yok
Değerlendirmeye yanıt