Pattern Screener Pro
- Yardımcı programlar
- Sürüm: 1.50
- Etkinleştirmeler: 10

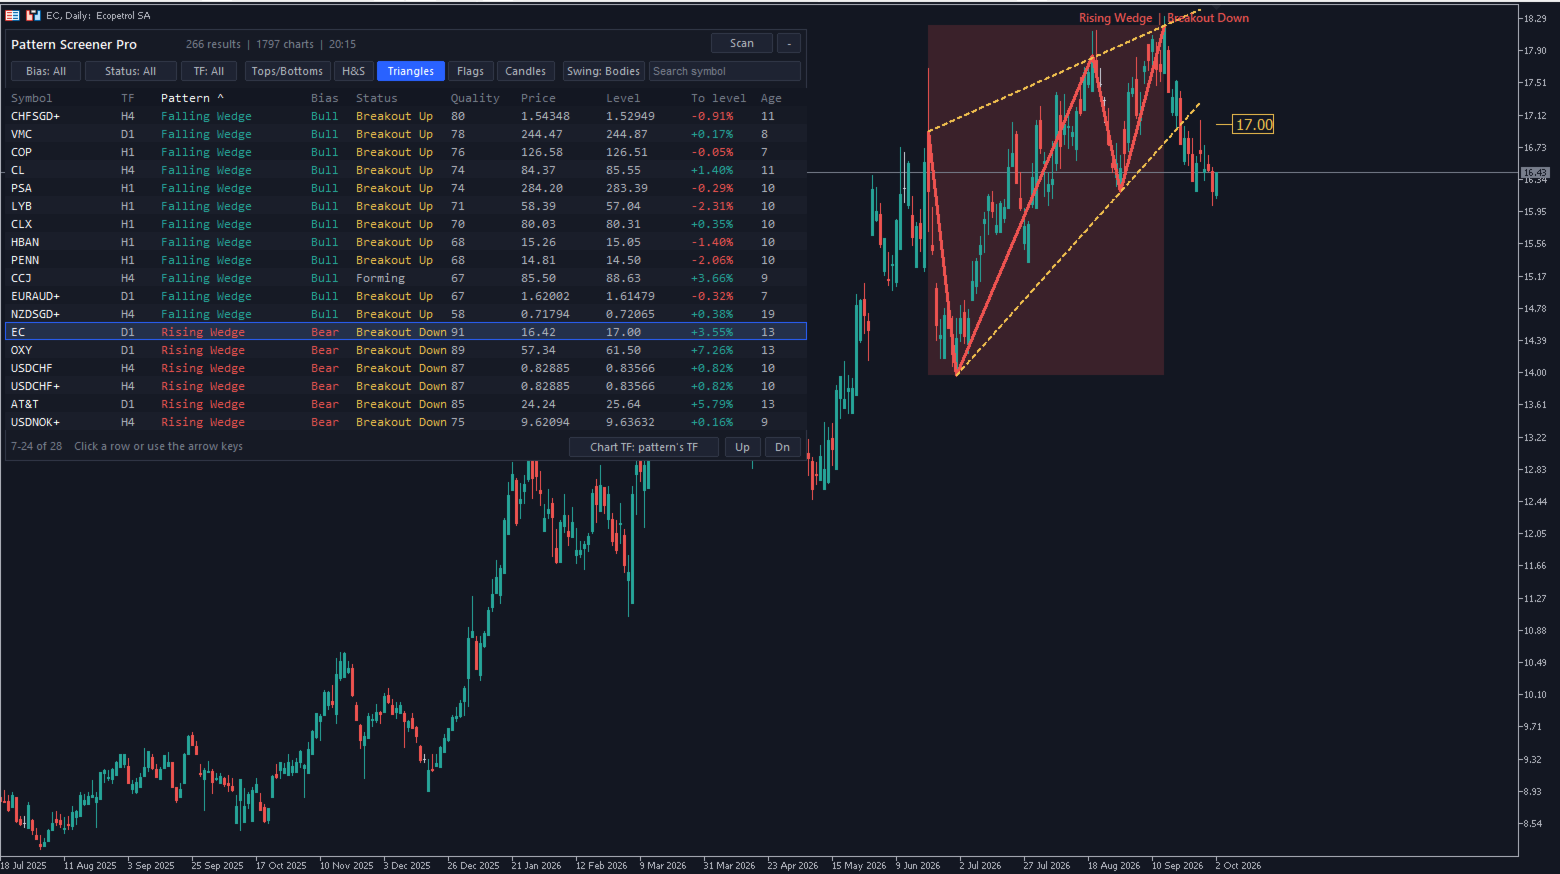
Pattern Screener Pro scans every symbol in your Market Watch on the timeframes you choose and lists the chart and candlestick patterns it finds in a panel on the chart. Click a result to switch the chart to that symbol and see the pattern drawn.
Chart patterns
- Double top and double bottom
- Triple top and triple bottom
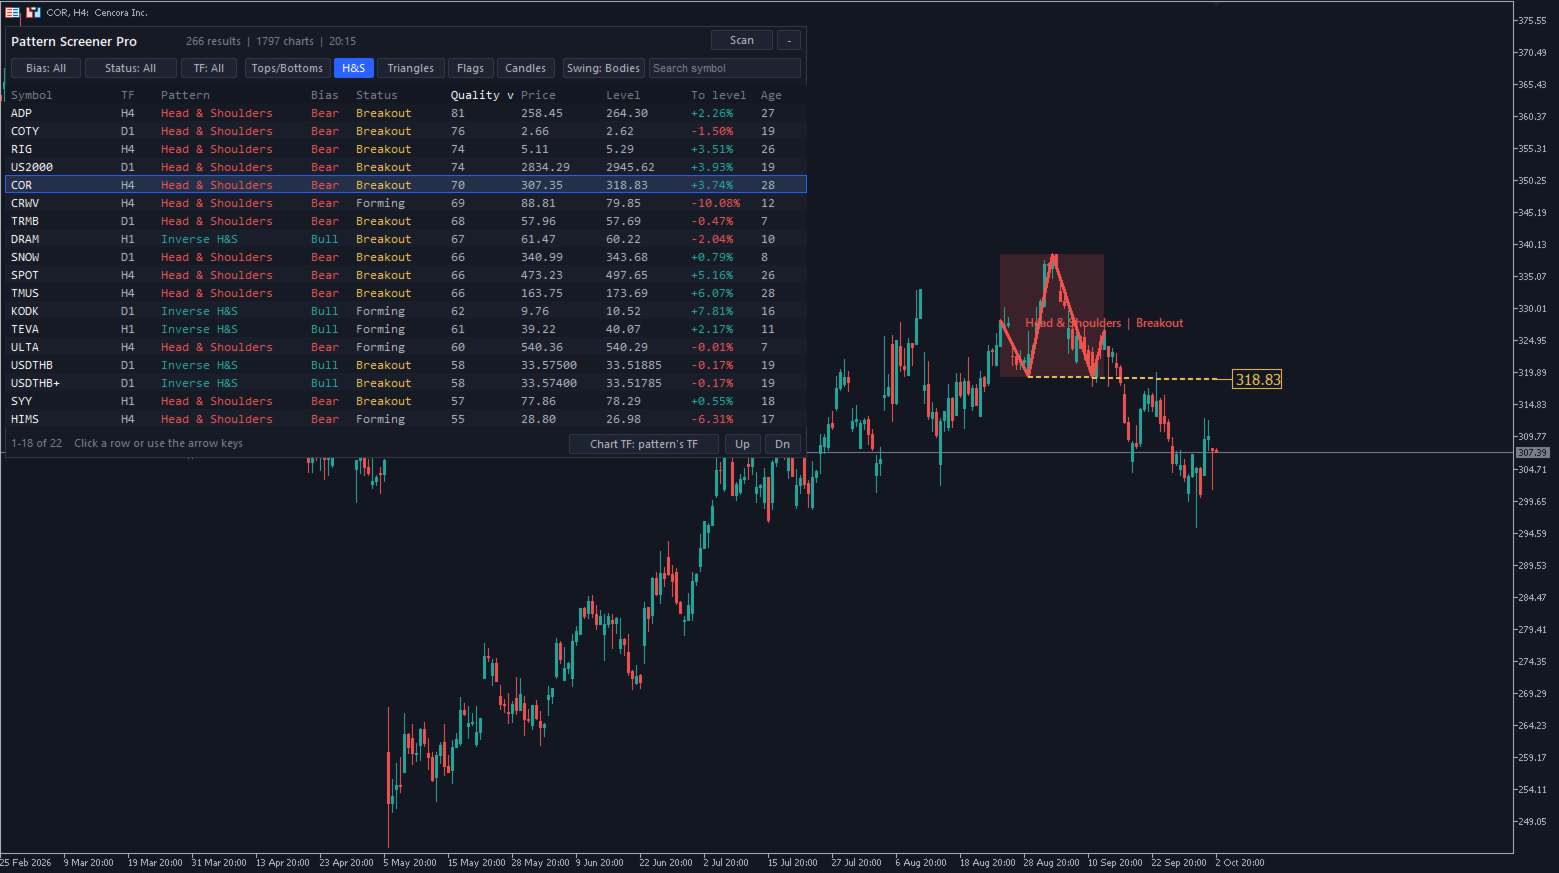
- Head and shoulders, inverse head and shoulders
- Ascending, descending and symmetrical triangles
- Rising and falling wedges
- Bull and bear flags
Candlestick patterns
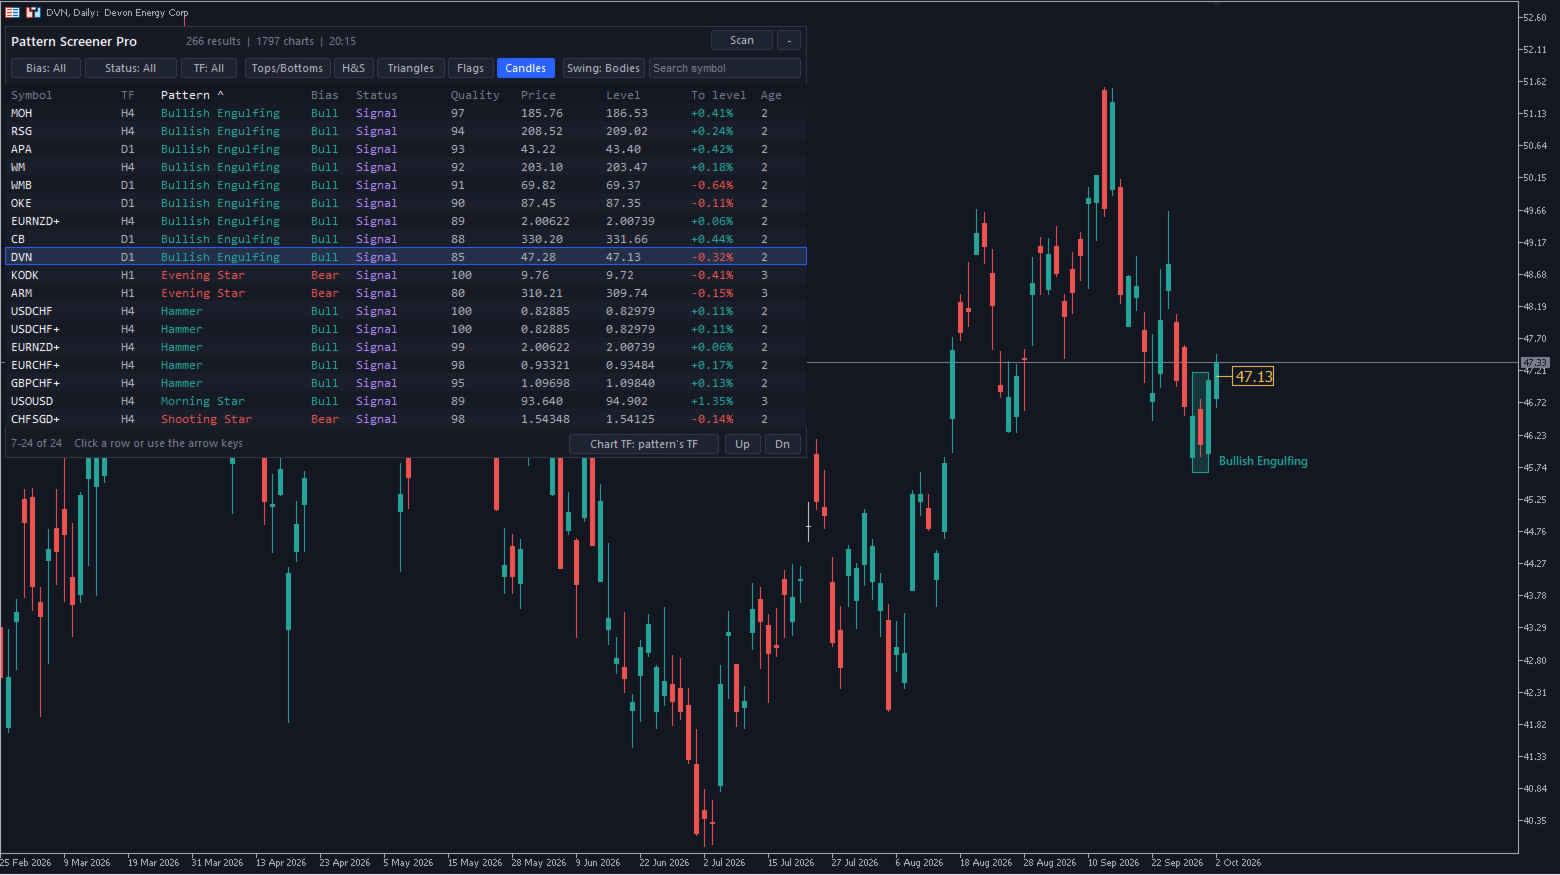
- Bullish and bearish engulfing
- Hammer and shooting star, confirmed by the next candle
- Morning star and evening star
How patterns are validated
- Swing points can be taken from candle bodies or from wicks.
- A pattern must be at least a set number of ATRs tall and a set share of the recent price range, so small fluctuations are ignored.
- Reversal patterns require a prior trend into the pattern.
- Double and triple tops and bottoms require level peaks that are well spaced in time.
- Head and shoulders requires a clear head, level and evenly spaced shoulders and a nearly flat neckline.
- Triangles and wedges require three touches, price contained between the lines, line slopes that match the pattern type and a prior trend that matches the pattern type. Breakouts against the pattern's direction are not shown.
- Flags require a steep pole followed by an orderly channel that is shorter than three times the pole.
- Candlestick patterns require a prior move into a recent high or low and minimum candle sizes.
- A pattern is removed when price has already moved past its level by more than the pattern's height, or when a candlestick signal is broken.
Each result shows its status: Forming, Breakout (the last closed bar closed through the neckline or trendline) or Signal (candlestick patterns).
The panel
- Sort by symbol, timeframe, pattern, bias, status, quality, price, level, distance to level or age.
- Filter by bias, status, timeframe, pattern group and symbol name.
- Click a result, or use the arrow keys, to switch the chart to that symbol. The panel, filters and chart zoom stay as they are.
- The chart can switch to the pattern's timeframe or keep its current timeframe.
- Chart patterns are drawn with a shaded zone, the pattern outline, the neckline or trendlines and a price tag at the breakout level. Candlestick signals are marked with a box around the candles.
- An optional dark chart theme is applied while the indicator runs. Your chart colors are restored when it is removed.
Input parameters
Scan
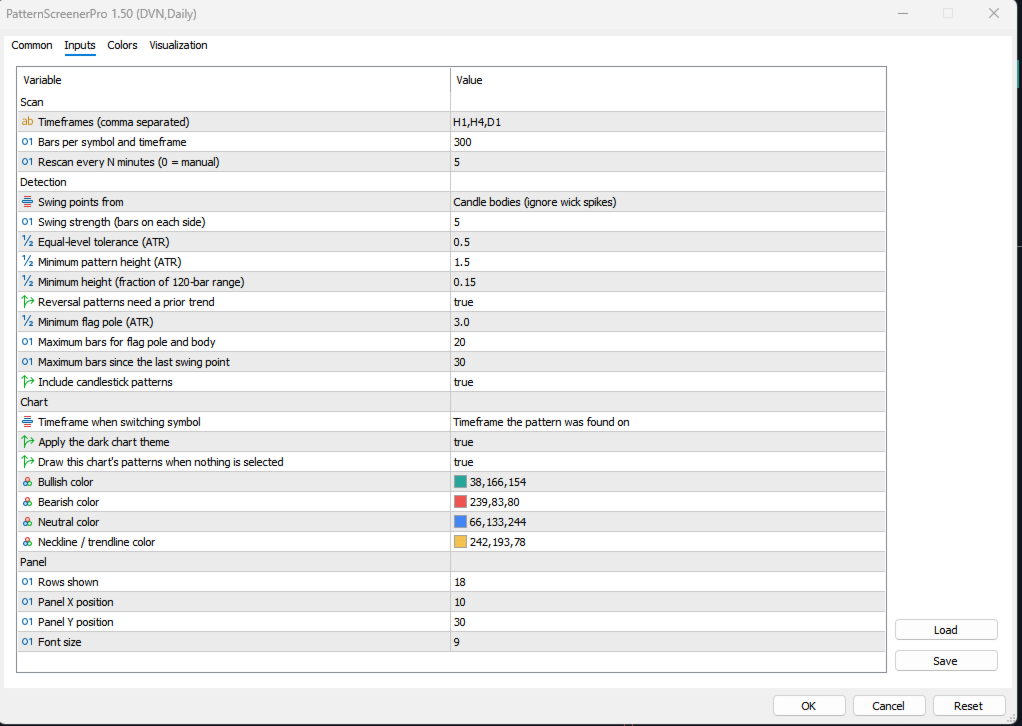
- Timeframes - timeframes to scan, separated by commas, for example H1,H4,D1.
- Bars per symbol and timeframe - history loaded for each scan (150-2000).
- Rescan every N minutes - automatic rescan interval; 0 scans only when you press Scan.
Detection
- Swing points from - candle bodies (ignores wick spikes) or wicks (classic charting).
- Swing strength - number of bars on each side of a swing high or low.
- Equal-level tolerance (ATR) - how close two levels must be to count as equal.
- Minimum pattern height (ATR) - smallest pattern size in ATR units.
- Minimum height (fraction of 120-bar range) - smallest pattern size compared with the recent price range.
- Reversal patterns need a prior trend - require a trend into reversal patterns.
- Minimum flag pole (ATR) - smallest flag pole in ATR units.
- Maximum bars for flag pole and body - longest allowed flag pole and flag.
- Maximum bars since the last swing point - how recent a pattern must be.
- Include candlestick patterns - turn candlestick patterns on or off.
Chart
- Timeframe when switching symbol - use the pattern's timeframe or keep the chart's current timeframe.
- Apply the dark chart theme - dark colors while the indicator runs.
- Draw this chart's patterns when nothing is selected - show the patterns of the current chart.
- Bullish, Bearish, Neutral and Neckline / trendline colors - drawing colors.
Panel
- Rows shown - number of result rows (5-40).
- Panel X position, Panel Y position - panel location on the chart.
- Font size - panel text size.
Notes
- The indicator finds and draws patterns for your analysis. It does not open trades or give trade recommendations.
- Symbols must be in Market Watch, and history must be available for the selected timeframes. During the first scan some symbols may show as loading while the terminal downloads history.