Ekai Volume Profile

EKAI Anchored Volume Profile Pro

Institutional-grade Fixed Range Volume Profile for MetaTrader 5 with mouse-draggable range handles, buy/sell split, POC and Value Area

Overview

EKAI Anchored Volume Profile Pro brings the visual power of TradingView's Fixed Range Volume Profile and NinjaTrader's Order Flow Volume Profile natively to MetaTrader 5. Two draggable handles define a time range on the chart, and the indicator draws a full-featured volume profile inside that range: histogram, buy/sell split by tick direction, Point of Control (POC), and Value Area (VAH/VAL).

You can move either handle at any time by clicking and dragging it. The profile recomputes automatically. If you cross one handle over the other, the indicator detects the swap and reorders them silently.

Under the hood, the indicator uses a 3-tier volume classification cascade: it prefers real broker tick flags (available on futures and stock exchanges), falls back to the Lee-Ready algorithm for Forex (using bid/ask/last quote analysis), and finally to tick volume distribution if no tick data is available. This means the same tool works on ES, NQ, CL futures, on stock CFDs, and on any Forex pair, always giving you the best classification available for that instrument.

The result is a professional-grade volume analysis tool that traders can use to identify high-volume nodes (institutional accumulation), low-volume nodes (breakout targets), and buy/sell aggressor imbalance within any custom time window — for prop firm challenge preparation, key level identification, or day-trading structure.

What Makes It Different

The MQL5 Market has plenty of volume profile indicators, but most fall into one of three categories:

  • Session profiles (Asia / London / NY) with no user control over the range
  • Fixed range (visible range or fixed number of bars) with no manual selection
  • Basic anchored VWAP-style tools that only anchor a single point

Very few indicators combine:

  1. Two mouse-draggable range handles — you select the range visually, just like TradingView Fixed Range VP
  2. Real-time buy/sell split — each histogram bar is split into buy (green) and sell (red) portions based on tick direction
  3. 3-tier volume classification — real broker flags → Lee-Ready → tick volume distribution, transparent about which method it's using
  4. Full Value Area calculation — POC, VAH, VAL computed with the standard 70% expansion algorithm from the POC
  5. Persistent state per chart — the range you set stays after MT5 restarts

If you've been jumping between TradingView (for the volume analysis) and MetaTrader (for execution), this indicator lets you keep everything in MT5.

Key Features

Two Draggable Range Handles

The core of the indicator is a range — not a single anchor point. Two vertical gold lines define the left and right boundaries of the range:

  • Click on either line → it becomes selected (MT5 native)
  • Drag horizontally → move the boundary to any bar
  • Release → the profile recomputes automatically
  • Cross one handle over the other → the indicator detects the swap and reorders both handles + rectangle silently

Between the two handles, a semi-transparent navy background (toggleable) marks the selected range clearly across the chart. This background sits behind the price bars so it never obstructs your view of the candles.

Buy/Sell Split Histogram

For each price bin inside the range, the indicator computes buy volume and sell volume separately:

  • Green portion (buy) — aggressive buying at that price level
  • Red portion (sell) — aggressive selling at that price level

The two portions are drawn side-by-side inside a single bar, so you can immediately see whether accumulation or distribution dominated at each price level. Bars grow from the left handle toward the right, with the POC (largest bar) reaching a configurable percentage of the total range width (default 65%).

Alternative style: single-color bars per dominant side (green if buy dominated, red if sell dominated).

3-Tier Volume Classification Cascade

MetaTrader 5 does not provide a single reliable way to classify a tick as buy or sell. This indicator uses a cascade to always give you the best classification available for the instrument:

Tier 1 — Real broker flags ( TICK_FLAG_BUY / TICK_FLAG_SELL )

  • Available on futures exchanges (CME: ES, NQ, CL, GC, etc.) and stock exchanges
  • The exchange itself marks each trade with the side of the aggressor
  • Most accurate classification possible

Tier 2 — Lee-Ready quote test

  • For Forex spot and CFDs, where broker flags are typically absent
  • Uses the tick's bid, ask, and last price to classify:
    • Trade above the midpoint of the spread → BUY (aggressor bought at the ask)
    • Trade below the midpoint → SELL (aggressor sold at the bid)
    • Trade exactly at the midpoint → falls to Tier 3
  • Standard academic algorithm used in institutional flow analysis

Tier 3 — Tick test

  • Ultimate fallback when no bid/ask context is available
  • Compares the current tick's price to the previous tick:
    • Price up → BUY
    • Price down → SELL
    • Same price → inherit the previous direction

Tier 4 — Bar-level distribution fallback

  • If CopyTicksRange returns no data at all (rare, some brokers with limited tick history), the indicator distributes bar tick_volume across the bar's high-low range, weighted 65/35 toward the bullish/bearish side based on close vs open

The Info Panel always shows which tier was used, so you know the reliability of the classification:

  • Real (broker flags): 45230 ticks — top confidence
  • Lee-Ready (est.): 45230 ticks — high confidence
  • Tick test (est.): 45230 ticks — reasonable confidence
  • Tick volume (bar dist.): 250 bars — approximation

Point of Control (POC) + Value Area

Standard institutional volume profile levels, computed correctly:

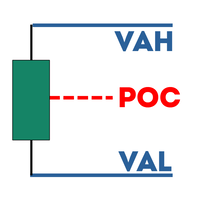
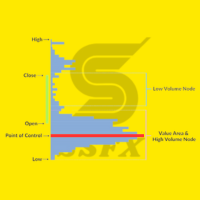
  • POC (Point of Control) — the price level with the highest volume, drawn as a solid gold line across the range
  • VAH (Value Area High) — the top of the 70% value area, drawn as a cyan dashed line
  • VAL (Value Area Low) — the bottom of the 70% value area, drawn as a cyan dashed line

The Value Area is computed with the standard expansion algorithm: start at the POC, then repeatedly add the adjacent bin (above or below) with the higher volume until the accumulated volume reaches 70% (configurable) of the total volume in the range.

These three levels are your key trading reference points inside the range. Price rejections at VAH/VAL are institutional decisions to stay within value. Breaks of VAH/VAL are structural direction moves. The POC is the fair-value magnet — price tends to return to it.

Info Panel with Range Statistics

A compact info panel in the top-left corner shows everything you need at a glance:

═══════ AVP Pro ═══════ [Reset] [Hide] ═ RANGE ═ Start: 2026.09.27 14:00 End: 2026.09.28 22:00 Bars: 100 Source: Lee-Ready (est.): 45230 ticks ═ PROFILE ═ POC: 4285.60 VAH: 4291.20 VAL: 4278.50 ═ VOLUME ═ Buy %: 52.3% Sell %: 47.7% Delta: +12.4K Total: 1.85M [POC ON] [VA ON] [HIST ON]

Buttons in the panel:

  • Reset — restores the range to the initial size (100 bars back to current, or your configured default)
  • Hide — collapses the panel (the small [x] AVP button in the corner brings it back)
  • POC ON/OFF — toggle POC line visibility instantly
  • VA ON/OFF — toggle VAH/VAL visibility instantly
  • HIST ON/OFF — toggle histogram visibility instantly

The external toggle button [x] AVP / [ ] AVP is always visible even when the panel is hidden, so you can bring the panel back with one click.

Full State Persistence

Everything is saved automatically to a per-chart file:

  • Range start and end times
  • Panel position and visibility
  • POC / VA / Histogram toggle states

Close MT5, reopen it, reattach the indicator — the range, the panel state, and all your toggles are exactly as you left them.

Use Cases

The Fixed Range Analyst

You want to analyze the volume distribution during a specific swing, session, or news event. Instead of guessing where the important levels are, you draw the range around the move: POC gives you the fair value, VAH/VAL give you the acceptance boundaries, HVN and LVN in the histogram give you support/resistance for the next move. Perfect for post-mortem analysis of key sessions.

The Order Flow Trader

You need to know who was in control during a specific price move — buyers or sellers. The buy/sell split histogram shows you at each price level whether accumulation or distribution dominated. Bars with dominant green at the lows tell you buyers absorbed the pullback. Bars with dominant red at the highs tell you sellers took liquidity from the buyers. This is institutional order flow analysis, natively in MT5.

The Prop Firm Challenge Trader

You're running an FTMO or Alpha Capital challenge and need to identify key levels for the day. Set the range on yesterday's session → get yesterday's POC, VAH, VAL. These are the reference points every institutional trader will react to at open. Combined with your entry rules, this gives you a structural edge.

The Multi-Session Comparison Trader

Open two charts of the same instrument. Set the range on the London session in one, on the NY session in the other. Compare POCs, deltas, and value areas. Where is the true institutional interest? Where did most of the volume trade? This context is invisible on price charts alone.

The Post-News Level Mapper

FOMC just released. Price is in chaos. You need to know where the initial acceptance zones formed. Set the range from 15 minutes before the news to 30 minutes after → the profile shows you the exact price band where volume concentrated after the initial shock. That band becomes support/resistance for the rest of the day.

The Multi-Range Comparative Analyst (Roadmap)

Coming in a future update: attach the indicator multiple times to the same chart with different ranges. Compare POCs across ranges. Identify naked POCs (POCs that have never been retested). Build a full institutional level map.

Requirements

  • MetaTrader 5 build 3550 or newer
  • Any broker
  • Any instrument — futures, stocks, CFDs, Forex, indices, crypto
  • No external DLLs, no third-party dependencies
  • No network access required — all computation is local
  • Tick data preferred — the indicator works best when your broker provides tick history via CopyTicksRange . If not available, it falls back to bar-based distribution.

Installation

  1. Download from the MQL5 Market
  2. Attach to any chart (works on any timeframe)
  3. Two gold vertical lines appear defining the initial range (last 100 bars by default)
  4. The volume profile is drawn inside the range
  5. Drag either line to redefine the range
  6. Use the info panel to toggle POC / VA / Histogram visibility
  7. Adjust InpBins (default 60) if you want more or less granularity
  8. Adjust InpMaxWidthPct (default 65%) if the histogram is too wide/narrow

FAQ

Q: Does this work on Forex? Yes. On Forex, most brokers don't provide the TICK_FLAG_BUY / TICK_FLAG_SELL flags, so the indicator automatically falls back to the Lee-Ready algorithm (quote test using bid/ask/last). The Info Panel will show "Lee-Ready (est.)" as the source. Classification accuracy is high (typically 75-85% match against real flags when both are available).

Q: Does this work on futures? Yes, and it works best on futures. CME instruments (ES, NQ, CL, GC, ZB) provide real TICK_FLAG_BUY/SELL flags via most brokers with exchange connectivity. The Info Panel will show "Real (broker flags)" as the source. This is the most accurate classification available in MT5.

Q: What if my broker doesn't provide tick data? The indicator gracefully falls back to bar-level distribution. It reads tick_volume for each bar in the range and distributes it across the high-low band, weighted 65/35 toward the bullish/bearish direction based on close vs open. The Info Panel will show "Tick volume (bar dist.)". This is an approximation but still gives you meaningful POC and Value Area levels.

Q: How accurate is the Lee-Ready classification? The Lee-Ready algorithm is the academic gold standard for classifying trades when you have bid/ask/last data but no explicit flags. Empirical studies show 75-90% classification accuracy vs known aggressor data. For prop trading purposes this is more than sufficient to identify buy/sell imbalance zones.

Q: How is the Value Area computed? Standard institutional method: start at the POC bin (highest volume price), then repeatedly add the adjacent bin (above or below) with the higher volume, accumulating until you capture 70% (configurable via InpValueAreaPct ) of the total volume in the range. VAH = top of the covered range, VAL = bottom.

Q: Can I have multiple ranges on the same chart? Not in v1.00. Currently each chart has one range at a time. Multi-range support is on the Fase 2 roadmap and will allow up to 3 simultaneous ranges (A/B/C) with different colors.

Q: Can I use it as an Anchored Volume Profile (fixed start, floating end)? Yes. Just place the right handle at the current bar and never move it — as new bars form, you can drag the right handle forward to include them, effectively behaving as an anchored VP with a growing right side. Or configure InpInitialRange = RANGE_SESSION to always start from the day session open.

Q: Does it slow down MT5? No. The profile is rebuilt only when you move a handle or a new bar closes, and the rebuild is throttled to a timer (default every 2 seconds), never on every tick. Memory-wise, only one range worth of tick data is held. The indicator has been tested with 500,000 ticks in a single range on an average PC without noticeable lag.

Q: How many bins should I use? Default is 60 which works well for most timeframes. Increase to 100-200 for very tight scalping precision on futures. Decrease to 30-40 for higher timeframes where you want cleaner, broader zones.

Q: What if my range crosses the weekend / market close? The indicator handles gaps naturally — bars without volume simply don't contribute. However, if you're on a Forex Sunday chart, the anchor may fall in a gap. Just drag the left handle forward to the first bar with actual volume.

Q: Does it persist between MT5 restarts? Yes. Range boundaries, panel position, panel visibility, and all toggles are saved to a per-chart file in the MT5 sandbox. Restart MT5 and everything reappears exactly as you left it.

Q: Can I customize the colors? Yes. Handle color, buy color, sell color, POC color, VAH/VAL colors, and the range background color are all configurable inputs.

Q: Does it work in the Strategy Tester? The indicator initializes correctly in the Strategy Tester but its usefulness there is limited since tick history in the Tester doesn't always provide real flag data. For meaningful volume analysis, run it on live/demo charts.

Data Source: Technical Deep Dive

For advanced users who want to understand exactly what the indicator is doing:

How volume is fetched

The indicator calls CopyTicksRange(_Symbol, ticks, COPY_TICKS_ALL, from_msc, to_msc) to retrieve all ticks between the range start and end. COPY_TICKS_ALL returns bid/ask/last/volume/flags for every tick, which is the maximum information available in MT5.

If CopyTicksRange returns 0 or fails, the indicator falls back to CopyRates and uses bar tick_volume with bar-classification heuristics.

How each tick is classified

For each returned tick, the classifier runs through the 3 tiers in order:

  1. if(ticks[i].flags & TICK_FLAG_BUY) → BUY. TICK_FLAG_BUY and TICK_FLAG_SELL are set by the broker/exchange when the tick has real aggressor data. Present on futures, stock exchanges, some crypto exchanges.

  2. If flags are absent, and the tick has valid bid/ask/last, compute the mid = (bid + ask) / 2 and threshold = half_spread * 0.3 :

    • last > mid + threshold → BUY (aggressor bought above mid)
    • last < mid - threshold → SELL (aggressor sold below mid)
    • Else → falls to tick test
  3. If still unclassified, compare the tick's price to the previous tick:

    • Price up → BUY
    • Price down → SELL
    • Same → inherit previous direction

Ultimate fallback: alternate 50/50 to avoid biasing the profile.

How volume is measured

For each tick, the classifier extracts volume with this priority:

  • ticks[i].volume_real if InpUseRealVol=true and available (fractional volume, most accurate on some exchanges)
  • Else ticks[i].volume (integer volume, standard)
  • Else 1 (contribution counter, when no volume data is present)

How the histogram is built

The price range from range-min to range-max is divided into InpBins equal-width bins. Each classified tick contributes its volume to the bin containing its price:

  • binIdx = floor((price - priceMin) / binWidth)
  • binBuyVol[binIdx] += vol if BUY
  • binSellVol[binIdx] += vol if SELL

Then binTotalVol[i] = binBuyVol[i] + binSellVol[i] for each bin.

How POC is found

Simple max scan: pocBin = argmax(binTotalVol) . This is the bin with the highest total volume. pocPrice = binPrice[pocBin] (bin center).

How Value Area is computed

Standard expansion:

target = totalVolume * InpValueAreaPct / 100.0   (default 70%)
lo = hi = pocBin
acc = binTotalVol[pocBin]

while acc < target and (lo > 0 or hi < binCount - 1):
    volLo = binTotalVol[lo - 1]  (or -1 if lo == 0)
    volHi = binTotalVol[hi + 1]  (or -1 if hi == binCount - 1)
    if volHi > volLo:
        hi += 1
        acc += binTotalVol[hi]
    else:
        lo -= 1
        acc += binTotalVol[lo]

vahPrice = binPrice[hi] + binWidth / 2
valPrice = binPrice[lo] - binWidth / 2

Performance profile

  • Rebuild cost: O(N) where N = number of ticks in range. Bounded by InpMaxTicks (default 500,000).
  • Rebuild is triggered by: handle drag release, new bar close, panel toggle affecting histogram.
  • Rebuild is throttled to OnTimer (default 2 seconds), never on every tick.
  • Memory: O(bins + ticks). Typical usage: 500K ticks × 24 bytes = 12 MB peak during rebuild, released after.

Version History

v1.00 (initial release)

  • Two mouse-draggable range handles
  • Semi-transparent range background (toggleable)
  • Buy/Sell split histogram with side-by-side coloring
  • Alternative single-color histogram (dominant-side style)
  • POC (Point of Control) line
  • VAH / VAL (Value Area High/Low) with configurable percentage (default 70%)
  • 3-tier volume classification: real broker flags → Lee-Ready → tick test
  • Bar-level fallback when no tick data available
  • Info panel with range statistics
  • POC / VA / Histogram toggles from the panel
  • External [x] AVP toggle button to hide/show the panel
  • Full state persistence per chart (range, panel, toggles)
  • Auto-swap detection when user crosses handles
  • Configurable colors, bins, value area percentage, histogram width
  • Works on any symbol, any timeframe, any account type
  • No external DLLs, no network access

EKAITRADING / TSDCCORP Built by traders, for traders.


Önerilen ürünler
The Volume Weighted ATR indicator is a helpful tool for measuring market activity. It is based on the idea of the Volume-Weighted ATR. Combining these two elements helps identify potential turning points or breakout opportunities. The indicator for the classification of the activity of the market uses the moving average and its multiples. Accordingly, where the VWATR bar is located (relative to the moving average), it is labelled as ultra-low, low, average, high, very high or ultra high. The Vo
FREE
LM Volume Profile MT5 LM Volume Profile MT5 displays the distribution of calculated volume across price levels directly on the MetaTrader 5 chart. The indicator divides the selected price range into configurable price rows and displays the volume distribution as a horizontal histogram. It also calculates the Point of Control, Value Area High, Value Area Low, average profile price, and optional VWAP reference. Four profile modes are available: - Visible Range - Fixed Range - Session - Daily
FREE
Neon Profile
Manuel Fernandez Barranco
XBK Neon Profile MT5 Developed by XBK Systems. XBK Neon Profile is an advanced technical indicator for MetaTrader 5 that combines smoothed trend analysis and a dynamic volume profile within a single chart window. The indicator is designed to provide a clear view of market structure and significant volume levels without cluttering the screen. Key Features Smoothed Trend Bands (Neon Trend Bands) Identifies the current trend direction using a custom smoothing algorithm designed to filter out market
FREE
Volume Profile Indicator – User Guide  Description: The Volume Profile Indicator is a powerful tool designed for MetaTrader 5. It visualizes market activity using volume distribution across price levels, showing: Histogram of volume at each price bin POC (Point of Control) – the price with the highest traded volume Value Area – the range covering a configurable percentage of volume (e.g. 70%) Support levels: Min, Max, and Pivot Average tick size for BUY and SELL movements  Inputs and Parameters:
FREE
Correlation Matrix Pro - Çoklu Döviz Hedge Tarayıcı Döviz çiftleri arasındaki ilişkileri gerçek zamanlı olarak anlayın! 6 döviz çifti arasındaki istatistiksel ilişkileri aynı anda görselleştirmenize yardımcı olan güçlü bir analiz aracıdır. Portföy yönetimi, risk çeşitlendirmesi ve hedge stratejileri için mükemmeldir. TEMEL ÖZELLİKLER - Logaritmik getiriler kullanan gerçek zamanlı Pearson korelasyonu - Aynı anda 6 döviz çiftini izleme - Otomatik zaman dilimi algılama - Ayarlanabilir geriye bakış
FREE
AvgVolumes
Marco Montemari
5 (1)
This indicator is based on Volumes standard indicator, calculates the average of Volumes based on the last N bars set by users, and if the value of the volume is bigger then a set % respect the average a different color will be used. The indicator is shown in a separate indicator window. This version has now a limitation in setting the % about the threshold. If you are interested to set threshold consider to buy the PRO version ( https://www.mql5.com/en/market/product/35925 ) If you want to use
FREE
Session Profiles
Basharat Umar Khan
5 (1)
Short Description Draws rolling Time-Price-Opportunity (TPO) and footprint volume profiles for the Asia, London, and New York sessions with POC/VAH/VAL levels, delta volume bias, order flow overlays, liquidity heatmaps, developing rolling lines, Naked POC (NPOC) tracking, Initial Balance breakouts, multi-session confluence zones, and automatic broker GMT-offset detection. Full Description Plots separate market-profile and volume-profile style histograms for the three major trading sessions (Asi
FREE
Axilgo PipPiper CoPilot
Theory Y Technologies Pty Ltd
5 (2)
Axilgo Pip Piper CoPilot Elevate your trading game with the Axilgo Pip Piper CoPilot, the first in our revolutionary Pip Piper Series. This all-inclusive toolset is meticulously crafted for serious traders, focusing on key areas such as Risk Management, Trade Management, Prop Firm Rule Compliance, and Advanced Account Management . With CoPilot, you’re not just investing in a tool—you’re gaining a strategic partner in the intricate world of trading. Important Notice: To ensure you receive the fu
FREE
Volume Profile FREE — Multi-Session Heatmap (POC · VAH · VAL) See where trading activity actually occurs—not just where price moves. This indicator builds a clear, color-coded Volume Profile Heatmap directly on your chart and highlights the market's most important price levels: the Point of Control (POC) and the Value Area (VAH/VAL) , where price is most likely to react.
FREE
MW Volume
Martin Bittencourt
3.8 (5)
The Martinware Volume indicator plots a colored moving average over volume bars. The coloring uses three colors and can be done in different ways choosable by the user and is applied both to the average as to the volume bars. Three types of coloring are possible: None: no coloring is done Increasing or decreasing: changes the color depending on the current value being bigger or lesser than the previous one Volume relative to average: colors vary if the current volume is bigger or lesser then
FREE
Smart FVG Stats
- Md Rashidul Hasan
5 (1)
The  Smart FVG Statistics Indicator  is a powerful MetaTrader 5 tool designed to automatically identify, track, and analyze Fair Value Gaps (FVGs) on your charts. Love it? Hate it? Let me know in a review! Feature requests and ideas for new tools are highly appreciated. :) Try "The AUDCAD Trader": https://www.mql5.com/en/market/product/151841 Key Features Advanced  Fair Value Gap  Detection Automatic Identification : Automatically scans for both bullish and bearish FVGs across specified histo
FREE
Aggression Volume Profile
Edson Cavalca Junior
4.55 (11)
This indicator plots the volume profile by Price on the chart There are 5 ways to view it: By Total Volume Traded (Premium Version); Volume Ticks(Forex) Separated by Buyers and Sellers (Premium Version); Buyers Only (Premium Version); Sellers Only (Premium Version); Business balance (Buyers - Sellers) (Premium Version); . It is possible to select how many days the profiles will be calculated.( Premium Version) On the current day it recalculates the histogram data for each new candlestick.
FREE
Haven Volume Profile
Maksim Tarutin
4.64 (14)
Haven Volume Profile, ticaret hacminin dağılımına dayalı olarak önemli fiyat seviyelerini belirlemeye yardımcı olan çok fonksiyonlu bir hacim profili analiz göstergesidir. Piyasayı daha iyi anlamak ve önemli giriş ve çıkış noktalarını belirlemek isteyen profesyonel yatırımcılar için tasarlanmıştır. Diğer Ürünler ->  BURADAN Temel Özellikler: Point of Control (POC) Hesaplama - en yüksek ticaret aktivitesinin gerçekleştiği seviye, en likit seviyeleri belirlemeye yardımcı olur Value Area (yüksek ak
FREE
Short description   Right-anchored, flicker-free Volume Profile with POC/VAH/VAL lines, tick-throttled updates, and zero measurable lag even on fast, high-volume symbols. Full description Anchored Volume Profile draws a fixed-range volume histogram from a chosen start date through to the live, forming bar — pinned to the right edge of your chart like the panels in TradingView, and built to stay smooth even on fast-moving, high-tick-volume symbols. KEY FEATURES - Fixed-range profile anchored to a
FREE
Volume profile CVD Frato
Francisco Felipe Alves Da Silva Rocha
5 (2)
Frato Volume Profile Pro v7.5 Frato Academy tarafından geliştirilmiştir. Bu gösterge, MetaTrader 5 için fiyat hacim profilini gösterir. Yapılandırılabilir bir süre boyunca fiyat seviyesine göre işlem hacminin dağılımını hesaplar ve sonuçları doğrudan ana grafikte sunar. Özellikler: Renk gradyanlı hacim profili Gösterge, fiyat aralığını seviyelere ayırır ve her seviyeye karşılık gelen bir hacim atar. Her seviyenin rengi, hacme göre sürekli bir gradyan halinde değişir: düşük hacimli seviyeler
FREE
Mirror Chart MT5
Andrej Hermann
5 (1)
The Mirror Chart MT5 is a overlay indicator specifically designed to project a second financial instrument directly onto the main chart window. This tool is invaluable for traders who rely on correlation analysis, as it visualizes the price movements of two different instruments in real time. Unlike traditional overlays, this indicator utilizes intelligent, dynamic centering and scaling logic. It continuously analyzes the visible price range in the current window for both symbols and calculates
FREE
Alpine Volume Profile See where the real volume traded — not just where price moved. Alpine Volume Profile is an MQL5 indicator that transforms raw tick or exchange volume into a clean, readable horizontal histogram directly on your chart. Instead of a single volume bar at the bottom of the screen, you get a full breakdown of which price levels attracted the most trading activity, session by session. What It Does For every day, week, or fixed block of bars you choose, Alpine Volume Profile build
FREE
RM Volume Profile, grafiginize eksiksiz bir Volume Profile ve Market Profile (TPO) cizer — her islem seansi icin bir profil — boylece gercek islemin nerede gerceklestigini ve POC'nin (Kontrol Noktasi) gunden gune nasil kaydigini gorursunuz. Her seans kendi POC'sini ve Value Area'sini (VAH/VAL) ve istege bagli bir hacim histogramini gosterir. Birden fazla onceki seansi ayni anda gostererek POC kaymasini takip edin ve piyasanin fiyati nerede kabul edip reddettigini gorun. TEMEL OZELLIKLER - Vol
FREE
Proton Candle Time MT5 OVERVIEW Proton Candle Time MT5 is an indicator for MetaTrader 5 that displays a real-time countdown timer showing the number of seconds remaining in the current candle. The indicator updates continuously as the candle develops and resets when a new candle opens. This tool is designed for traders who need precise timing information while analyzing price action. PRIMARY FUNCTION The indicator displays the active candle countdown timer directly on the chart. The timer show
FREE
JT360 DNA Mini PnL Pointer V1.04 Public Kompakt. Net. Her zaman göz önünde. JT360 DNA Mini PnL Pointer, MetaTrader 5 için geliştirilmiş hafif bir göstergedir. Mevcut grafik sembolündeki tüm açık pozisyonların toplam anlık kâr ve zararını (PnL) görüntüler. Grafik üzerinde az yer kaplayan tasarımı; R cinsinden riske dayalı PnL gösterimini, ince bir mini çubuğu ve özelleştirilebilir renk matrisini bir araya getirir. JT360’ın karakteristik turkuaz ve macenta renkleri, kâr ve zarar seviyelerinin tek
FREE
Here   our more valuable tools SMC Trend Trading   ,  Easy SMC Trading  ,  Institutional SMC Architect Volume Analysis Tools  ,  Volume flow Profile  ,  Market volume profile  , FVG with Volume  , Liquidity Heatmap Profile  ,  Volume Spread Analysis A professional spike pattern indicator built for synthetic traders who scalp and swing Crash 500/300/1000 with precision.  This indicator: Detects powerful 3-candle spike formations (Spike → Pullback → Spike) Automatically draws a clean box a
FREE
Overview Market Volume Profile Modes is a powerful MT5 volume distribution indicator that integrates multiple Volume Profile variants. Users can switch between different analysis modes through a simple menu selection. This indicator helps traders identify key price levels, support and resistance zones, and market volume distribution. Core Concepts • POC (Point of Control): The price level with the highest volume concentration, representing the market's accepted "fair value" area • VAH (Value A
FREE
HTF Candles Nika, herhangi bir üst zaman dilimindeki tam boyutlu mumları doğrudan MetaTrader 5'teki mevcut grafiğinize yerleştirir. Grafik değiştirmeden net bir çoklu zaman dilimi görünümü sağlar. Temel Ozellikler - Üst zaman dilimi mumlarını mevcut grafikte fitil içeren dolgulu dikdörtgenler olarak çizer - Standart mum ve Heiken Ashi görüntüleme modlarını destekler - Mevcut HTF mumunun kapanışına kadar gerçek zamanlı geri sayım sayacı - Yükselen ve düşen mumlar için özelleştirilebilir renkler
FREE
THV Daily VWAP MT5 – Daily Volume Weighted Average Price THV Daily VWAP MT5 is a technical indicator designed to display the Daily Volume Weighted Average Price (VWAP) directly on your MetaTrader 5 chart. Unlike traditional VWAP indicators that may only display limited session data or reset at specific trading sessions, this indicator plots a continuous VWAP line throughout the trading day, making it easy to observe how price behaves relative to the daily volume-weighted average price. The VWAP
FREE
AP Session Boxes — Asian / London / NY Range Overlay (MT5 Indicator) Clean session boxes on your chart. This lightweight indicator draws the   Asian ,   London , and   New York   time windows directly on the chart, including each box’s   high   and   low   as dashed lines. It’s perfect for quick context, breakout planning, and clean screenshots. Instant structure:   See where the market ranged during key sessions. Breakout prep:   Use the hi/lo lines as reference for pending orders or alerts fr
FREE
Here   our more valuable tools SMC Trend Trading   ,  Easy SMC Trading  ,  Institutional SMC Architect Volume Analysis Tools  ,  Volume flow Profile  ,  Market volume profile  , FVG with Volume  , Liquidity Heatmap Profile  ,  Volume Spread Analysis Automatically detects major swing points not internal noise Generates buy/sell signals at key Fibonacci levels Displays professional GUI panel with real-time analysis Marks major swings with visual indicators Trading Strategy BUY at 38.2%-61.8% Fib
FREE
Session Edge Profiler Session statistics for the Asia, London and New York sessions, drawn directly on your chart. Session Edge Profiler works out how each trading session has actually behaved on your symbol over a lookback period you choose. It draws the session ranges on the chart and shows a dashboard of statistics for each session. It is a statistical profiling tool, not a signal generator: it gives you historical context on how large, how directional and how structured each session tends to
FREE
ConsistencyGuard
Vanessa Cristina Ribeiro Dos Anjos
Sürüm 7.04 Day trading disiplini ve hesap korumasını güçlendirmeye odaklanan büyük bir güncelleme. • 0 ile 60 dakika arasında yapılandırılabilen Post-Session Review modu. • İzin verilen işlem sayısı tamamlandıktan sonra trader, grafiklerini incelemek, ekran görüntüsü almak ve trading günlüğünü doldurmak için MetaTrader 5'i açık tutabilir. • Günlük işlem limitine ulaşıldıktan sonra yeni bir işlem açma girişimi Emergency Close korumasını etkinleştirir. • Emergency Close, işlem seansını kilitlemede
FREE
VP hidden
Emr Aljnaby
4.33 (12)
The indicator works to convert normal volume into levels and determine financial liquidity control points. It is very similar in function to Fixed Volume Profile. But it is considered more accurate and easier to use than the one found on Trading View because it calculates the full trading volumes in each candle and in all the brokers present in MetaTrade, unlike what is found in Trading View, as it only measures the broker’s displayed prices. To follow us on social media platforms: telegram
FREE
AD Pro
Ola Marten Hamberg
A/D Pro is a modern version of the classic Accumulation/Distribution indicator. It keeps the standard MetaTrader 5 A/D calculation and adds new display modes, automatic divergence detection, alerts and a live status panel, so you can see buying and selling pressure at a glance. The A/D indicator measures where each bar closes within its range and weights it by volume. A rising line shows accumulation (buying pressure), a falling line shows distribution (selling pressure). Divergences between A
FREE
Bu ürünün alıcıları ayrıca şunları da satın alıyor
Trend Sniper X
Sarvarbek Abduvoxobov
4.87 (46)
Trend Sniper X , tüccarların trend yönünü ve olası dönüş noktalarını netlik ve hassasiyetle belirlemelerine yardımcı olan MetaTrader 5 için çoklu zaman dilimli bir trend takip göstergesidir. MT4 için: https://www.mql5.com/en/market/product/193245 Fiyat Bilgisi: Mevcut fiyat tanıtım amaçlıdır ve gelecek güncellemeler ile yeni özellikler yayınlandıkça değişebilir. Bonus Fırsatı: Bu indikatör için ÜCRETSİZ Oto-Trade Assistant EA'yı almak için lütfen satın aldıktan sonra yazara mesaj gönderin. Code
Şehre yeni bir Kral geldi - Gösterge + Emir Yönetimi göstergeleri (TP1 + TP2 + TP3) + Opsiyonel Telegram Sinyal Gönderici DAHİL (ÜCRETSİZ) (TAM TRADING ve SİNYAL SİSTEMİ) Altın için en iyi EA’mız: Gold Slayer Bu gösterge; gelişmiş bir strateji, özelleştirilebilir emir yönetimine sahip bir trading sistemi ve envelope uzantılarını birleştiren bir mean reversion sistemi içerir. Ayrıca RSI gibi birçok akıllı onay filtresiyle desteklenerek yüksek olasılıklı dönüş girişlerini AL ve SAT sinyalleriyle y
Smart Trend Trading System — MetaTrader 5 Satın aldıktan sonra Smart Universal Expert Advisor'ı ÜCRETSİZ edinmek ve beraberinde çevrimiçi kurs, PDF kılavuzu ve özel gruba erişim almak için MQL5 üzerinden bana mesaj gönderin. STTS; trend yönünü, giriş ve çıkış sinyallerini, dönüş bölgelerini ve önemli fiyat seviyelerini doğrudan grafiğinizde bir araya getirir. Sistemi manuel işlemler için kullanabilir veya ayrı bir uyumlu EA’yı bağlayarak seçtiğiniz ayarlarla otomatik işlem gerçekleştirebilirsini
Entry Points Pro, emri vermeden önce nereden gireceğinizi, stopu nereye koyacağınızı ve hangi lotla işlem yapacağınızı gösterir. FİYAT Şu anda 199 USD: bu fiyattan 8 kopya, sonra 249 USD. Nihai fiyat 349 USD. Paramı piyasalarda işlem yaparak kazanıyorum ve bunu gösteriyorum, bu yüzden bu indikatörü herkese satmak zorunda değilim. Bu, kendi kafasıyla düşünen traderlar için bir araç, sihirli bir düğme değil. Kırılım yoksa işlem de yok. Gri ok, iptal edilmiş bir sinyaldir: fiyat sinyal mumunu kırm
İşlem avantajınızı görüş alanınıza alın! M5 Sniper , MeanFX tarafından geliştirilen yeni bir indikatördür. Hassas işlem sinyallerini adaptif TP/SL seviyeleriyle birleştirir — bunun sonucunda mümkün olan en iyi istatistiksel işlemleri oluşturur! Fiyat her 5 satın alımda bir artar, bir sonraki fiyat 69$ olacaktır. Satın aldıktan sonra ipuçları/rehber ve bonus EA almak için bana mesaj gönderin. Onu öne çıkaran nedir? Kanıtlanmış istatistiksel performans Gold XAUUSD üzerinde ( neredeyse her varlıkta
Ultra Indicator
Ihor Otkydach
5 (1)
ULTRA, “hepsi bir arada” prensibiyle çalışan bir teknik göstergedir; piyasayı bağımsız olarak analiz eder, işlem sinyalleri üretir, stop-loss emirlerinin verileceği seviyeleri gösterir ve kârı garantilemek ya da zararı en aza indirmek için işlemlerin ne zaman kapatılması gerektiğini önerir. Başka bir deyişle, piyasayı nasıl analiz edeceğinizi bilmeseniz, seviyeleri (stop-loss'unuzu nereye koyacağınızı) belirleyemeseniz ya da para yönetimi konusunda zorluk yaşasanız da fark etmez. ULTRA tüm bunla
Gann Made Easy , bay teorisini kullanarak ticaretin en iyi ilkelerine dayanan, profesyonel ve kullanımı kolay bir Forex ticaret sistemidir. WD Gann. Gösterge, Zararı Durdur ve Kâr Al Seviyeleri dahil olmak üzere doğru SATIN AL ve SAT sinyalleri sağlar. PUSH bildirimlerini kullanarak hareket halindeyken bile işlem yapabilirsiniz. Satın alma işleminden sonra, alım satım talimatlarını ve harika ek göstergeleri ücretsiz olarak almak için lütfen benimle iletişime geçin! Muhtemelen Gann ticaret yöntem
Zoryk Gold
Reda El Koutbane
4.79 (19)
ZORYK — MetaTrader 5 İçin Gelişmiş XAUUSD Sinyal Sistemi Bu hissi biliyorsunuz. Altını analiz etmek için uzun zaman harcarsınız. Doğru giriş noktasını beklersiniz. Sonunda işlemi açarsınız ve fiyat hemen aleyhinize hareket etmeye başlar. İşlemi çok erken kapatırsınız, Stop Loss seviyesini değiştirirsiniz veya birkaç saniye tereddüt edersiniz. Daha sonra piyasa, başlangıçta beklediğiniz hedefe tam olarak ulaşır; ancak siz artık işlemin içinde değilsinizdir. Sorun her zaman yön değildi. Asıl sorun
SMC Intraday Formula
VividMind Digital Solutions
5 (26)
Önce dürüst olalım. Hiçbir gösterge tek başına sizi kârlı yapmaz. Eğer biri size aksini söylüyorsa, size bir hayal satıyordur. Mükemmel al/sat okları gösteren her gösterge, kusursuzmuş gibi görünecek şekilde yapılabilir — sadece geçmişin doğru bir bölümünü yakınlaştırıp kazanan işlemleri ekran görüntüsü almanız yeterlidir. Biz bunu yapmıyoruz.  SMC Intraday Formula bir araçtır. Piyasa yapısını sizin için okur, en yüksek olasılıklı fiyat bölgelerini belirler ve şu anda akıllı paranın izinin nası
SuperScalp Pro
Van Minh Nguyen
4.54 (37)
SuperScalp Pro - Professional Multi-Layer Confluence Scalping System SuperScalp Pro, klasik Supertrend sistemini birden fazla akıllı doğrulama filtresiyle geliştiren ileri düzey bir scalping göstergesidir. Yanlış sinyalleri önemli ölçüde azaltırken başarı olasılığı daha yüksek Buy/Sell işlem fırsatlarını belirlemenize yardımcı olur. Buy ve Sell okları doğrudan grafik üzerinde net bir şekilde görüntülenir. ATR tabanlı Stop Loss ve Take Profit seviyeleri de gerçek zamanlı olarak otomatik hesaplanı
GoldenX Entry MT5
VividMind Digital Solutions
5 (17)
GoldenX Entry, adaptif Smart Entry Trend algoritmasına, sinyal skorlaması sistemine, piyasa rejimi algılayıcısına ve volatilite filtresine sahip bir MT5 indikatörüdür. Her sinyal; hesaplanmış bir giriş seviyesi, üç adet Take-Profit seviyesi (TP1, TP2, TP3) ve bir Stop-Loss seviyesi içerir. Farklı piyasa koşullarına uyum sağlamak için tasarlanmış çok katmanlı analitik yapı üzerine kuruludur ve yerleşik optimizasyon aracı ile istatistik takip sistemini birleştirir. Risk-ödül (RR) metrikleri ve geç
Gold Trend Coach MT5
Cristhian Alexander Gaibor Cuasquer
4.27 (11)
MetaTrader 5 için altında (XAUUSD) repaint yapmayan al-sat sinyalleri. Her sinyal bir stop loss ve üç take profit ile gelir. BOS ve CHoCH içeren Smart Money Concepts filtresi sayesinde yapıya karşı değil, yapıyla birlikte işlem açarsın. Paneldeki canlı Mentor, girişten TP3'e kadar her adımda sana yol gösterir. Alarmlar doğrudan telefonuna ve kendi Telegram kanalına gelir. İşte Gold Trend Coach. Artık asla yalnız işlem yapma. Satın alımla birlikte ÜCRETSİZ ALICI KİTİ: 1. Telegram Alert Bridge: s
Boba Analysis Suite
Trade Ready Solutions LLC
5 (2)
Boba Analysis Suite Boba Analysis Suite, MetaTrader 5 için geliştirilmiş bir analiz göstergesidir. Piyasa yapısını, önemli fiyat bölgelerini ve genel piyasa bağlamını tek bir grafik görünümünde bir araya getirir. Trader ve trading eğitmeni olarak edinilen uygulamalı deneyimden yola çıkarak geliştirilmiştir. Piyasanın yönünü değerlendirme, önemli seviyeleri belirleme ve birden fazla zaman dilimini birlikte inceleme gibi adımlardan oluşan sistematik bir analiz sürecini destekler. Piyasa Bağlamını
FX Power MT5 NG
Daniel Stein
5 (33)
FX Power: Daha Akıllı Ticaret Kararları için Para Birimlerinin Gücünü Analiz Edin Genel Bakış FX Power , her piyasa koşulunda başlıca para birimlerinin ve altının gerçek gücünü anlamak için vazgeçilmez bir araçtır. Güçlü para birimlerini alıp zayıf olanları satarak, FX Power ticaret kararlarınızı basitleştirir ve yüksek olasılıklı fırsatları ortaya çıkarır. İster trendlere sadık kalın ister Delta'nın aşırı değerlerini kullanarak tersine dönüşleri öngörün, bu araç ticaret tarzınıza mükemmel bir
Azimuth Pro
Ottaviano De Cicco
5 (7)
Azimuth Pro V2: Synthetic Fractal Structure and Confirmed Entries for MT5 Overview Azimuth Pro is a multi-level swing structure indicator by Merkava Labs . Four nested swing layers, swing-anchored VWAP, ABC pattern detection, three-timeframe structural filtering, and closed-bar confirmed entries — one chart, one workflow from micro-swings to macro-cycles. This is not a blind signal product. It is a structure-first workflow for traders who care about location, context, and timing. 1. What Change
FiboSniper Pro
Van Minh Nguyen
5 (4)
FiboSniper Pro – Multi-Filter Fibonacci System with Auto SL/TP and Control Panel FiboSniper Pro, seçilmiş Buy ve Sell sinyalleri üretmek için dinamik Fibonacci Envelopes ile birden fazla doğrulama filtresini birleştiren teknik bir göstergedir. Fibonacci seviyeleri Moving Average ve ATR temel alınarak hesaplanır ve ardından ADX, EMA, RSI, ATR, Volume, Time ve Candle yapısı ile filtrelenir. Gösterge, ATR tabanlı otomatik Stop Loss ve Take Profit seviyelerini doğrudan grafik üzerinde görüntüler ve
Atomic Analyst MT5
Issam Kassas
4.51 (65)
Atomic Analyst — MetaTrader 5 Satın aldıktan sonra Smart Universal Expert Advisor'ı ÜCRETSİZ edinmek ve beraberinde çevrimiçi kurs, PDF kılavuzu ve özel gruba erişim almak için MQL5 üzerinden bana mesaj gönderin. Atomic Analyst; fiyat hareketini, trend yönünü, giriş ve çıkış sinyallerini, Stop Loss ve birden fazla Take Profit seviyesini doğrudan grafiğinizde bir araya getirir. SİNYALİ GÖRÜN. İŞLEM KOŞULLARINI ANLAYIN. Atomic Analyst, analizini anlaşılır görsel bilgiler halinde sunar: • Olası gir
Gold Entry Sniper
Tahir Mehmood
5 (23)
Gold Entry Sniper – Altın Scalping & Swing Trading için Profesyonel Çoklu Zaman Çerçeveli ATR Paneli Gold Entry Sniper , XAUUSD ve diğer enstrümanlar için doğru al/sat sinyalleri veren, ATR Trailing Stop mantığı ve çoklu zaman çerçevesi analizi ile geliştirilmiş gelişmiş bir MetaTrader 5 göstergesidir. Temel Özellikler ve Avantajlar Çoklu Zaman Çerçevesi Analizi – M1, M5, M15 trendlerini tek panelde gösterir. ATR Tabanlı Trailing Stop – Volatiliteye göre dinamik olarak ayarlanır. Profesyonel Gra
M1 Sniper MT5
Oleg Rodin
5 (7)
M1 SNIPER   kullanımı kolay bir işlem göstergesi sistemidir. M1 zaman dilimi için tasarlanmış bir ok göstergesidir. Gösterge, M1 zaman diliminde scalping için bağımsız bir sistem olarak kullanılabilir ve mevcut işlem sisteminizin bir parçası olarak kullanılabilir. Bu işlem sistemi özellikle M1'de işlem yapmak için tasarlanmış olsa da, diğer zaman dilimleriyle de kullanılabilir. Başlangıçta bu yöntemi XAUUSD ve BTCUSD ticareti için tasarladım. Ancak bu yöntemi diğer piyasalarda işlem yaparken de
Sqn Max Indicator Sqn Max is an exclusive indicator to trade the market with high effectiveness. The indicator is based on price action, volatility and trend. This indicator is as simple as possible but not too simple. The indicator can generate alerts to ease the trading process. You don't have to stay all day in front of your screen. The indicator can be used with any class of assets and with any time frame. It is possible to achieve better results trading our list of selected assets. We achi
Auto Optimized SpeedAngle , sürekli İleriye Dönük Optimizasyon (Walk-Forward Optimization, WFO) yoluyla eğri uydurmayı (curve-fitting) ortadan kaldıran kurumsal düzeyde bir momentum vektörleme sistemidir. Piyasa rejimleri değiştiğinde etkinliğini yitiren statik girdilere güvenmek yerine, gösterge, örneklem dışı (Out-of-Sample, OOS) doğrulama kullanarak parametrelerini dinamik olarak yeniden kalibre eder ve böylece gösterilen sinyallerin geçmişteki rastgele anomalileri değil, gerçek bir istatisti
Apex Patterns PRO İndikatörü Satın Alın - Üzerine Kurulu Expert Advisor'a ÜCRETSİZ Sahip Olun. Kendini Optimize Eden Grafik Formasyonu ve Kırılım Zekası Geleneksel formasyon tarayıcıları sabit girdilere dayanır ve piyasa volatilitesi ile yapıları değiştiğinde genellikle düşük performans gösterir. Apex Patterns PRO, yapısal grafik formasyon tanımayı, momentum filtrelemeyi ve istatistiksel kendi kendini optimizasyonu tek bir analitik çerçevede birleştirerek değişen piyasa koşullarına uyum sağlama
Adaptive Price Action Engine Göstergeyi al, EA'sı (Uzman Danışman) bedava gelsin Kendi Kendini Optimize Eden Multi-Timeframe Trend ve Mum Formasyonu Analizi Piyasalar sürekli değişir ve her Price Action formasyonu her piyasa koşulunda aynı değere sahip değildir. Adaptive Price Action Engine , değişen piyasa koşullarına uyum sağlamak amacıyla trend yapısını, Multi-Timeframe analizini, mum formasyonlarını ve istatistiksel optimizasyonu tek bir analiz sistemi içerisinde birleştirir. İki Adaptif Mod
Sonraki Güncelleme — Sürüm 2.52 Çok Yakında! [YENİ] Piyasa Analizinizi ve İşlem Sürecinizi Geliştirmek İçin Tasarlanmış 4 Büyük Yeni Özelliğe Hazır Olun İşlem ihtiyaçlarınızı karşılamak üzere tasarlanmış 4 yeni özellikle piyasa analizini bir üst seviyeye taşıyoruz. İşte yeni özellikler: 1. TRADE OVERVIEW DASHBOARD 2. CONFLUENCE AT ZONE 3. STRONG & WEAK HIGH/LOW 4. OTE 1. TRADE OVERVIEW DASHBOARD Piyasanın genel görünümünü daha kolay anlamanıza yardımcı olan, işlem kararlarınızı desteklemek için
Divergence Bomber
Ihor Otkydach
4.89 (94)
Bu göstergeyi satın alan herkese aşağıdaki ekstra içerikler ücretsiz olarak sunulmaktadır: Her işlemi otomatik olarak yöneten, Stop Loss ve Take Profit seviyelerini ayarlayan ve işlemleri strateji kurallarına göre kapatan özel yardımcı araç: "Bomber Utility" Göstergenin farklı varlıklar üzerinde kullanılmasına yönelik ayar dosyaları (set dosyaları) Bomber Utility için 3 farklı modda kullanım sunan ayar dosyaları: "Minimum Risk", "Dengeli Risk" ve "Bekle-Gör Stratejisi" Bu ticaret stratejisini
Power Candles MT5
Daniel Stein
4.58 (12)
Power Candles V3 - Kendi Kendini Optimize Eden Güç Göstergesi Power Candles V3, döviz ve enstrüman gücünü, eklendiği her grafikte eyleme geçirilebilir bir ticaret planına dönüştürür. Sadece mumları renklendirmek yerine, arka planda canlı bir otomatik optimizasyon çalıştırır ve önünüzdeki sembol için en iyi Stop Loss, Take Profit ve sinyal eşiğini size sunar. Tek bir tıklama ile canlı ticarete uyarlanır - giriş, Stop Loss ve Take Profit ışınları grafikte tam fiyatlarla görünür ve uyarılar yön bil
Currency Strength Wizard , başarılı ticaret için size hepsi bir arada çözüm sağlayan çok güçlü bir göstergedir. Gösterge, birden çok zaman dilimindeki tüm para birimlerinin verilerini kullanarak şu veya bu forex çiftinin gücünü hesaplar. Bu veriler, şu veya bu para biriminin gücünü görmek için kullanabileceğiniz, kullanımı kolay para birimi endeksi ve para birimi güç hatları biçiminde temsil edilir. İhtiyacınız olan tek şey, işlem yapmak istediğiniz tabloya göstergeyi eklemektir ve gösterge size
Tokyo mt5 Indicator
Vasiliy Strukov
5 (15)
Tokyo Indicator; trend yönü, potansiyel işlem sinyalleri ve piyasa koşulları hakkında net ve görsel bir genel bakış sunar. Renk kodlu ve kademeli trend çizgisi, yükseliş evrelerini (mavi) düşüş evrelerinden (macenta) ayırt eder. Trend değiştiğinde, buna karşılık gelen yön okları potansiyel alım ve satım fırsatlarını vurgular. Entegre bir panel; mevcut sinyali, piyasa eğilimini, momentumu, volatiliteyi ve sinyal kalitesini tek bir kullanışlı görünümde bir araya getirir. Bu sayede yatırımcılar, fa
Naked Forex Tweezer Pro Indicator Tweezer Pro Indicator is a pattern recognition indicator for Forex, Stocks, Indices, Futures, Commodities and Cryptos. The standard Tweezer is a two bar pattern. Our enhanced version is a multi-bar pattern. We filter the patterns for you so that you only get the     best and most effective patterns   and ignore the noise. The Tweezer pattern is a simple and effective pattern to trade. The strategy that comes with the Tweezer is based on price action. The Twe
Unix Scalper
Issam Kassas
4 (4)
Unix Scalper — MetaTrader 5 Satın aldıktan sonra Smart Universal Expert Advisor'ı ÜCRETSİZ edinmek ve beraberinde çevrimiçi kurs, PDF kılavuzu ve özel gruba erişim almak için MQL5 üzerinden bana mesaj gönderin. İşlem fırsatını belirleyin. Planı görün. Nasıl işlem yapacağınıza karar verin. UNIX Scalper; piyasa analizini, BUY/SELL/WAIT kararlarını ve Entry, Stop Loss, TP1 ve TP2 seviyelerini düzenli bir panelde bir araya getirir. SİNYALİ VE PLANI GÖRÜN • Net kararlar: BUY, SELL veya WAIT. • Belir
Yazarın diğer ürünleri
VWAP Pro Anchored VWAP
Ernestq Alonso Leiva Araya
VWAP Pro - Anchored VWAP with Standard Deviation Bands Professional Anchored VWAP indicator with 3 configurable standard deviation bands. Auto-detects real vs tick volume for universal compatibility (Forex, Futures, Stocks, Indices, Crypto). 5 anchor periods: Daily, Weekly, Monthly, Quarterly, Yearly. Full Product Description Overview VWAP Pro is a professional-grade Anchored Volume Weighted Average Price indicator designed for traders who demand institutional-quality tools with full customizati
ScalperPro LX
Ernestq Alonso Leiva Araya
EKAI ScalperPro LX Dual-engine scalping Expert Advisor for MetaTrader 5 Evening Scalper mean-reversion on forex cross pairs plus Index Momentum trend-following on CFD indices — one EA, two strategies, auto-selected by instrument. Version 7.10 · EKAITRADING / TSDCCORP Market depth. Engineering discipline. OVERVIEW EKAI ScalperPro LX is a dual-engine automated trading system for MetaTrader 5 that combines two independent, extensively validated strategies in a single Expert Advisor and auto-selects
RR Calculator Pro
Ernestq Alonso Leiva Araya
RR Calculator Pro - Interactive Risk / Reward Trade Planner Interactive Risk/Reward planner with draggable Entry/SL/TP lines, auto-adjusting R:R ratio, colored zones behind price bars, on-line price labels, and a professional draggable panel with live in-panel settings. Full Product Description Overview RR Calculator Pro is a professional trade-planning tool for MetaTrader 5 that turns your chart into an interactive Risk/Reward workbench. Instead of doing mental math or opening a separate calcul
Periods BB Pro - Multi-Timeframe Trend Bias Scanner Multi-timeframe trend bias scanner combining EMA trend, RSI momentum, and price strength into a composite 0-100 score per timeframe. Ranks up to 9 timeframes with 5-tier classification, consensus column, and a professional draggable panel. Full Product Description Overview Periods BB Pro is a professional multi-timeframe trend bias scanner that answers the single most important question a trader can ask before placing an order: "Which direction
EKAI Prop Guardian Pro The complete prop firm survival dashboard for MetaTrader 5 (Utility Expert Advisor — monitoring only, does NOT execute trades) Overview EKAI Prop Guardian Pro is the only MetaTrader 5 utility that combines three critical prop-firm survival engines in a single draggable, resizable, scrollable dashboard: a Rule Compliance Engine for 7 preset firms, a Behavior Engine that flags revenge trading and overtrading in real time, and a MAE/MFE Live Dashboard that measures the execut
EKAI Trade Copier Pro Institutional-grade local trade copier for MetaTrader 5 with News-Aware Guard, Prop Firm Rules Sync, Trade Quality Score, Volatility-Adaptive Lot Sizing, SL Enforcer, and Panic Mode. Zero DLL. Zero network. One EA, two modes. Overview EKAI Trade Copier Pro replicates trades in real time from one MetaTrader 5 account (sender) to any number of MetaTrader 5 accounts (receivers) on the same machine, with institutional-grade safety features found nowhere else in the MQL5 Market.
Filtrele:
Değerlendirme yok
Değerlendirmeye yanıt