SMC Smart
- Göstergeler
-
Lam Tran
 Thanks for your interest in "Marsu Signal”
 - Sürüm: 1.2
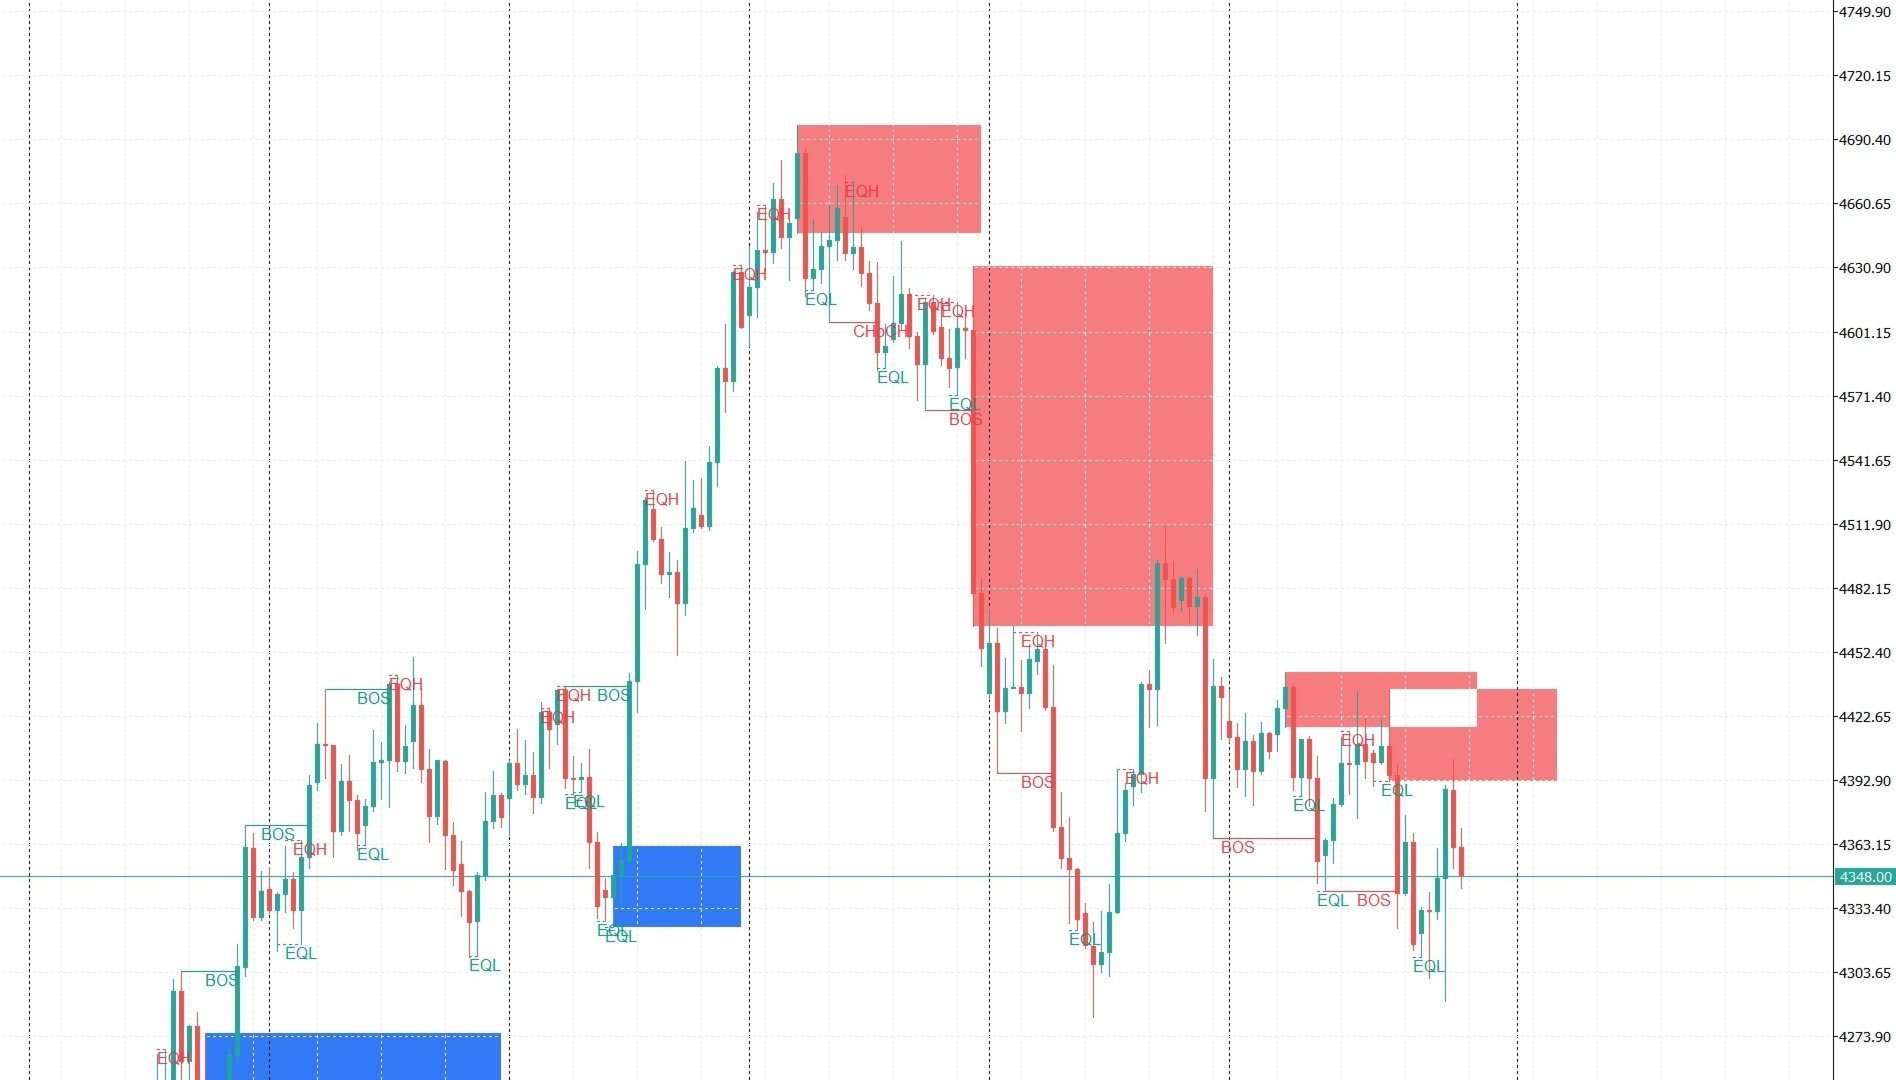
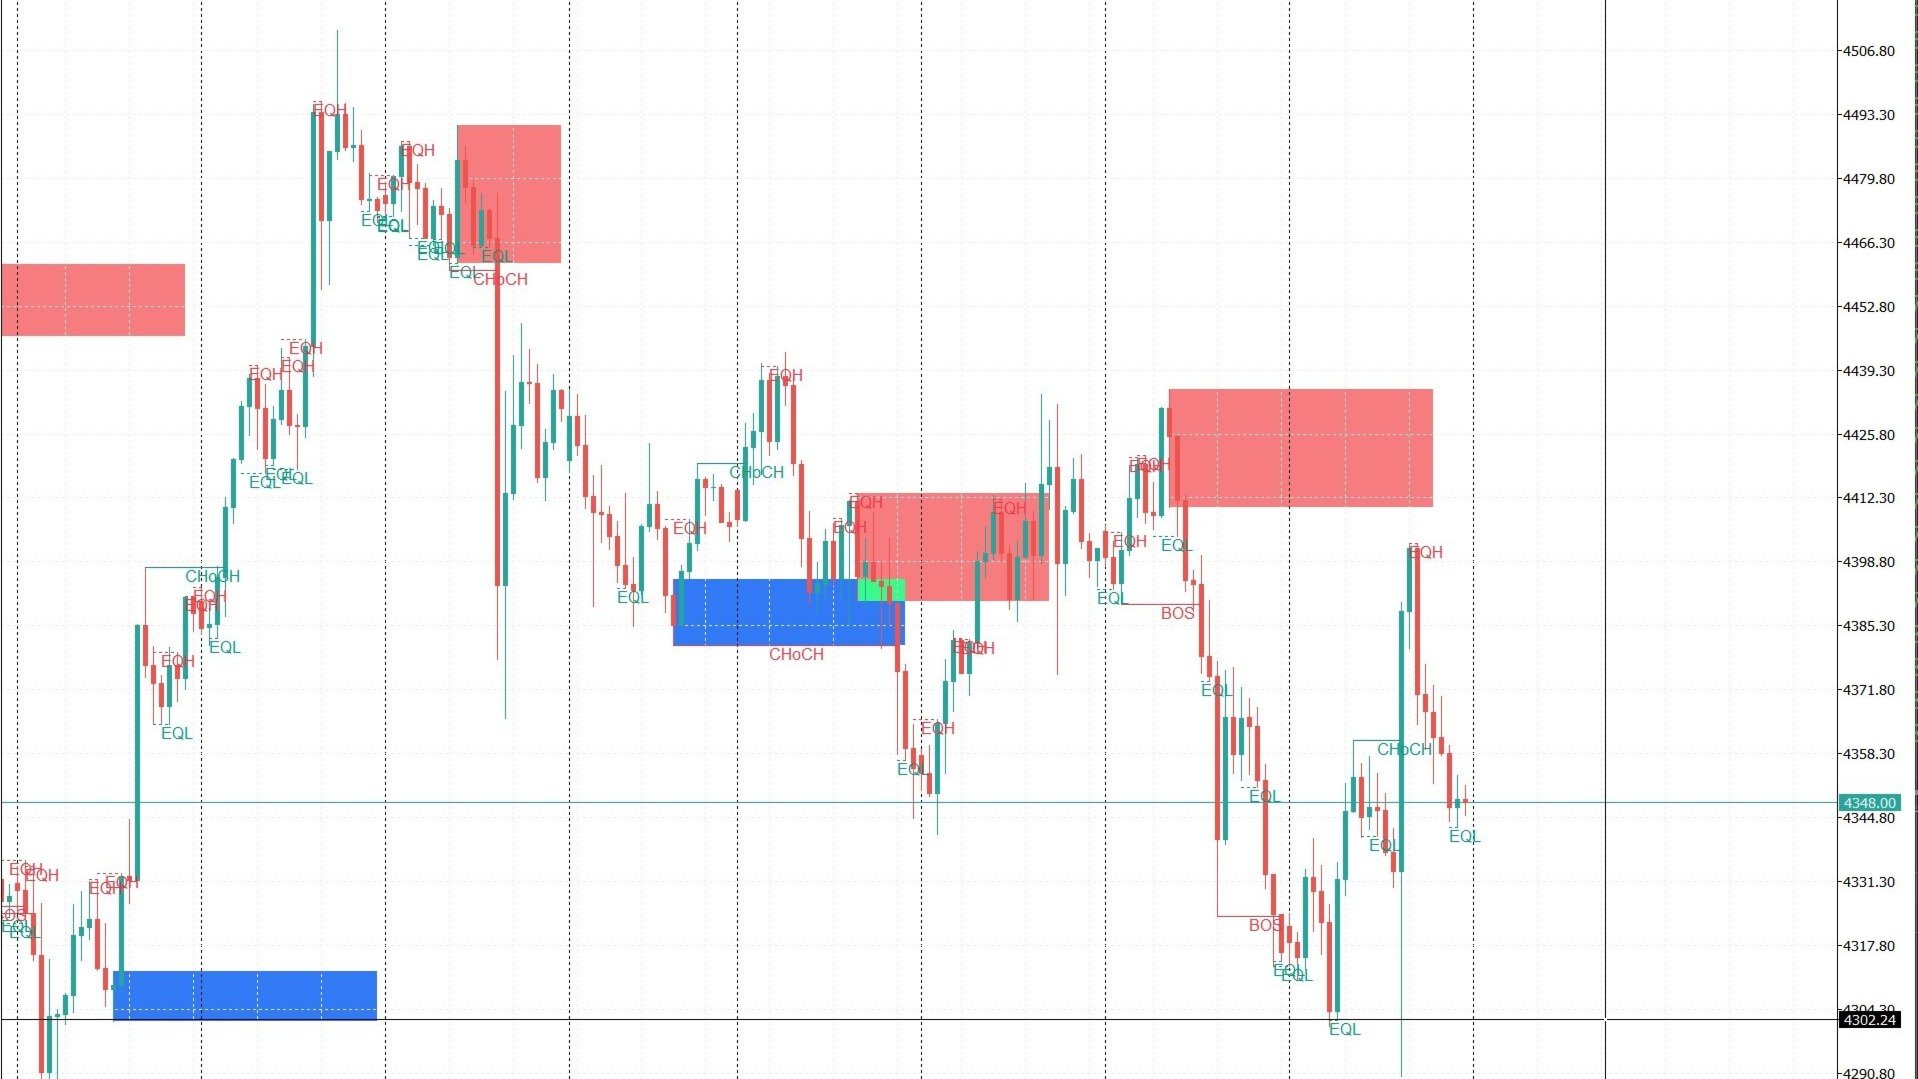
The SMC Smart indicator automates market structure analysis based on the Smart Money Concepts (SMC) methodology. It removes subjective chart analysis by automatically plotting Order Blocks, Fair Value Gaps (FVG), Break of Structure (BOS), Change of Character (CHoCH), and liquidity pools.
1. Core Chart Features
Market Structure
The indicator categorizes market structure into two distinct levels:
-
Swing Structure: Uses a larger lookback length ( InpSwingsLength = 50 ) to define the medium-to-long-term trend. It marks key structural points: HH (Higher High), HL (Higher Low), LH (Lower High), and LL (Lower Low).
-
Internal Structure: Uses a smaller lookback length (5 bars) to track sub-structures and minor waves within major swings.
-
BOS (Break of Structure): Triggered when a candle closes beyond the most recent structural high/low, confirming trend continuation.
-
CHoCH (Change of Character): Triggered when a candle closes beyond the first structural reversal level, signaling a potential trend reversal.
Points of Interest (POI)
-
Order Blocks (OB): Automatically identifies and draws the final candle prior to an aggressive move that caused a BOS or CHoCH.
-
Bullish OB: Strong support zone (blue/green rectangle).
-
Bearish OB: Strong resistance zone (red/pink rectangle).
-
-
Fair Value Gap (FVG): Imbalance zone created across three consecutive candles where market orders were inefficiently filled. Price tends to retrace into these gaps before resuming the main trend.
-
EQH / EQL Liquidity (Equal Highs / Equal Lows): Dotted horizontal lines marking equal highs or lows. These areas pool retail stop-losses—prime targets for Smart Money liquidity sweeps.
Premium & Discount Zones
Automatically divides the current swing range into three pricing tiers:
-
Premium Zone (Upper 50%): Favorable for SELL setups only.
-
Discount Zone (Lower 50%): Favorable for BUY setups only.
-
Equilibrium (50% Level): Neutral zone where entering new trades should generally be avoided.
2. Key Input Parameters
| Parameter Group | Parameter Name | Description & Recommendation |
| Smart Money Concepts | InpMode | HISTORICAL: Retains all historical drawings (ideal for backtesting). PRESENT: Displays active structures only (keeps charts clean and lightweight). |
| Real Time Swing Structure | InpSwingsLength | Bar count for defining Swing Points. Default is 50 (ideal for Day/Swing trading). Reduce to 15 - 30 for M1–M5 scalping. |
| Order Blocks | InpShowInternalOB / InpShowSwingOB | Toggle display for Internal or Swing Order Blocks. |
| EQH/EQL | InpEqualThreshold | ATR multiplier threshold for detecting equal highs/lows. Default is 0.1 ATR. |
| Fair Value Gaps | InpShowFVG | Set to true to highlight price imbalance gaps. |
| Premium & Discount | InpShowZones | Set to true to display shaded Premium/Discount background zones. |
3. Effective Trading Workflow
To maximize win rate and Risk-to-Reward (R:R) ratios, follow this 4-step framework:
[Determine Swing Bias] ➔ [Filter Premium/Discount Zone] ➔ [Identify POI (OB/FVG)] ➔ [Lower Timeframe CHoCH Confirmation]
Step 1: Establish Swing Bias
-
Observe recent Swing BOS/CHoCH signals.
-
If a Bullish Swing BOS recently formed $\rightarrow$ Focus exclusively on BUY setups.
-
If a Bearish Swing BOS recently formed $\rightarrow$ Focus exclusively on SELL setups.
Step 2: Location Filter (Premium / Discount)
-
Avoid BUYING when price is inside the Premium Zone.
-
Avoid SELLING when price is inside the Discount Zone.
-
Only look for BUY setups in the Discount Zone and SELL setups in the Premium Zone.
Step 3: Select Points of Interest (POI)
-
Locate an Order Block (OB) or FVG that sits completely inside the Discount Zone (for Buys) or Premium Zone (for Sells).
-
Confluence Boost: If an EQL or EQH rests just ahead of the OB, liquidity will likely be swept into that OB before price reverses strongly.
Step 4: Entry & Risk Management
-
Direct Limit Entry: Place a pending limit order at the outer boundary of the OB/FVG, with Stop Loss placed a few pips past the OB wick.
-
Confirmation Entry (Recommended): Once price reaches a high-timeframe OB, drop to a lower timeframe (e.g., M1/M5) and enter market orders only after an Internal CHoCH reversal signal prints.
4. Practical Tips & MT5 Optimization
-
Chart Clarity: If the chart feels cluttered, disable InpShowInternals (retaining Swing Structure only) while keeping InpShowInternalOB enabled.
-
Candle Close Rule: Valid BOS and CHoCH signals require a candle body close beyond structural levels. A wick breach alone signifies a Liquidity Sweep, not a structural break.
-
Performance Efficiency: The bulk ATR buffer calculation, the indicator executes smoothly across multiple open charts without causing MT5 frame drops.