Regression Breakout Map
- Göstergeler
- Sürüm: 1.0
- Etkinleştirmeler: 10

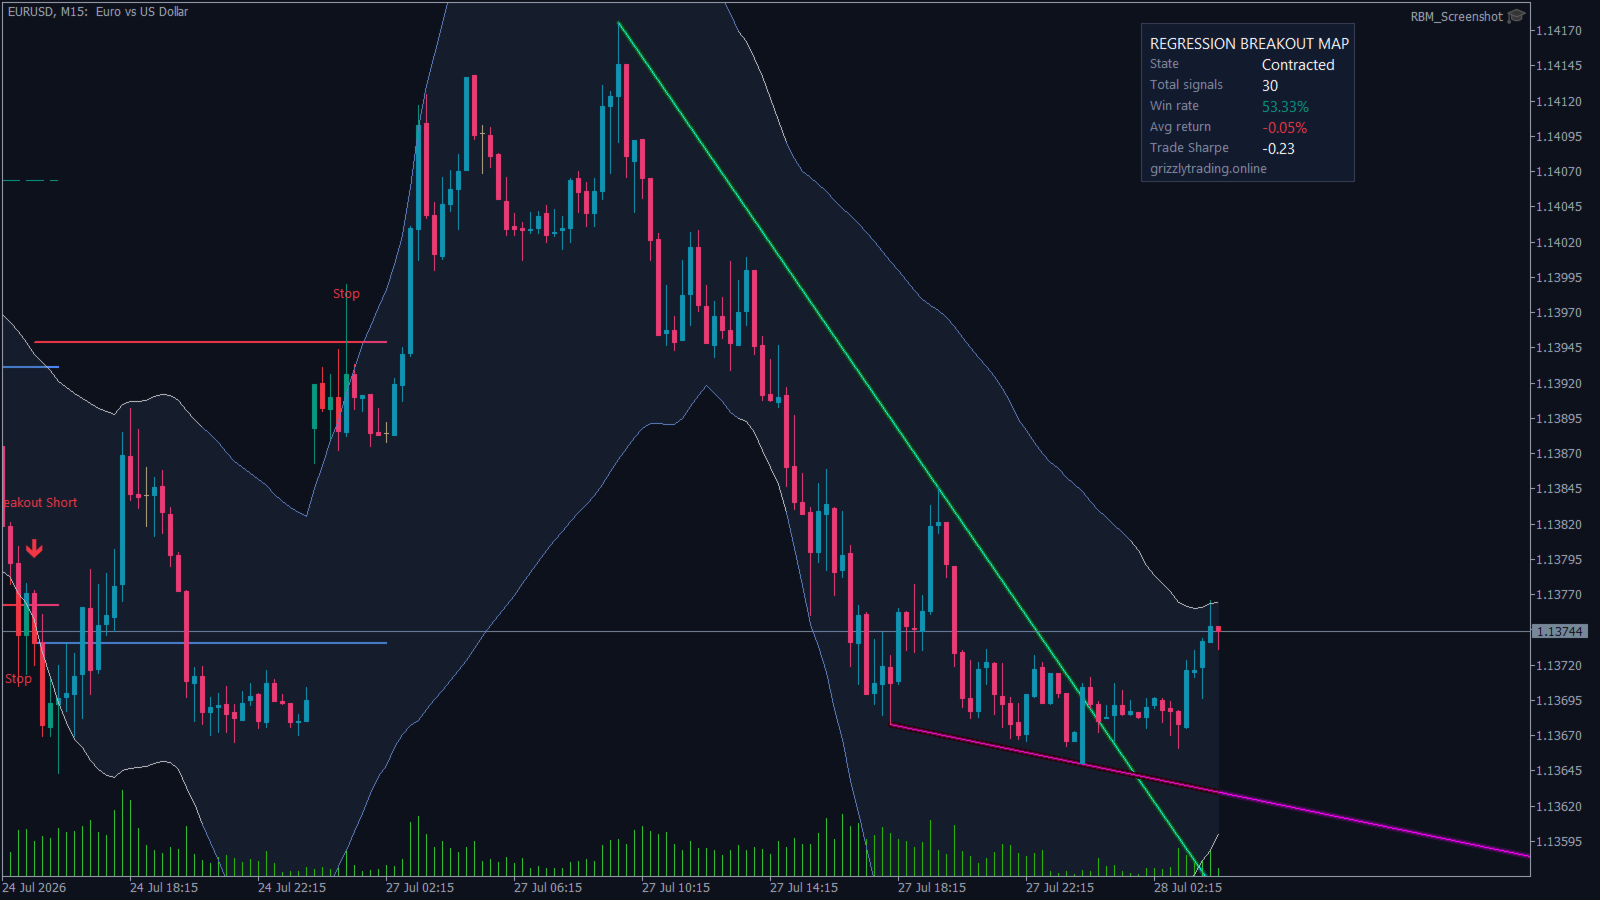
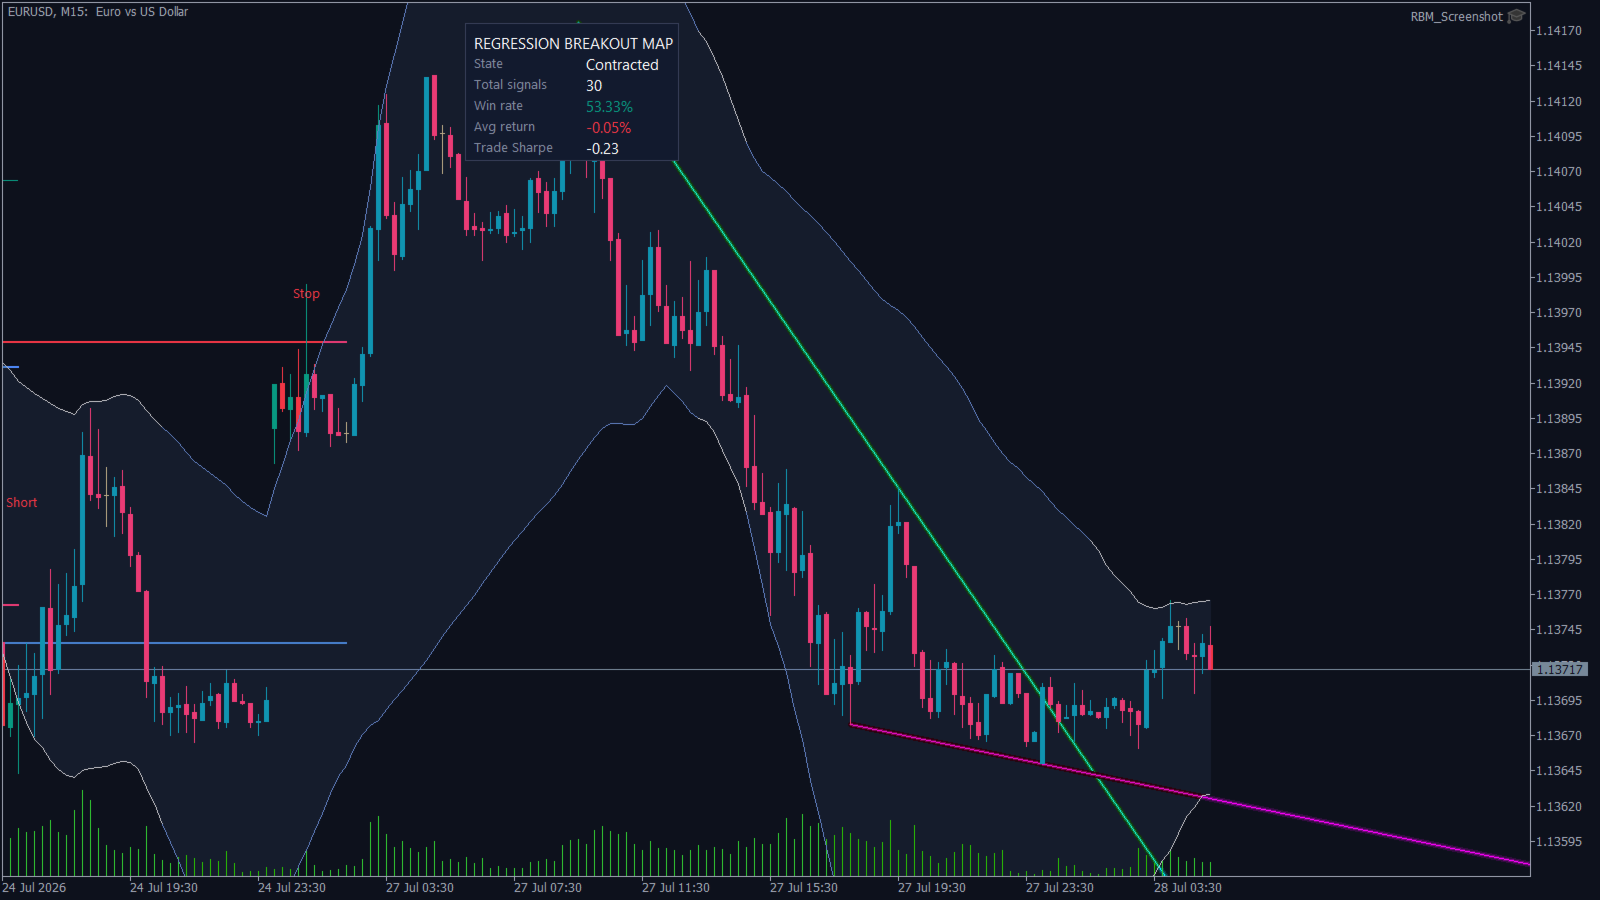
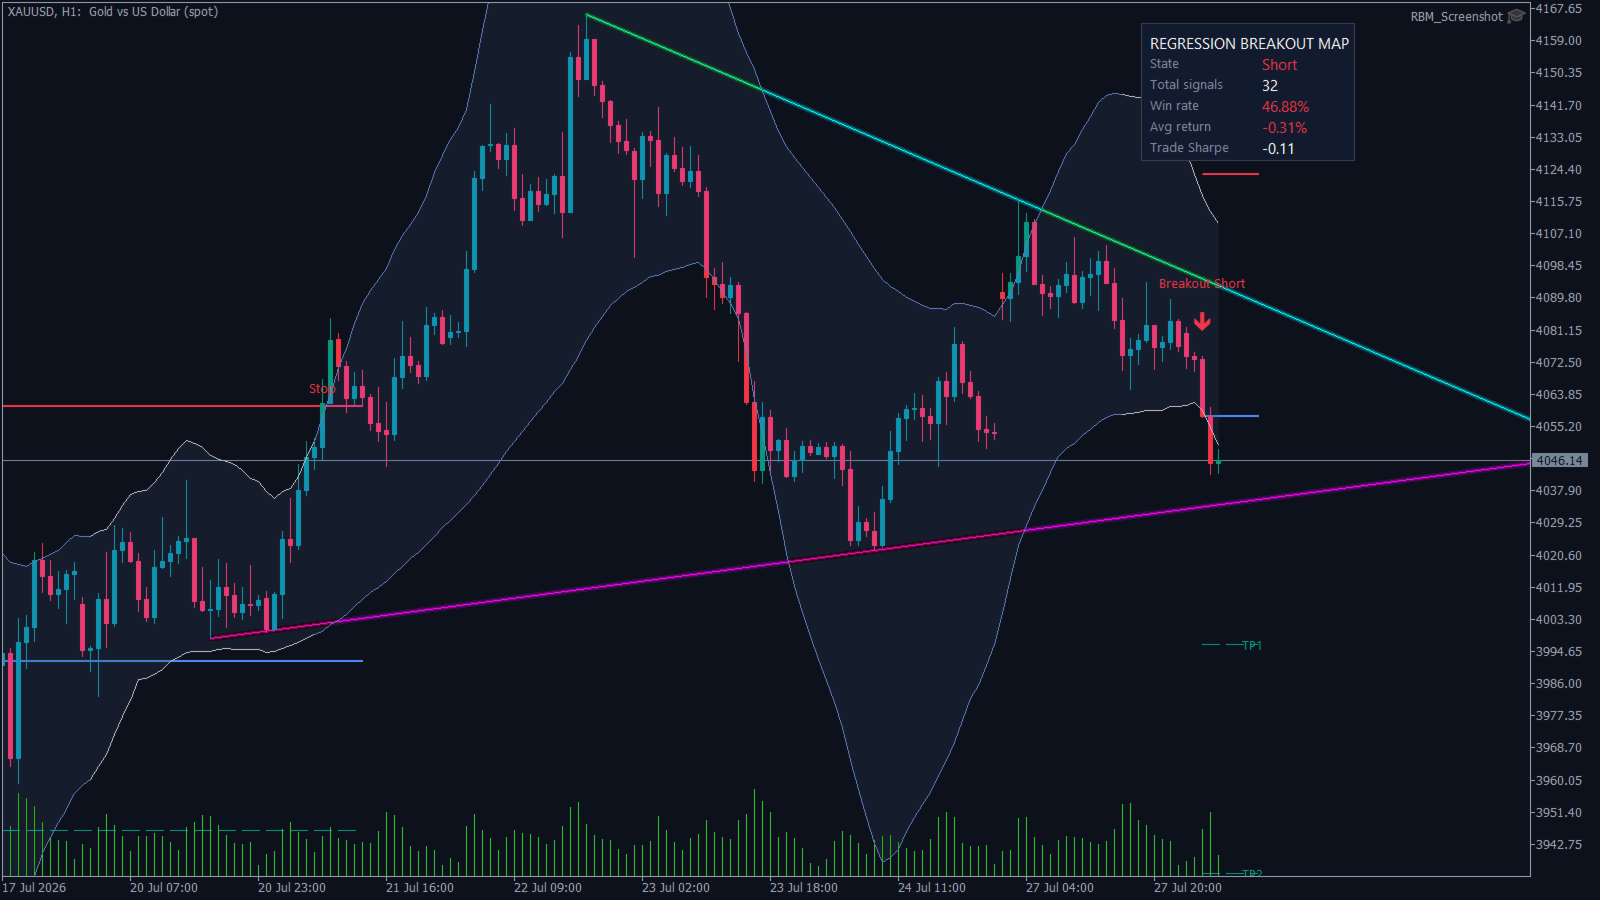
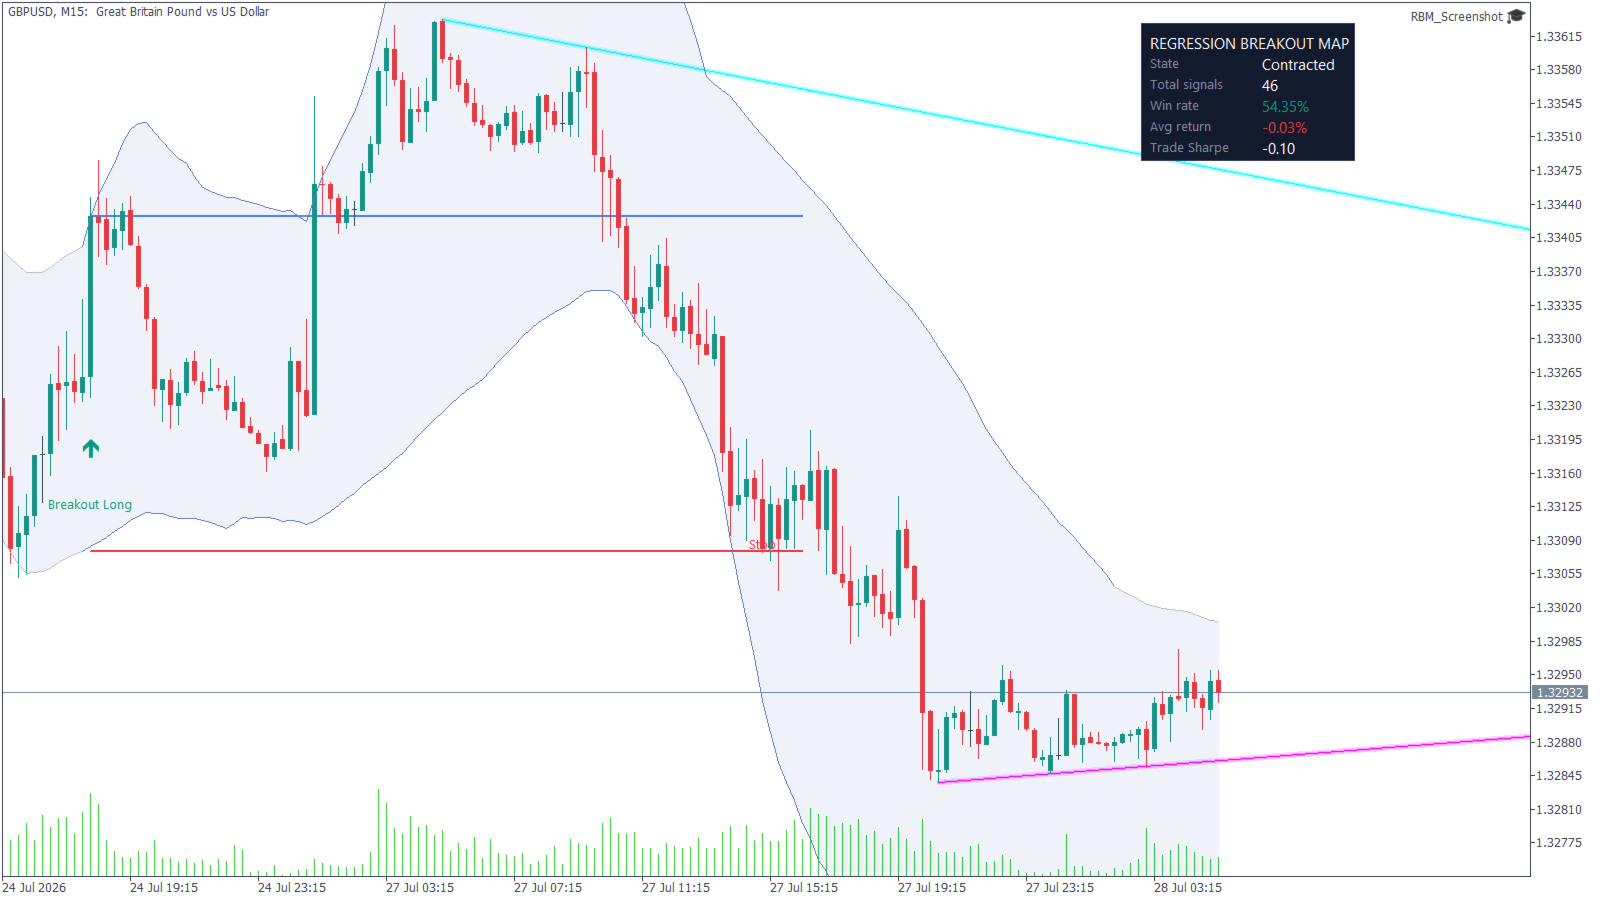
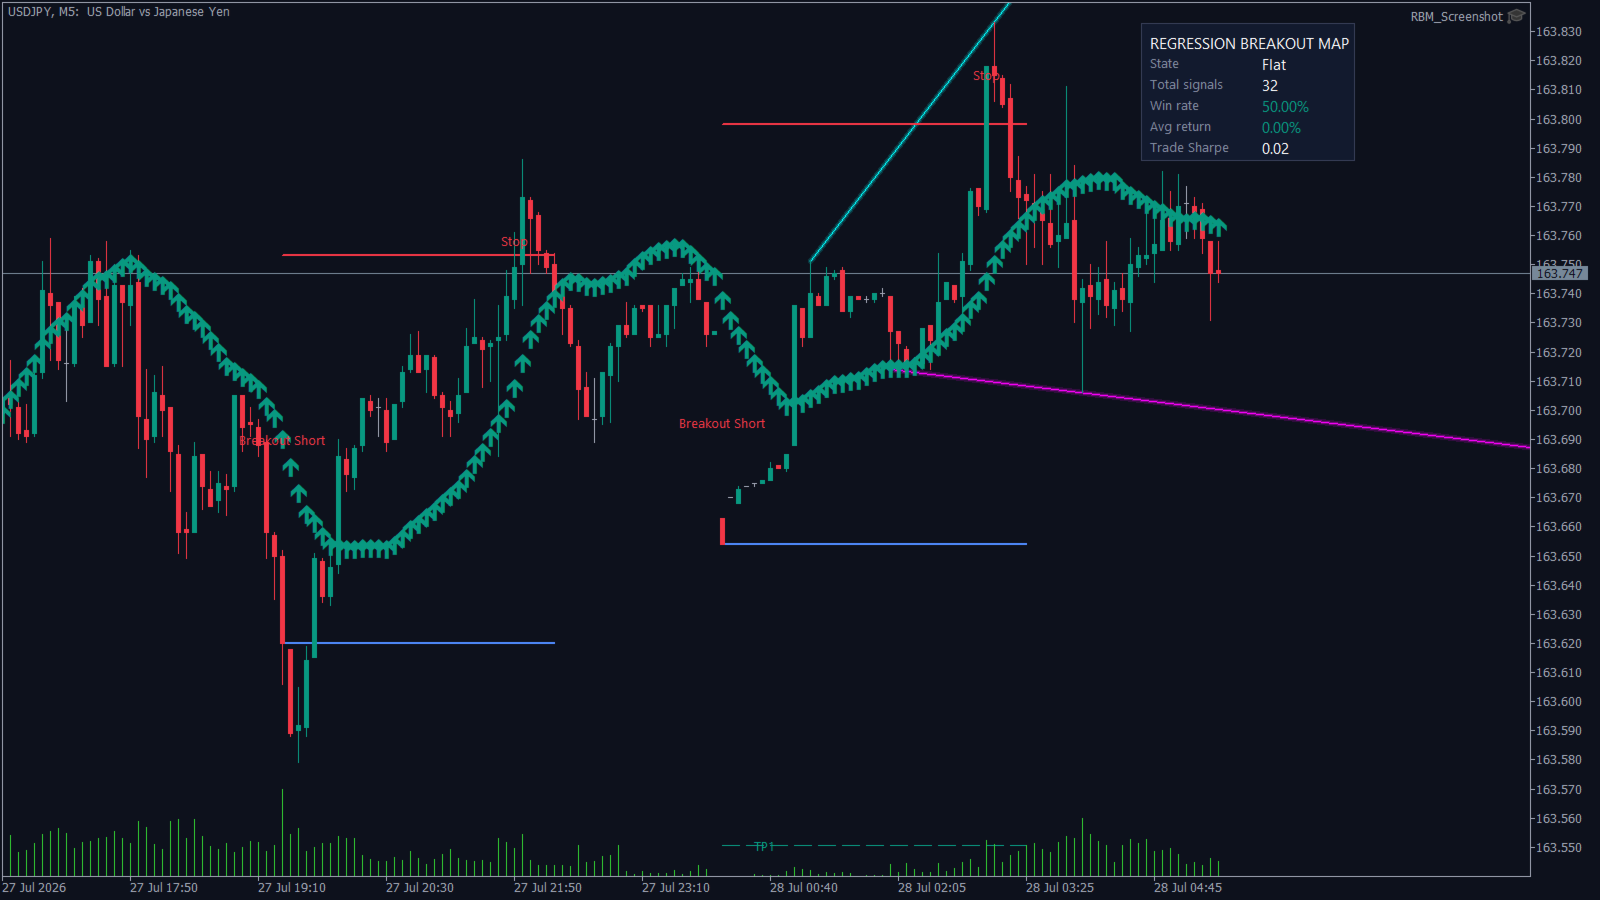
Regression Breakout Map is a breakout indicator for MetaTrader 5 built around an adaptive linear regression channel. It finds periods where volatility has contracted, marks the breakout when price leaves the channel, and then draws the complete trade map on your chart: entry, stop loss, and a TP1 / TP2 / TP3 target ladder with a stop that ratchets forward as each target is reached.
It works on any symbol - forex, indices, metals, crypto - on every timeframe from M1 to H12, and it does not repaint: every signal is confirmed on the close of the bar and never moves afterwards.
Adaptive Regression Channel
A least squares linear regression line is fitted to recent closes and surrounded by standard deviation bands. Unlike a fixed moving average envelope, the channel tilts with the prevailing trend, so the breakout levels follow the market instead of lagging behind it.
The channel changes colour when volatility contracts, so a compressing market is visible at a glance rather than something you have to measure.
Volatility Contraction Detection
Channel width is ranked against its own recent range. When width falls into the lowest part of that range, the market is in contraction - the squeeze that so often precedes an expansion move. The contraction threshold and lookback are both adjustable.
A breakout signal is only produced when price leaves the channel immediately after a contracted bar. That single filter removes the majority of aimless band touches that occur in already-volatile conditions.
The Complete Trade Map
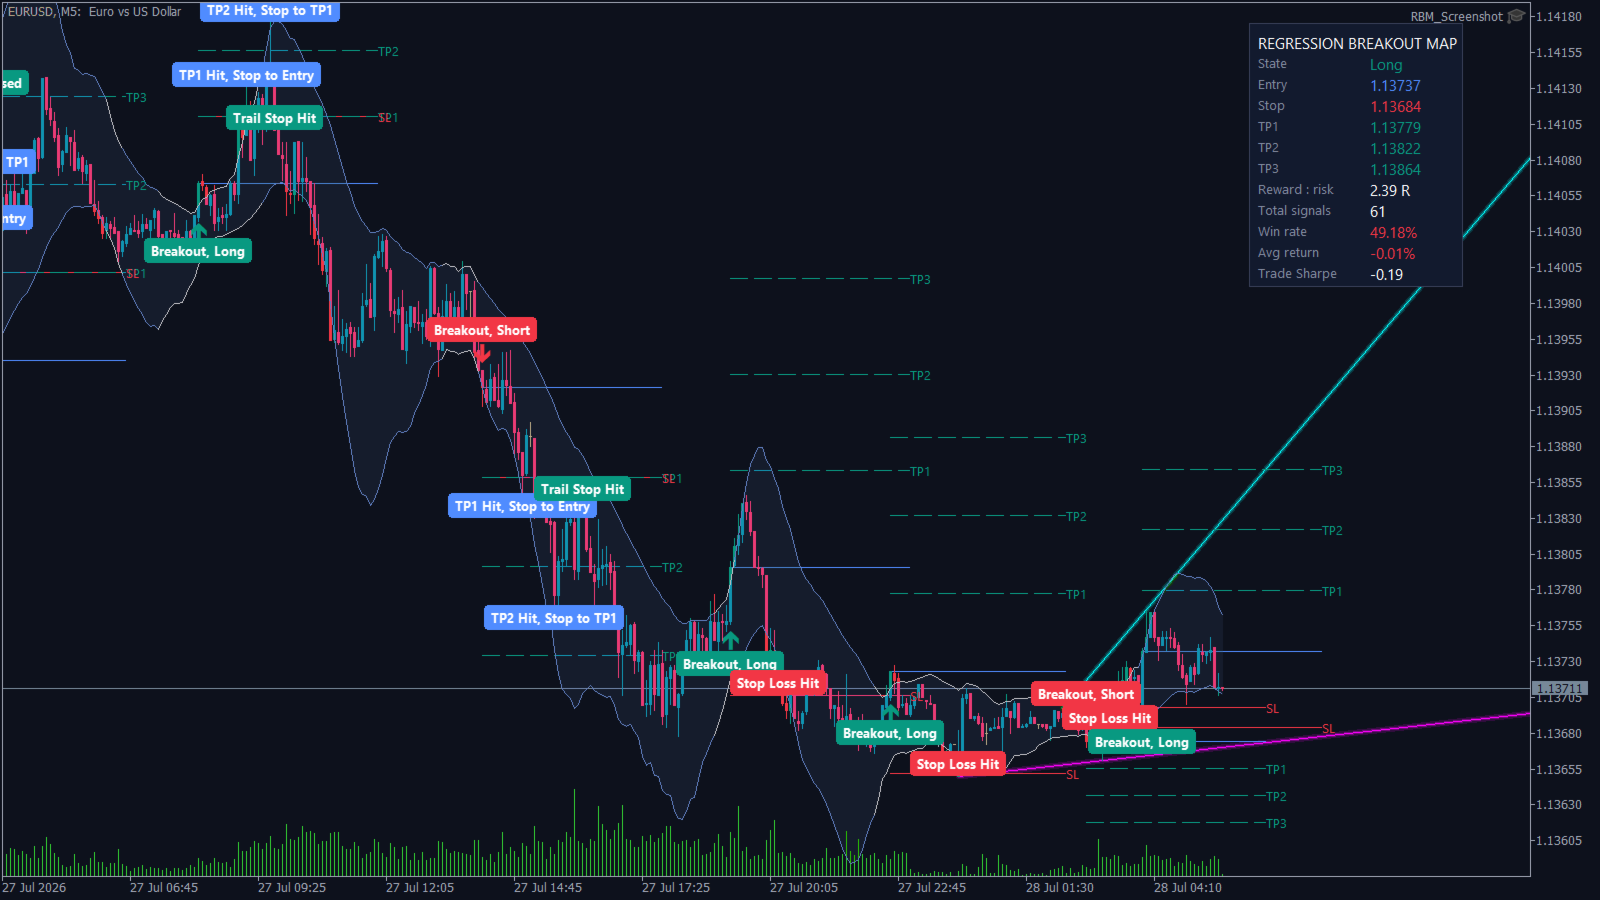
When a breakout fires, the indicator draws everything needed to manage the position:
- Entry level, marked with a labelled arrow.
- Stop loss, placed at the opposite band as it stood before the breakout.
- TP1, TP2 and TP3, each a configurable multiple of the channel width, drawn as dashed lines running forward across the chart with their own labels.
- A ratcheting stop: reaching TP1 moves the stop to entry, reaching TP2 moves it to TP1. Both steps can be switched off.
- Clear event labels on the chart - Breakout Long, Breakout Short, TP1 Hit, TP2 Hit, Trail Stop Hit, Stop Loss Hit - so the full history of every setup can be read directly from the chart.
Live Trade Panel
While a setup is active the dashboard shows the numbers you actually need: entry price, current stop (labelled so you can see whether it has moved to breakeven or to TP1), all three target prices, and the reward to risk ratio of the setup. No measuring, no arithmetic.
Below that it tracks how the settings have behaved on your chart: total signals, win rate, average return per signal and a trade Sharpe ratio, all computed from the visible history so you can compare settings on your own instrument instead of taking someone's word for it.
Pivot Trendlines
Confirmed swing highs and swing lows are connected into support and resistance trendlines that extend forward, drawn with a soft glow so they sit on the chart without competing with price. Pivot sensitivity is adjustable, and the overlay can be switched off entirely.
Alerts
Optional alerts on breakout, on each target being reached, and on the stop being hit. Terminal popup, push notification to your phone, email and sound are all supported and independently switchable. Alerts fire only on confirmed bars and only in real time, so attaching the indicator never floods you with historical notifications.
What It Does Not Do
This is an analysis tool, not a trading system. It places no orders and makes no claims about profitability. It marks where the channel is, where the breakout happened, and where the stop and targets sit. The statistics it reports are measured from your own chart history - they are a way to compare settings, not a forecast.
Requirements and Notes
- Timeframes M1 to H12.
- Signals are confirmed on bar close and do not repaint. The bar still forming never carries a signal.
- One setup is tracked at a time; breakouts occurring while a setup is still open are ignored by design.
- One instance per chart.
Input Parameters
Regression Model
- Regression length - number of bars in the least squares fit.
- Deviation multiplier - width of the bands in standard deviations.
- Show regression basis line - the centre line of the channel.
- Shade the channel - fill between the bands.
Contraction Metrics
- Contraction lookback - how far back channel width is ranked.
- Contraction threshold - the percentage of that range below which the market counts as contracted. Lower values mean fewer, tighter setups.
Target Architecture
- TP1, TP2 and TP3 multipliers - each target as a multiple of the channel width at the breakout.
- Move stop to entry after TP1.
- Move stop to TP1 after TP2.
- Completed trades drawn - how many finished setups stay on the chart.
Pivot Trendlines
- Show pivot trendlines.
- Pivot length - bars required either side of a swing for it to confirm.
- Resistance and support trendline colours.
- Draw glow around trendlines.
Colours
- Channel normal and contracted colours.
- Channel shading transparency - blended against your chart background, so it suits light and dark themes.
- Long signal, short signal, target, stop and entry colours.
Signals and Alerts
- Draw event labels and label font size.
- Target lines extend - how far forward the ladder is drawn, in bars.
- Event label text colour.
- Alert on breakout, on target hit, on stop hit.
- Alert channels - terminal popup, push notification, email, sound.
- Alert sound file.
Dashboard
- Show performance dashboard.
- Dashboard corner, X offset, Y offset, font size and font.
- Background, border, text and label colours.
Engine
- Max bars processed - limit on how much history is analysed.
Branding
- Panel title and an optional footer row. Empty by default.