Triple Divergence Hunter MT4
- Göstergeler
- Sürüm: 1.10
- Güncellendi: 30 Temmuz 2026
- Etkinleştirmeler: 20

Product Overview
Triple Divergence Hunter is a multi-indicator divergence detection sub-window indicator designed specifically for both MT4 and MT5 platforms. It deeply integrates three classic momentum indicators—MACD, KDJ, and RSI—using rigorous crossover and extreme value comparison algorithms to precisely capture top and bottom divergences between price and indicators. Additionally, the indicator features a built-in custom K88/D88 momentum trend system, helping traders identify reversal signals at trend exhaustion and capture high win-rate left-side or right-side trading opportunities in complex markets.
Core Features
K88/D88 Momentum Trend System & Overbought/Oversold Reference Lines The system constructs a custom KDJ model based on 34-period extreme value calculations, generating the K88 main line and D88 auxiliary line. The K88 line automatically changes color based on bull/bear states: red for bullish states, green for bearish states. The sub-window uses a fixed 0-100 coordinate system with built-in 80 and 20 horizontal reference lines to define overbought and oversold zones. The MT5 version additionally features K88/D88 histogram fill display, making momentum shifts and bull/bear power comparisons even more intuitive and three-dimensional.
Buy Signals (Bottom Divergence)
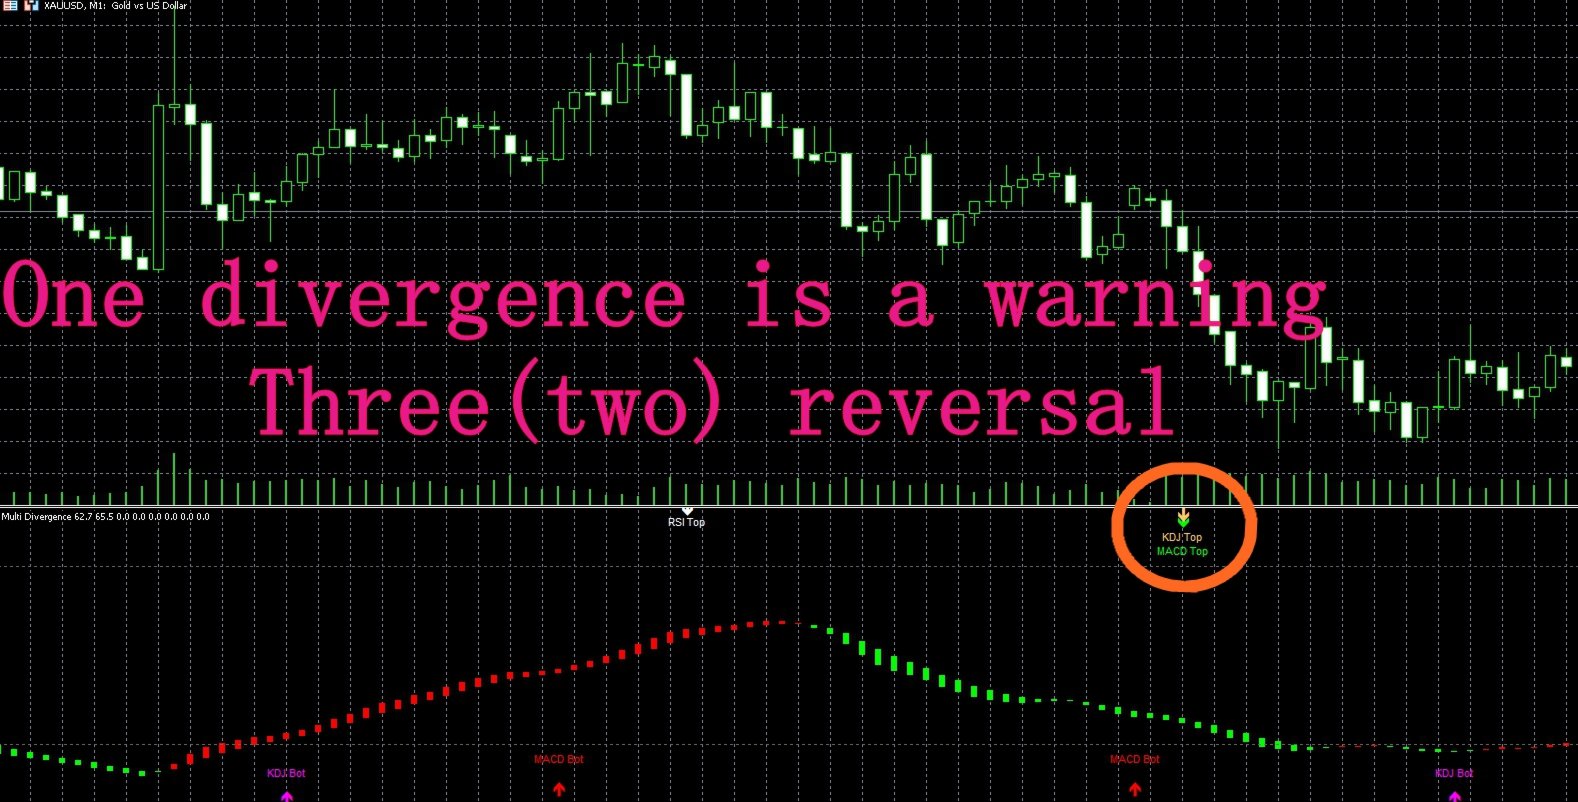
- MACD Bot: Triggered when price makes a new low but the MACD DIF line does not make a new low, confirmed when DIF crosses above DEA (golden cross), displaying a red upward arrow. This represents medium-to-long-term downward momentum has exhausted, serving as a highly practical trend reversal buy signal.
- KDJ Bot: Triggered when price makes a new low but the KDJ K value does not make a new low, confirmed when K crosses above D (golden cross), displaying a purple upward arrow. This represents rebound momentum after short-term oversold conditions is accumulating, suitable for capturing short-cycle rebound buying opportunities.
- RSI Bot: Triggered when price makes a new low but the RSI indicator does not make a new low, confirmed when the fast line crosses above the slow line (golden cross), displaying a yellow upward arrow. This represents market relative strength is reversing, serving as a potential bottom entry signal.
Sell Signals (Top Divergence)
- MACD Top: Triggered when price makes a new high but the MACD DIF line does not make a new high, confirmed when DIF crosses below DEA (death cross), displaying a green downward arrow. This represents medium-to-long-term upward momentum has exhausted, serving as a highly practical trend reversal short-selling or exit signal.
- KDJ Top: Triggered when price makes a new high but the KDJ K value does not make a new high, confirmed when K crosses below D (death cross), displaying an orange downward arrow. This represents pullback risk after short-term overbought conditions is intensifying, suitable for capturing short-cycle pullback short-selling opportunities.
- RSI Top: Triggered when price makes a new high but the RSI indicator does not make a new high, confirmed when the fast line crosses below the slow line (death cross), displaying a white downward arrow. This represents market relative strength is peaking and falling back, serving as a potential top short-selling signal.
Practical Application
Divergence is one of the most reliable signals in technical analysis for capturing trend reversals. When the K88 line enters the overbought zone above 80 or the oversold zone below 20, traders should be highly vigilant about trend change risks.
If multiple bottom divergence signals appear simultaneously in the sub-window (e.g., MACD Bot and KDJ Bot resonance), and the K88 line forms a golden cross diverging upward below 20, it represents extremely high bottom reversal probability, and long positions can be decisively established. Conversely, if multiple top divergence signals resonate and the K88 line forms a death cross diverging downward above 80, it represents the top is confirmed, and short positions should be firmly taken or long positions closed.
Parameter Guide
Core algorithm parameters: RSI Period 1 defaults to 7, RSI Period 2 defaults to 14, controlling dual-track RSI calculation periods; Max Lookback Bars defaults to 2000, controlling the maximum historical signal annotation range.
Alert settings: Alert On Bar Close is enabled by default. It is highly recommended to keep this on, triggering alerts only after bar close confirmation to avoid false divergence signals caused by intrabar price fluctuations. Popup and Sound are enabled by default; Push and Email are disabled.
Individual signal alert toggles: The system allows you to independently enable or disable alerts for the 6 signals: MACD, KDJ, and RSI top and bottom divergences, catering to personalized trading needs.
Usage Notes
This indicator is suitable for major trading instruments including Forex, Metals, Indices, and Crypto. It is fully compatible with both MT4 and MT5 terminals. It is recommended to use it on M15 and higher timeframes, as divergence signals on larger timeframes are more stable and accurate than on smaller timeframes.
Divergence signals belong to left-side or early right-side reversal signals. It is recommended to combine them with main chart trend indicators or support/resistance levels for secondary confirmation. No indicator guarantees a 100% win rate; please strictly set stop-losses and manage position risk.
Summary
Triple Divergence Hunter perfectly integrates the divergence detection logic of three classic indicators with a custom momentum system. It is not only a visually clear sub-window analysis tool but also a practical trading system with strict crossover confirmation, multi-dimensional divergence filtering, and comprehensive alerts, suitable for traders at all levels to build their own reversal trading rules.