Low Buy High Sell Radar MT4

Product Overview
Low Buy High Sell Radar is an all‑in‑one main‑chart trend‑following and swing‑trading indicator designed for both the MT4 and MT5 platforms. By building a dynamic trend‑line color‑switching system and combining multi‑period oscillator algorithms (TSI and RSI), a volume‑price momentum model, and a signal‑cooldown filter, it delivers a full range of trading signals covering trend confirmation, overbought/oversold detection, and precise entry and exit. With rigorous logic, clean visuals, and a complete cooldown plus multi‑channel alert mechanism, it is an ideal choice for building a main‑chart trading system.
Core Features
Dynamic Trend Line and Moving Average System The system draws two core trend‑identification elements on the main chart: the MA60 magenta line, a 60‑period simple moving average that serves as the medium‑to‑long‑term trend reference, and the dynamic trend line, which is based on a white central axis and automatically turns into a thick red line when short‑term momentum keeps rising, or into a thick green line when short‑term and medium‑term momentum weaken together, visually reflecting the shift of bullish and bearish dominance. Traders only need to watch the trend‑line color to quickly judge the prevailing market direction. The system displays a white real‑time closing‑price label to the right of the latest candle. The MT5 version additionally supports candle color‑coding, coloring rising candles blue, falling candles red, flat candles gray, and bullish‑turn candles yellow, so that trend state and reversal patterns are shown intuitively through candle color.
Buy Signals
  • Low Buy (Dip Buy): Triggered when the short‑term oscillator crosses above its signal line while its value is below 30 (the oversold zone), displaying a light‑red upward arrow with the text "Low Buy" below the candle low. This means price has moved deep into the oversold zone, bearish momentum is starting to exhaust, and the first signs of reversal are appearing, making it an agile left‑side low‑level trial position or oversold‑bounce capture signal.
  • Buy (Buy): A multi‑condition confluence signal based on the TSI (True Strength Index), triggered when the TSI value is at the lowest point of the last 7 candles and the TSI crosses above its moving average from the negative zone, displaying a yellow upward arrow with the text "Buy" below the candle. This means that after a deep decline the momentum indicator has confirmed the early signal of a trend reversal, making it a higher‑win‑rate right‑side trend‑reversal long‑entry signal.
Sell & Exit Signals
  • High Sell (Rally Sell): Triggered when the short‑term oscillator crosses below its signal line while its value is above 85 (the overbought zone), displaying a green downward arrow with the text "High Sell" above the candle high. This means price has moved deep into the overbought zone and bullish momentum is severely overextended, making it a clear short‑term high take‑profit or reverse‑short signal.
  • Sell (Sell): A multi‑condition confluence signal based on the TSI indicator, triggered when the TSI value is at the highest point of the last 7 candles and the TSI crosses below its moving average from the high zone, displaying a green downward arrow with the text "Sell" above the candle. This means that after a rapid rally the momentum indicator has confirmed the early signal of a trend reversal, making it a clear right‑side trend‑reversal short or full‑exit signal.
  • Top (Top): Triggered when the RSI indicator falls back below 84 from the overbought zone (above 84), displaying a yellow downward arrow with the text "Top" above the candle. This means a short‑term top structure has formed and bullish strength is materially fading, making it an early‑warning exit signal for trimming longs, taking profit, or placing a protective stop.
Practical Application
In day‑to‑day swing trading, the dynamic trend‑line color is the primary decision basis. During thick‑red‑line phases, focus only on buy signals (Low Buy and Buy); during thick‑green‑line phases, focus only on sell and exit signals (High Sell, Sell, and Top). This fundamentally avoids counter‑trend operations and keeps every trade aligned with the prevailing market direction.
The Low Buy signal suits left‑side traders capturing bounces in the oversold zone and is best used when price approaches a prior low or a support level, where the risk‑reward ratio is often most favorable; the Buy signal is a right‑side confirmation signal with a higher win rate, suitable for trend traders building positions at the start of a reversal, and can serve as the basis for adding to or opening the main position. The High Sell and Sell signals correspond to overbought‑zone exits and trend‑reversal shorts respectively; the former is more aggressive and suited to short‑term profit‑taking, while the latter is more robust and suited to trend shorts or full liquidation. As an early‑warning signal, Top is best verified a second time with candle patterns (such as long upper shadows or engulfing patterns) before trimming or taking profit.
Parameter Settings
Core algorithm parameters: The system has a built‑in unified signal‑cooldown mechanism; Signal cooldown defaults to 10 candles and is shared by all five signal types, effectively preventing repeated signals in extreme conditions and preserving signal scarcity and value. Max Lookback Bars defaults to 2000, controlling the maximum number of historical candles marked with signals, balancing chart cleanliness with backtesting needs.
Alert settings: Alert On Bar Close is enabled by default and is strongly recommended to stay enabled, so alerts fire only after a candle closes and confirms the signal, avoiding false‑cross signals caused by violent intrabar price swings. Popup and Sound are enabled by default, while Push and Email are disabled by default; traders can adjust them flexibly according to their screen‑watching habits.
Per‑signal alert switches: The system lets you independently enable or disable alerts for each of the five core signals, Low Buy, High Sell, Buy, Sell, and Top, so you receive only the signals relevant to your current strategy and filter out unnecessary noise.
Usage Recommendations
This indicator applies to mainstream instruments such as forex, precious metals, indices, and cryptocurrencies, and is fully compatible with the MT4 and MT5 terminals. It is recommended for use on the H1 timeframe and above; multi‑factor confluence signals on larger timeframes are more stable and practically valuable than on smaller ones, effectively reducing noise.
It is recommended to combine this indicator with main‑chart support/resistance lines or a volume indicator. A Low Buy signal near a prior low accompanied by rising volume greatly increases reliability; a Sell signal near a prior high accompanied by shrinking volume is a high‑confidence top‑escape signal. No indicator can guarantee a 100% win rate, so please always set strict stop losses and control position risk, using this indicator as a decision aid rather than the sole basis.
Summary
Low Buy High Sell Radar perfectly fuses three mechanisms: dynamic trend identification, multi‑factor signal confluence, and strict cooldown filtering. It is not only a visually clear main‑chart trend tool but also a practical swing‑trading system with layered signal design, independent alert control, and all‑round filtering, suitable for traders at every level to build robust dip‑buy/rally‑sell and trend‑following rules and capture high‑win‑rate opportunities while controlling risk.

Önerilen ürünler
Pipsurfer
Clinton Keenan Obinna Butler
Overview: With so much noise and distraction in the markets I wanted to create clarity for traders to have a simple, efficient, and fun trading experience. This is why I created Pipsurfer. Pipsurfer is an trend following indicator that visually shows you important Institutional Smart Money levels in the market and helps you to trace Market Structure in the markets. Most traders find it difficult to visually see trading elements such as trend, structure and momentum which are key for understandin
WB Signal Mt4
Wilbert Sales Bagtas
WB Signal        WB Signal   is the Indicator that can help a Trader to S pot   a Quality Entry. Automatic Historical Recalculation:   Upon loading or changing assets, the script parses the entire available chart history via a dynamic loop array, mapping past setups so you can instantly back test its visual performance. Non-Repainting Signal Printing:   The code evaluates price action strictly after a candle finishes. Once a buy or sell arrow prints on your chart,   it will never change position
GS trendS
Aleksander Gladkov
GS trendS is a trend indicator that can be used for any Forex financial instrument. The indicator does not redraw and does not lag. Recommended timeframe H1. It is possible to select the trend algorithm settings {Only Open, Average Open/Close, Average High/Low} The color indicates the direction of the trend: yellow - direction can be SELL or BUY (S_B) blue - uptrend (BUY) red - downward trend (SELL) The indicator panel displays trend values of 5 timeframes for the current price level. The va
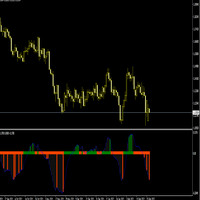
This highly informative indicator applies overbought/oversold levels for more accurate representation of the market situation. It is also possible to change the appearance of the indicator - line or histogram. Additional parameters enable more fine-tuning, while trading can be inside the channel and along a trend. Distinctive features Oversold/overbought levels; Does not redraw. Displayed as a line or a histogram; Works on all timeframes and symbols. Suitable for manual trading and development
Channel Cluster
Vitalyi Belyh
5 (1)
Cluster indicator working in the price channel. For operation, the indicator builds a channel line - (dashed line). Inside the channel, cluster sections are determined that determine the direction of the price movement - (histograms in two directions), start with large arrows. Small arrows are plotted above / below each histogram - indicator increase volatility. The indicator does not redraw the values. Works on any tools and timeframes. Entrances are made when large arrows appear, inside small
Keltner Channel Indicator Keltner Channel is an oscillator like Bollinger Bands. Keltner Channel is a very good tool to time entries for your strategy. Keltner Channel displays a channel where price is supposed to stay unless we are in overbought or oversold situations. Various strategies use Keltner Channel indicator successfully to spot overbought / oversold situations and look for reversals. Keltner Channel indicator uses ATR to determine overbought and oversold situations. Inputs of the indi
The block of bars is collected under condition of divergence . If the divergence conditions are not met, the block is deleted. More precisely, the condition is the transition of the block of bars from the state of divergence to the state of convergence . Blocks are formed selectively with gaps. Gaps are characterized by the state of convergence of bars. The indicator shows the value and direction of the price in the divergence block . To determine the divergence value, see here , the line of ext
Decent Trading Tools, The ones that separate the Winners from the Losers, do not have to be expensive. This is the second out of a series of two indicators from the magic series. This indicator is Magic Correlation , this is the Middle Indicator in the screenshot. The indicator plots up to 30 instruments and visualizes events like: Time, Start, End and Duration of the events. Underlying Correlation. Trend Strength. Front Runners and Laggards. Directions. Patterns. What normally remains hidden be
RSI Scanner is a multi symbol multi timeframe RSI dashboard that monitors Relative Strength Index indicator for price entering and exiting overbought and oversold in up to 28 symbols and 9 timeframes. Download Demo here  (Scans only M1 and W1) Settings description   here MT5 version   here RSI Scanner features: Signals RSI entering and exiting the overbought and oversold zones. Monitors 28 customizable instruments and 9 timeframes at the same time. You can choose between 3 alert modes:  Singl
Divergence Matrix Pro for MetaTrader 4 Divergence Matrix Pro is a confirmed multi-oscillator divergence indicator for MetaTrader 4. It detects regular and hidden divergence between price and selected oscillators, then presents the confirmed structure through divergence lines, pivot labels, action markers, an optional current-timeframe Matrix Panel and optional alerts. The indicator is an analysis and confirmation tool. It does not open or close trades, and the signal score is not a win rate or a
The Advanced Bands Squeeze indicator is a custom indicator based on the classic Bollinger Bands as created by John Bollinger. The Bollinger Band Squeeze occurs when volatility falls to low levels and the Bollinger Bands narrow. This low volatility level is called a “Squeeze”.  According to John Bollinger, periods of low volatility are often followed by periods of high volatility, where prices tend to move a lot in either direction. Therefore, a volatility contraction or narrowing of the bands
MACD Divergence
Sergey Deev
2.5 (2)
The indicator detects divergence signals - the divergences between the price peaks and the MACD oscillator values. The signals are displayed as arrows in the additional window and are maintained by the messages in a pop-up window, e-mails and push-notifications. The conditions which formed the signal are displayed by lines on the chart and in the indicator window. Indicator Parameters MacdFast - fast MACD line period MacdSlow - slow MACD line period MacdSignal - MACD signal line period MacdPric
G99 GRAVITY G99 Gravity is a channel indicator for the MetaTrader 4 terminal. This indicator allows finding the most probable trend reversal points. Unlike most channel indicators, G99 Gravity does not redraw. Attach the indicator to a chart, and the alert will trigger once a signal emerges. With our alerting system, you will never miss a single position opening signal! Advantages of the indicator Perfect for scalping. Excellent for identifying trend reversals. Suitable for beginners and exper
Trend Line Alert MT4
Christianiel Robles Faustino
Stop Watching Trend Lines. Get Alerted. Trend Line Alert  automatically monitors your diagonal trend lines and alerts you when price closes above, closes below, or touches the line . Go beyond a basic trend-line alert with candle and price-action confirmation designed to help you focus on higher-quality setups. KEY FEATURES Close Above Trend Line Get alerted when a qualifying candle closes above your trend line. Close Below Trend Line Detect bearish breaks when price closes below th
Borey
Dmitriy Zaytsev
The indicator detects price channels, reversal points and trend direction. All timeframes. No repainting. Channel borders are formed by support/resistance levels. Calculation is done on an active candle. If the red line is above the green one, a trend is bullish. If the red line is below the green one, a trend is bearish. After the price breaks through the green line, the indicator starts building a new channel. The indicator works well with the Forex_Fraus_M15.tpl template https://www.mql5.com/
FREE
ADX Color
Dmitriy Moshnin
This indicator is different from the conventional indicator by an additional set of parameters. The ADX line changes color depending on the location of the +DI and -DI lines relative to each other. Indicator Inputs Period — indicator calculation period; Method — select the averaging method: simple, exponential, smoothed, linear-weighted; Apply to — select the applied price: Close, Open; High; Low; Median; Typical; Average Weighted; By default, the directional lines are colored in the following
Channels Pro
Alexander Nikolaev
5 (3)
The indicator determines and plots price channels or lines, reading information from multiple timeframes (from current, second and third) simultaneously. Color and width of lines for each timeframe can be customized. It is also possible to set different distance between the Highs and Lows for plotting channels or lines. Parameters History - maximum number of bars to plot channels or lines; Distance - minimum distance from one High (or Low) to another when plotting lines; Shift - shift for sever
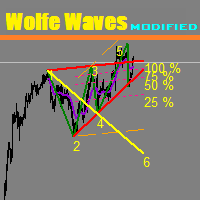
This unique indicator automatically builds Wolfe Waves. Features Finds the points and builds the lines automatically. Efficient trading strategy. No redraws, no lags. The indicator relaunch button is located directly on the chart. The indicator has multiple configurable parameters. Use If number 5 appears, wait till the first candle is closed behind Moving Average, then look at the three center lines showing what lot volume should be used if the fifth dot crossed the line 25%. The candle is cl
Noise filtering: the key to mastering trends This indicator tracks the market trend with an unmatched reliability, by ignoring sudden fluctuations and market noise. It has been designed to trend-trade intraday charts and small timeframes. Its winning ratio is around 85%. [ Installation Guide | Update Guide | Troubleshooting | FAQ | All Products ] Amazingly easy to trade Find oversold/overbought situations Enjoy noise-free trading at all times Avoid being whipsawed in intraday charts The indi
Dynamic Levels
Svyatoslav Kucher
Dynamic Levels is a channel indicator of dynamic levels, designed for identification of the price extremums. It allows increasing the efficiency of any strategy due to advanced parameters, which in turn allow customizing it for personal trading style. Dynamic Levels does not change its values, it is suitable for any timeframe and currency pair. Indicator Parameters ChannelPeriod - period for the indicator calculation. ChannelSmoot - smoothing of values. ATRPeriod - volatility calculation period
InfinX Slope MT4
Stanislav Shtiliyanov
The Slope indicator   measures the slope of a linear regression , which is the line of best fit for a data series. A 20-period Slope, therefore, measures the slope of a 20-day linear regression. ... In general, a positive slope indicates an uptrend, while a negative slope indicates a downtrend. How do you use slope Indicator? By applying the slope indicator  to both the price chart and the price relative , chartists can quantify the price trend and relative performance with one indicator. A pos
Imagic06
Aleksandr Morozov
The indicator represents 2 lines of different periods: one line is short-term (red line), the other is long-term (blue line). Each of the lines is a hard Moving Average, weighted by many parameters. Accordingly, you need to trade according to chart volatility. For convenience, the indicator has been added moving averages of the High, Low, Median ((High-Low) / 2) periods. Input parameters: IndicatorPeriod: several periods (general- general period, calculation for all periods; small- short-term
Our new indicator is an important part of the Smart Money Concepts (SMC) system It uses a modern market vision and fast calculation methods. As a result, the trader has a complete picture of the trade at every moment in time, which makes the process of obtaining results easier and faster. Our new indicator displays the following important patterns:   Order Blocks. Imbalance – Fair Value Gap (FVG). Break Of Structures (BoS). Change of character (CHoCH). Equal highs & lows. Premium , Equilibrium
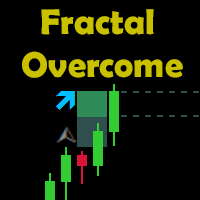
Indicator of fractals with adjustable indents. Designed according to an original simplified algorithm for use in EA. The main ones in the indicator are lines showing the levels of the current fractals, which allows you to read the values ​ ​ of the last fractal in one operation. It works on a closed bar, so it does not redraw and does not load the terminal with calculations. It should be understood that the indicator is late with the detection of the fractal by the number of bars on the righ
The Extreme point indicator helps in determining the probable price reversal points on the chart. The indicator facilitates the search for points to enter the market with greater accuracy. The indicator displays certain impulses, after which there is a high probability of the price continuing its movement in the same direction. The indicator can be used in conjunction with other indicators for a more accurate detection of the position entry points. The indicator can also be used independently. F
Williams Fraktal Trailing Stop, Bill Williams'ın fraktal analizinin ilkelerini uyarlanabilir bir takip durdurma mekanizmasıyla birleştiren profesyonel bir ticaret aracıdır. Gösterge, ticarete girme anlarının doğru bir şekilde belirlenmesini ve piyasa risklerinin en aza indirilmesini sağlarktal Trailing Stop, Bill Williams'ın fraktal analizinin ilkelerini uyarlanabilir bir takip durdurma mekanizmasıyla birleştiren profesyonel bir ticaret aracıdır. Gösterge, ticarete girme anlarının doğru bir şek
PnF Charts
Marcin Konieczny
4 (2)
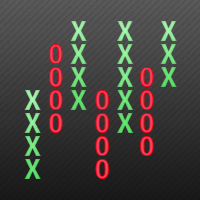
This indicator displays Point & Figure charts (PnF charts) in the indicator window. PnF charts show only price movements that are bigger than the specified box size. It helps to eliminate noise and allows focusing on main trends. Time is not a factor here. Only price movements are taken into account. That is why PnF chart is not synchronized with the main chart it is attached to. More about PnF charts: http://stockcharts.com/school/doku.php?id=chart_school:chart_analysis:pnf_charts Indicator wor
FREE
Crit
Yvan Musatov
The Crit indicator analyzes price behavior and, if there is a temporary weakness in the trend, you can notice this from the indicator readings, as in the case of a pronounced change in trend direction. Entering the market is not difficult, but staying in it is much more difficult. With the Crit indicator, staying on trend will become much easier! This indicator allows you to analyze historical data and, based on it, display instructions for further actions on the trader’s screen. A arrow techn
Indicator Description The indicator shows the breakout of the last fractal in real time. It considers the buy fractals above the balance line and sell fractals below the balance line (according to the Bill Williams' strategy), and also the fractals that are independent of the balance line. The direction and the distance of the fractal level breakout are displayed in real time. When a candle closes outside the suitable fractal, the levels of the specified offset, the distance to the candle closur
Этот индикатор представляет гибридный фильтр основанный на совместном использовании медианы и скользящей средней. Использование медианы позволяет отфильтровывать аномальные выбросы и случайные импульсы в значениях ценового ряда. При этом на трендовую составляющую медианный фильтр не действует, оставляя ее без изменений. Так как медианный фильтр является нелинейным, то для сглаживания его значений используется скользящая средняя. Такой подход позволяет более точно выделять не только тренд, но и п
Bu ürünün alıcıları ayrıca şunları da satın alıyor
Trend SniperX MT4
Sarvarbek Abduvoxobov
5 (5)
Trend Sniper X , işlemcilerin trend yönünü ve olası dönüş noktalarını netlik ve hassasiyetle belirlemelerine yardımcı olan MetaTrader 5 için çoklu zaman dilimli bir trend takip göstergesidir. MT5 İçin: https://www.mql5.com/en/market/product/181101 Fiyat Bilgisi: Mevcut fiyat tanıtım amaçlıdır ve gelecek güncellemeler ile yeni özellikler eklendikçe değişebilir. Code2Profit Kanalı Çoklu Zaman Dilimi Analizi ile Piyasaya Hakim Olun! Trend Sniper X ile Kazanma Oranınızı Nasıl En Üst Düzeye Çıkarırsı
AW Prime Oscillator
AW Trading Software Limited
5 (1)
İki osilatörün birleşimi. Birincisi giriş noktalarını, ikincisi ise mevcut trendi gösterir. Gösterge, osilatör sinyallerini iki modda oklarla görüntüleyebilir; tüm hızlı osilatör sinyalleri veya yalnızca mevcut trend yönündeki sinyaller. Çok zaman dilimli bir panele ve üç tür sinyal bildirimine sahiptir. Faydalar: Günlük ve scalping ticaretine uygundur Trend filtreleme Basit ve hassas kurulum Çoklu zaman dilimi paneli Bir danışmana entegrasyona uygundur. Herhangi bir sembol ve herhangi bir zaman
Super Signal – Skyblade Edition Profesyonel No-Repaint / Gecikmesiz Trend Sinyal Sistemi, Olağanüstü Kazanma Oranı ile | MT4 / MT5 için 1 dakika, 5 dakika ve 15 dakika gibi daha düşük zaman dilimlerinde en iyi şekilde çalışır. Temel Özellikler: Super Signal – Skyblade Edition, özellikle trend bazlı işlemler için geliştirilmiş akıllı bir sinyal sistemidir. Yalnızca güçlü, yönlü ve gerçek momentum destekli piyasa hareketlerini tespit etmek amacıyla çok katmanlı bir filtreleme yapısı kullanır. Bu s
SR Liquidity
Oleg Rodin
5 (2)
SR Liquidity , piyasa likiditesinin yoğunlaştığı ve fiyatın en güçlü tepkiyi verdiği gizli bölgeleri ortaya çıkarmak için tasarlanmış bir alım-satım göstergesidir. Bu özel likidite alanları güçlü destek ve direnç seviyeleri işlevi görerek, piyasanın yön değiştirme ihtimalinin en yüksek olduğu yerlere dair size net bir harita sunar. SR Liquidity, sıradan Destek/Direnç çizgileri çizmek yerine, alım ve satım baskısının yoğunlaştığı bölgeleri tespit etmek için gerçek fiyat hareketlerini analiz eder.
M1 Sniper
Oleg Rodin
4.97 (30)
M1 SNIPER kullanımı kolay bir işlem göstergesi sistemidir. M1 zaman dilimi için tasarlanmış bir ok göstergesidir. Gösterge, M1 zaman diliminde scalping için bağımsız bir sistem olarak kullanılabilir ve mevcut işlem sisteminizin bir parçası olarak kullanılabilir. Bu işlem sistemi özellikle M1'de işlem yapmak için tasarlanmış olsa da, diğer zaman dilimleriyle de kullanılabilir. Başlangıçta bu yöntemi XAUUSD ve BTCUSD ticareti için tasarladım. Ancak bu yöntemi diğer piyasalarda işlem yaparken de ya
Atomic Analyst
Issam Kassas
5 (14)
Atomic Analyst — MetaTrader 4 Ürün soruları, kurulum rehberliği veya teknik destek için bana doğrudan MQL5 üzerinden mesaj gönderin. İndikatör, karmaşık piyasa hesaplamalarını basit görsel sinyallere, renk kodlu mumlara, trend okumalarına, stop-loss seviyelerine ve traderların hızlıca anlayıp gerçek piyasa koşullarında kullanabileceği çoklu take-profit bölgelerine dönüştürür. Ana trading kullanım alanları: Scalping ve gün içi işlem: Hızlı karar alma, net oklar, uyarılar, mum renkleri ve yapılan
Smart Trend Trading System, trend bilgilerini, giriş ve çıkış sinyallerini ve fiyat seviyelerini tek bir grafikte birleştiren bir MetaTrader 4 göstergesidir. Trend tespiti, dönüş bölgeleri, Smart Cloud, trailing stop mantığı, destek ve direnç, mum renklendirme, uyarılar ve çoklu zaman dilimi analizi dahil olmak üzere 10’dan fazla trading aracını tek bir sistemde birleştirir. Sistem, farklı piyasa koşullarında işlem yapmanıza yardımcı olmak için tasarlanmıştır: Trend piyasaları: Ana trendi belir
Tokyo mt4 Indicator
Vasiliy Strukov
5 (9)
Tokyo Indicator; trend yönü, potansiyel işlem sinyalleri ve piyasa koşulları hakkında net ve görsel bir genel bakış sunar. Renk kodlu ve kademeli trend çizgisi, yükseliş evrelerini (mavi) düşüş evrelerinden (macenta) ayırt eder. Trend değiştiğinde, buna karşılık gelen yön okları potansiyel alım ve satım fırsatlarını vurgular. Entegre bir panel; mevcut sinyali, piyasa eğilimini, momentumu, volatiliteyi ve sinyal kalitesini tek bir kullanışlı görünümde bir araya getirir. Bu sayede yatırımcılar, f
Currency Strength Wizard , başarılı ticaret için size hepsi bir arada çözüm sağlayan çok güçlü bir göstergedir. Gösterge, birden çok zaman dilimindeki tüm para birimlerinin verilerini kullanarak şu veya bu forex çiftinin gücünü hesaplar. Bu veriler, şu veya bu para biriminin gücünü görmek için kullanabileceğiniz, kullanımı kolay para birimi endeksi ve para birimi güç hatları biçiminde temsil edilir. İhtiyacınız olan tek şey, işlem yapmak istediğiniz tabloya göstergeyi eklemektir ve gösterge size
Şu anda %30 İNDİRİMLİ! Herhangi bir Acemi veya Uzman Tüccar için En İyi Çözüm! Bu gösterge paneli yazılımı 28 döviz çifti üzerinde çalışıyor. Ana göstergelerimizden 2'sine (Gelişmiş Para Birimi Gücü 28 ve Gelişmiş Para Birimi Dürtüsü) dayanmaktadır. Tüm Forex piyasasına harika bir genel bakış sağlar. Gelişmiş Para Birimi Gücü değerlerini, para birimi hareket hızını ve tüm (9) zaman dilimlerinde 28 Forex çifti için sinyalleri gösterir. Trendleri ve / veya scalping fırsatlarını belirlemek için
Trend Lines PRO
Roman Podpora
5 (1)
TREND ÇİZGİLERİ PRO     Piyasanın gerçek yön değişimini anlamaya yardımcı olur. Gösterge, gerçek trend dönüşlerini ve büyük oyuncuların piyasaya yeniden girdiği noktaları gösterir. Anlıyorsun     BOS hatları  Daha yüksek zaman dilimlerindeki trend değişiklikleri ve önemli seviyeler, karmaşık ayarlar veya gereksiz gürültü olmadan gösterilir. Sinyaller yeniden çizilmez ve çubuk kapandıktan sonra grafikte kalır. VERSION MT 5     -    RFI LEVELS PRO  göstergesiyle birlikte kullanıldığında maksimum p
Liquidity Scalper System: gösterge formatında likiditeye dayalı bir işlem sistemi. Çoğu gösterge yalnızca bir ok gösterir; sonrasında stopun nereye konacağına, hedefin nerede olduğuna ve sinyale güvenilip güvenilmeyeceğine trader kendisi karar verir. Liquidity Scalper System işlemin tüm döngüsünü kapsar: likidite havuzlarını bulur, kırılımlarında sinyal verir, Entry, Stop Loss ve üç hedefi anında hesaplar, panelde ise istatistikleri ve yeni veriler üzerindeki doğrulama sonuçlarını gösterir. Sis
ŞU ANDA %40INDIRIMLI Yeni Başlayanlar veya Uzman Tüccarlar için En İyi Çözüm! Bu Gösterge benzersiz, yüksek kaliteli ve uygun fiyatlı bir ticaret aracıdır çünkü bir dizi tescilli özellik ve yeni bir formül ekledik. Sadece BİR grafik ile 28 Forex çifti için Döviz Gücünü okuyabilirsiniz! Yeni bir trendin veya scalping fırsatının tam tetik noktasını belirleyebildiğiniz için ticaretinizin nasıl gelişeceğini hayal edin? Kullanım kılavuzu: buraya tıklayın Bu ilk olan, orijinal! Değersiz bir özent
Advanced Supply Demand
Bernhard Schweigert
4.91 (302)
Özel Ticaret –%30 İndirim Yeni Başlayanlar veya Uzman Yatırımcılar İçin En İyi Çözüm! Bu gösterge, bir dizi özel özellik ve yeni bir formül içerdiği için benzersiz, yüksek kaliteli ve uygun fiyatlı bir işlem aracıdır. Bu güncelleme ile çift zaman dilimi bölgeleri gösterebileceksiniz. Sadece daha yüksek bir zaman dilimini değil, hem grafik zaman dilimini hem de daha yüksek zaman dilimini gösterebileceksiniz: İÇ İÇE GEÇMİŞ BÖLGELER GÖSTERİYOR. Tüm Arz Talep yatırımcıları buna bayılacak. :) Önem
Scalper Inside PRO
Alexey Minkov
4.74 (69)
Scalper Inside PRO helps you read the intraday trend and plan a trade before you enter the market. It is built around three exclusive strategies for a sharper read of the market. The moment a signal appears, the indicator evaluates market direction and calculates the key levels, so you see the potential entry, the expected stop-loss and several profit-taking levels in advance. Detailed performance statistics show how different instruments and strategies performed in history and help you pick ass
This is a professional chart indicator designed for traders focused on stability and clear price action. It helps filter market noise and provides clear visual entry and exit zones for your trading decisions. Core Features: Strictly Non-Repainting: The system is built with strict non-repaint logic. What you see on the chart is the true historical performance. Confirmed Signals: Signals are triggered and confirmed only after the candle closes . Once a trading arrow appears on a closed candle, it
PRO Renko Sistemi, RENKO grafikleri ticareti için özel olarak tasarlanmış son derece hassas bir ticaret sistemidir. Bu, çeşitli ticaret araçlarına uygulanabilen evrensel bir sistemdir. Sistemi etkin piyasa sana doğru ters sinyallerine erişim hakkı denilen ses nötralize eder. Göstergenin kullanımı çok kolaydır ve sinyal üretiminden sorumlu tek bir parametreye sahiptir. Aracı, seçtiğiniz herhangi bir ticaret aracına ve renko çubuğunun boyutuna kolayca uyarlayabilirsiniz. Yazılımımla karlı bir
Day Trader Master , günlük tüccarlar için eksiksiz bir ticaret sistemidir. Sistem iki göstergeden oluşmaktadır. Bir gösterge, satın almak ve satmak için bir ok işaretidir. Aldığınız ok göstergesidir. Size ikinci göstergeyi ücretsiz olarak sağlayacağım. İkinci gösterge, bu oklarla birlikte kullanılmak üzere özel olarak tasarlanmış bir trend göstergesidir. GÖSTERGELER TEKRARLAMAYIN VE GEÇ KALMAYIN! Bu sistemi kullanmak çok basittir. İki renkli bir çizgi olarak görüntülenen mevcut trend yönündeki o
Gann Made Easy
Oleg Rodin
4.82 (174)
Gann Made Easy , bay teorisini kullanarak ticaretin en iyi ilkelerine dayanan, profesyonel ve kullanımı kolay bir Forex ticaret sistemidir. WD Gann. Gösterge, Zararı Durdur ve Kâr Al Seviyeleri dahil olmak üzere doğru SATIN AL ve SAT sinyalleri sağlar. PUSH bildirimlerini kullanarak hareket halindeyken bile işlem yapabilirsiniz. Satın alma işleminden sonra, alım satım talimatlarını ve harika ek göstergeleri ücretsiz olarak almak için lütfen benimle iletişime geçin! Muhtemelen Gann ticaret yöntem
Pips Generator
Oleg Rodin
4.6 (10)
Apollo Pips Generator , trend yönünde sinyaller veren göstergedir. Gösterge, birden fazla giriş noktası sağlar, böylece her zaman kâr etmek için bir ticaret fırsatı bulabilirsiniz. Ekran görüntülerine dikkat edin. Ekran görüntüleri, Pips Generator aracını, kanal tarafından üstleri ve altları gösteren yıldız sinyalleriyle temsil edilen diğer aracımla birlikte gösterir. Bu kombinasyon, sistemi nasıl uygulayabileceğiniz konusunda size birçok yol sunar. Satın aldıktan sonra İKİNCİ GÖSTERGEMİ ÜCRETSİ
All in One package includes the  Oscillator Predictor ,  MACD Predictor ,  Thrust Scanner  and  Advanced Fibonacci  indicators which are mandatory for applying  Dinapoli  trade plans.  Please visit below links for detailed explanations of indicators. Advanced Fibonacci Indicator =>  https://www.mql5.com/en/market/product/52834 Thrust Scanner Indicator => https://www.mql5.com/en/market/product/52830 Overbought /Oversold Predictor indicator => https://www.mql5.com/en/market/product/52621 Macd P
Bir ok size al der. Obsidian Scalper Pro nereden alacağınızı, stopun nereye gideceğini, üç hedefin nerede olduğunu, riskinize göre pozisyonun ne kadar büyük olması gerektiğini ve kurulumun 100 üzerinden kaç ettiğini söyler. Her sinyal, grafiğe çizilmiş bitmiş bir işlem planı olarak gelir ve yerleşik bir istatistik penceresi son yüz planın dürüst sonucunu, güven aralıklı kazanma oranı dahil, gösterir. Her karar kapanmış bir barda verilir, yani baktığınız geçmiş, işlem yapmış olacağınız geçmişin t
GoldRush Trend Ok Sinyali GoldRush Trend Ok Sinyali göstergesi, XAU/USD'de yüksek hızlı, kısa vadeli scalperlar için özel olarak tasarlanmış hassas, gerçek zamanlı trend analizi sağlar. 1 dakikalık zaman dilimi için özel olarak tasarlanan bu araç, net giriş noktaları için yön okları gösterir ve scalper'ların değişken piyasa koşullarında güvenle hareket etmelerini sağlar. Gösterge, PRIMARY ve SECONDARY uyarı oklarından oluşur. PRIMARY sinyalleri, trend yönündeki değişikliği gösteren Beyaz ve
UR TrendExhaustion
Krzysztof Jan Debski
UR TrendTükenme   UR TrendExhaustion, parametre değerleri veya diğer kurulumlarla uğraşmak istemeyen tüccarlar için en iyi çözümdür - herkes için hem kolay hem de görsel olarak anlaşılırdır. UR TrendExhaustion kullanmanın avantajları: parametre yok Grafikte neler olup bittiğini en iyi açıklayan 3 satırınız var: Trend Tükenme Hattı, Balina Para Hattı ve Perakende Para Hattı. Arayüz, her iki uçta da (kırmızı alanlar) herhangi bir satırın tükenmesini gösterir. En iyi avantaj: Kolay ve tüm varlı
Alright. This indicator works on MT4 and is very easy to use. When you receive a signal from it, you wait for that candle with the signal to close and you enter your trade at the beginning of the next new candle. A red arrow means sell and a green arrow means buy. All arrows comes with a long dotted like for easy identification of trade signal. Are you okay with that?   100% non repaint Work All Major currency  Pair,  1 minute time frame 1 minute expire
Neuro Poseidon MT4
Daria Rezueva
4.74 (46)
Neuro Poseidon is a new indicator by Daria Rezueva. It combines precise trading signals with adaptive TP/SL levels - creating best possible trades as a result! Message me and get  Neuro Poseidon Assistant  as a gift to automize your trading process! What makes it stand out? 1. Proven profitability on all assets and timeframes 2. Only confirmed BUY and SELL signals present on the chart 3. Adaptive TP & SL levels generated by the software for each trade 4. Easy to understand - suitable for all
This indicator works on MT4 and is very easy to use. When you receive a signal from it, you wait for that candle with the signal to close and you enter your trade at the beginning of the next new candle . A red arrow means sell and a green arrow means buy. All arrows comes with Alert  like for easy identification of trade signal. Are you okay with that? 1 minute candle 1 minute expire
Scalper Vault
Oleg Rodin
5 (40)
Scalper Vault, gün içi işlemlerde istikrar yakalamak isteyen yatırımcılar için tasarlanmış, güçlü ve tam donanımlı bir alım satım sistemidir. Bu yüksek hassasiyetli gösterge; hem Forex hem de İkili Opsiyon yatırımcıları için kurumsal düzeyde analizler sunan, bağımsız ve eksiksiz bir alım satım sistemi işlevi görür. SATIN ALIM İŞLEMİNDEN SONRA BENİMLE İLETİŞİME GEÇİN; ALIM SATIM İPUÇLARIMI VE HARİKA BİR BONUSU ALIN! Tahmin yürütme zorunluluğunu ve karmaşık manuel analiz süreçlerini ortadan kaldır
Extreme Value Sniper is a detrended price indicator  Indicator finds the potential reversal levels by checking value ranges and price cycles. MT5 Version of the product :  https://www.mql5.com/en/market/product/114550 It shows the overbought and oversold levels using the average range. Overbought Levels are between 4 and 10 Oversold levels are bewtween -4 and -10 Those levels can be used as a reversal levels. Extreme Value Sniper look for some special divergence and convergence patterns to c
Introducing Volume Orderflow Profile , a versatile tool designed to help traders visualize and understand the dynamics of buying and selling pressure within a specified lookback period. Perfect for those looking to gain deeper insights into volume-based market behavior! MT5 Version -  https://www.mql5.com/en/market/product/122657 The indicator gathers data on high and low prices, along with buy and sell volumes, over a user-defined period. It calculates the maximum and minimum prices during this
Yazarın diğer ürünleri
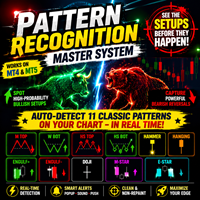
Product Overview Pattern Recognition Master System is a main‑chart classic candlestick pattern auto‑recognition indicator designed for both the   MT4 and MT5   platforms. It automatically detects and labels eleven classic reversal and continuation patterns on the main chart, covering double tops and bottoms, head‑and‑shoulders tops and bottoms, hammer and hanging man, engulfing, doji, and morning and evening stars, with an independent cooldown period assigned to each pattern category to suppres
FREE
Product Overview Dual Swing Breakout System is a dual swing breakout state machine main chart indicator designed specifically for both   MT4 and MT5   platforms. By constructing two completely independent fast and slow swing high/low tracking systems, it transforms market structure into a clear state machine model. When price breaks key swing extremes, the system changes the state line color and triggers trading signals. This indicator helps traders filter market noise, precisely identify short
FREE
Product Overview Pyramiding Entry Master is a main‑chart moving‑average trend‑following and pyramiding‑entry indicator designed for both the   MT4 and MT5   platforms. It draws a four‑period moving‑average system (MA5, MA10, MA20, MA60) on the main chart and, based on a 55‑period trend‑momentum model, volume‑expansion confirmation, and multiple oversold conditions, automatically generates three types of buy signals: Chase (halfway momentum entry), Add (next‑day pyramiding), and Dip Buy (deep‑ov
FREE
Product Overview TD Sequential Pro is a TD Sequential main chart indicator designed specifically for both   MT4 and MT5   platforms, deeply developed based on the classic Tom DeMark Sequential theory. By statistically analyzing the comparison relationship between 9 consecutive bars' closing prices and their 4 preceding bars, this indicator precisely identifies market momentum exhaustion points. It helps traders capture high-probability reversal opportunities at trend ends, while providing compr
FREE
Product Overview Dynamic Fibonacci Deviation is an adaptive Fibonacci levels main chart indicator designed specifically for both   MT4 and MT5   platforms. It innovatively combines EMA dynamic midline, standard deviation volatility, and Fibonacci ratios to construct an intelligent support/resistance system that automatically expands and contracts with market volatility. Through overbought/oversold recognition and fall back/bounce signals, this indicator helps traders accurately capture high-pro
FREE
Product Overview Pattern Recognition Master System is a main‑chart classic candlestick pattern auto‑recognition indicator designed for both the   MT4 and MT5   platforms. It automatically detects and labels eleven classic reversal and continuation patterns on the main chart, covering double tops and bottoms, head‑and‑shoulders tops and bottoms, hammer and hanging man, engulfing, doji, and morning and evening stars, with an independent cooldown period assigned to each pattern category to suppres
FREE
Product Overview TD Sequential Pro is a TD Sequential main chart indicator designed specifically for both   MT4 and MT5   platforms, deeply developed based on the classic Tom DeMark Sequential theory. By statistically analyzing the comparison relationship between 9 consecutive bars' closing prices and their 4 preceding bars, this indicator precisely identifies market momentum exhaustion points. It helps traders capture high-probability reversal opportunities at trend ends, while providing compr
FREE
Product Overview Dynamic Fibonacci Deviation is an adaptive Fibonacci levels main chart indicator designed specifically for both   MT4 and MT5   platforms. It innovatively combines EMA dynamic midline, standard deviation volatility, and Fibonacci ratios to construct an intelligent support/resistance system that automatically expands and contracts with market volatility. Through overbought/oversold recognition and fall back/bounce signals, this indicator helps traders accurately capture high-pro
FREE
Product Overview Bottom Picker Pro is a bull/bear wave sub-window indicator designed specifically for both   MT4 and MT5   platforms. By integrating multi-period extreme value algorithms with multiple smoothing techniques, it constructs a highly responsive bull/bear trend line and wave tracking system. This indicator precisely identifies momentum reversals in extremely overbought and oversold zones, providing clear bottom-picking, top-escaping, and trend-pullback signals, helping traders accura
Product Overview Pyramiding Entry Master is a main‑chart moving‑average trend‑following and pyramiding‑entry indicator designed for both the   MT4 and MT5   platforms. It draws a four‑period moving‑average system (MA5, MA10, MA20, MA60) on the main chart and, based on a 55‑period trend‑momentum model, volume‑expansion confirmation, and multiple oversold conditions, automatically generates three types of buy signals: Chase (halfway momentum entry), Add (next‑day pyramiding), and Dip Buy (deep‑ov
FREE
Product Overview Dual Swing Breakout System is a dual swing breakout state machine main chart indicator designed specifically for both   MT4 and MT5   platforms. By constructing two completely independent fast and slow swing high/low tracking systems, it transforms market structure into a clear state machine model. When price breaks key swing extremes, the system changes the state line color and triggers trading signals. This indicator helps traders filter market noise, precisely identify short
FREE
Dynamic Trend Follower Main Chart Indicator Deep Analysis: Dual MA Color Change + Cross Markers + Buy/Sell Signals + Trend Reversal + Strong Cross Indicator Overview Dynamic Trend Follower is a premium main chart moving average crossover composite signal indicator designed exclusively for the   MT4 、5platform . It breaks through the limitations of traditional single moving averages or simple crossovers by integrating a   Dual MA Trend Color Change System ,   Cross "+" Markers with Spread Percen
FREE
Product Overview Liquidity Pool Hunter is a liquidity pool main chart indicator designed specifically for both   MT4 and MT5   platforms. Based on institutional order flow theory, it constructs liquidity accumulation zones by statistically analyzing recent highs and lows, precisely identifying sweep, fake break, and true break behaviors in the market. This indicator helps traders view the market from an institutional perspective, recognizing smart money liquidity hunting behavior, thereby captu
Reasonable Indicators, Reasonable Prices 1. Core Functions   Multi-Period Resonance : Uses   13, 34, 55   period KDJ for signal filtering.   Gap Up Capture : Identifies   Gap Up   patterns for strong start entries.   Reversal Warning : Predicts tops/bottoms using   J-value   sensitivity. 2. Signal Description   Buy Signal 1: UP (Gap Up) Displays white   “UP”   text. Indicates a   Gap Up   bullish candle above   MA5 . Shows strong   bullish power , suitable for   trend following .
FREE
Smart Divergence Finder Indicator In-depth Analysis: A Practical Guide to Trend, Divergence, and Resonance Indicator Introduction Smart Divergence Finder is an intelligent main-chart comprehensive indicator designed for MT4/MT5 platforms. It overcomes the fragmented limitations of traditional sub-chart divergence analysis by integrating: Trend determination Multi-indicator divergence detection Intelligent signal filtering All key trading signals are displayed directly on the price chart. Its co
Dynamic Trend Follower Main Chart Indicator Deep Analysis: Dual MA Color Change + Cross Markers + Buy/Sell Signals + Trend Reversal + Strong Cross Indicator Overview Dynamic Trend Follower is a premium main chart moving average crossover composite signal indicator designed exclusively for the   MT4 platform . It breaks through the limitations of traditional single moving averages or simple crossovers by integrating a   Dual MA Trend Color Change System ,   Cross "+" Markers with Spread Percenta
FREE
Smart Divergence Finder Indicator In-depth Analysis: A Practical Guide to Trend, Divergence, and Resonance Indicator Introduction Smart Divergence Finder is an intelligent main-chart comprehensive indicator designed for MT4/MT5 platforms. It overcomes the fragmented limitations of traditional sub-chart divergence analysis by integrating: Trend determination Multi-indicator divergence detection Intelligent signal filtering All key trading signals are displayed directly on the price chart. Its co
Black Horse Finder Indicator In-depth Analysis: A Practical Guide to Trend, Support/Resistance, and Multi-Signal Trading Indicator Introduction Black Horse Finder is a comprehensive main-chart indicator designed specifically for the MT4 platform. Originating from the classic TongDaXin composite main chart logic, it breaks through the limitations of single moving averages or isolated indicators. It highly integrates trend determination, dynamic support/resistance levels, multiple buy signals (su
Channel Breakout Master: A Comprehensive Guide to Dual-Channel Trend Analysis with Weighted High-Low EMA and Trend State Identification Introduction Channel Breakout Master is an advanced chart indicator originally derived from the Tongdaxin SLTD series, specifically designed for both MT4 and MT5 platforms. This indicator transcends the limitations of traditional single Bollinger Bands or moving average channels by implementing a sophisticated dual-channel architecture combining   Weighted High-
Ultimate Signal Hub Main Chart Indicator Deep Analysis: MA60 Trend Baseline, Momentum Ignition & Multi-Layer Resonance Trading Guide Indicator Overview Ultimate Signal Hub is a premium main chart composite signal indicator designed exclusively for the   MT4/MT5 platform . It breaks through the limitations of traditional single moving averages or oscillators by integrating a multi-dimensional nested architecture comprising the   MA60 Trend Baseline ,   MACD Variant Ignition Algorithm ,   KDJ-Typ
Product Overview Bull Bear Decision Maker is an all-in-one main chart trend and reversal decision indicator designed specifically for both   MT4 and MT5   platforms. Originating from the classic NXMMA trading system, it deeply integrates Williams %R variants, KDJ, RSI, and a multiple moving average system. Through multi-dimensional algorithmic resonance, this indicator helps traders accurately identify high-probability trend-following, bottom-reversal, and top-escaping opportunities in complex
Product Overview Channel State Analyzer is a trend channel main chart indicator designed specifically for both   MT4 and MT5   platforms. It integrates linear regression slope trend lines, weighted channels, 55-period high/low monitoring, and channel state recognition. Through the combination of dynamic channels and trend lines, this indicator helps traders accurately identify trend reversals, channel breakouts, and short-term bottom opportunities in complex markets, while providing comprehensi
Product Overview Auto Trend Bands is an adaptive trend channel main chart indicator designed specifically for both   MT4 and MT5   platforms. It dynamically constructs trend channels based on linear regression algorithms and standard deviation, automatically identifying market trend direction and changing colors in real-time based on slope changes. Through channel breakout signals and strong trend markers, this indicator helps traders accurately capture trend initiation and acceleration opportu
Product Overview Color Trend Master is a multi-layer WMA smoothed trend line main chart indicator designed specifically for both   MT4 and MT5   platforms. Based on the classic MavilimW algorithm, it constructs an extremely smooth yet responsive trend-following system through 6 layers of nested Fibonacci-period Weighted Moving Average calculations. This indicator precisely identifies trend turning points and helps traders clearly grasp trend direction and momentum strength in complex markets th
Product Overview 6in1 Confluence System is a multi-indicator resonance sub-window indicator designed specifically for both   MT4 and MT5   platforms. It innovatively integrates 6 classic technical indicators—MACD, KDJ, RSI, LWR, BBI, and MTM—into a single sub-window, displaying bull/bear power comparison in real-time through a visual dot matrix. When all 6 indicators point in the same direction simultaneously, the system issues high-probability resonance signals, helping traders quickly identif
Product Overview Triple Divergence Hunter is a multi-indicator divergence detection sub-window indicator designed specifically for both   MT4 and MT5   platforms. It deeply integrates three classic momentum indicators—MACD, KDJ, and RSI—using rigorous crossover and extreme value comparison algorithms to precisely capture top and bottom divergences between price and indicators. Additionally, the indicator features a built-in custom K88/D88 momentum trend system, helping traders identify reversal
Product Overview Five Dimension Resonance System is a five-dimensional resonance trading main chart indicator designed specifically for both   MT4 and MT5   platforms. It innovatively integrates 5 independent trading systems—trend following, volatility breakout, range breakout, divergence reversal, and momentum scoring—into one unified framework. Through a strict resonance filtering mechanism, high-probability resonance entry alerts are triggered only when at least 2 out of the 5 systems simult
Product Overview Peak Valley Hunter (HZ88) is a comprehensive main chart trend-following and swing reversal indicator designed specifically for both   MT4 and MT5   platforms. By constructing a triple composite moving average system (Trade Line and Trend Line), combined with dynamic support/resistance tracking algorithms and candlestick pattern recognition technology, it provides traders with comprehensive trading signals ranging from trend confirmation and momentum explosion to local reversals
Product Overview Multi Dimensional Bottom Finder is an advanced sub-window oscillator and multi-dimensional resonance indicator designed specifically for both   MT4 and MT5   platforms. Breaking through the limitations of traditional single KDJ or RSI indicators, it constructs a highly in-depth bottom-hunting system by integrating multi-period stochastic oscillator algorithms, CCI extreme value analysis, volume anomaly detection, and bias rate recovery models. This indicator keenly captures mom
Product Overview MACD Trend Visualizer System is a main‑chart MACD trend visualization and bullish/bearish switching indicator designed for both the   MT4 and MT5   platforms. It draws a four‑period moving‑average system (MA5, MA10, MA30, MA60) on the main chart, internally calculates the MACD histogram value, and fuses three conditions — MACD bullish/bearish momentum, moving‑average alignment, and price position — to automatically determine whether the current market is in a bullish or bearish
Filtrele:
Değerlendirme yok
Değerlendirmeye yanıt