T3 MTF PureMaths Plus
- Göstergeler
- Sürüm: 4.0
- Etkinleştirmeler: 5

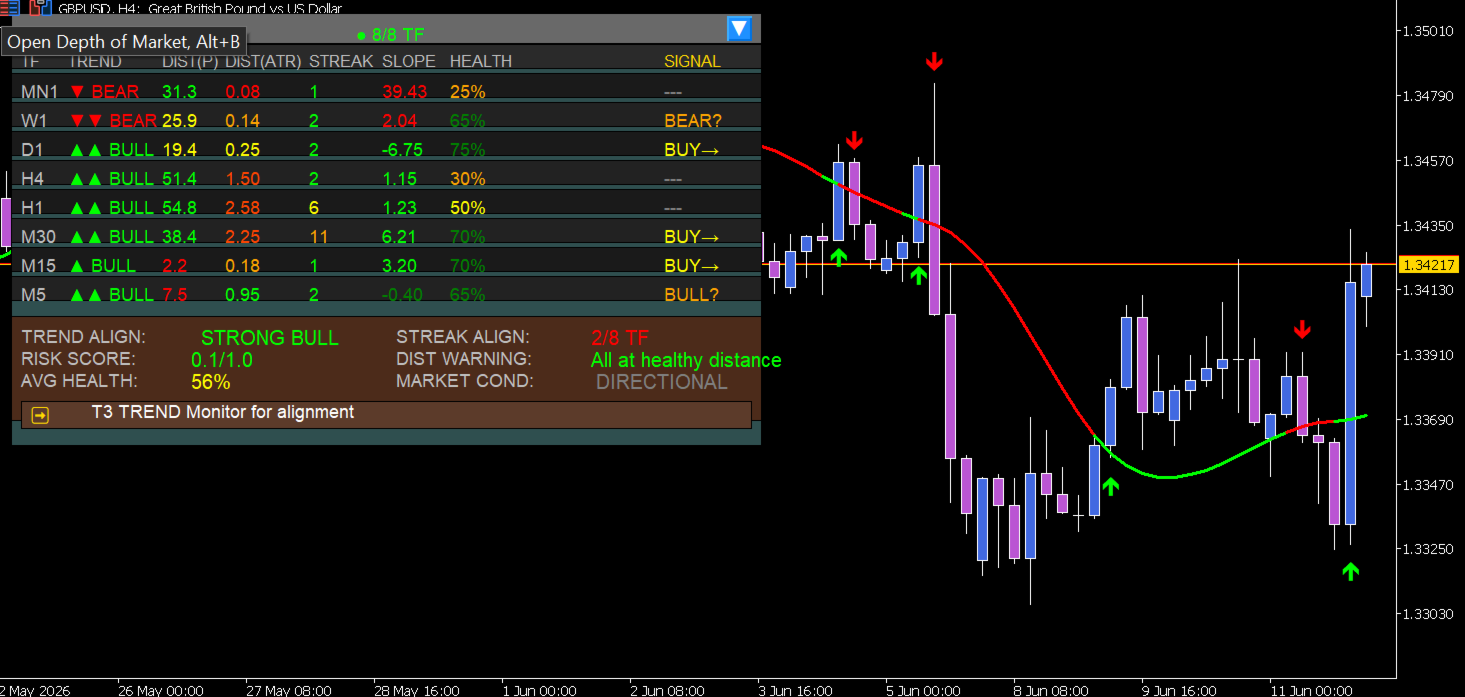
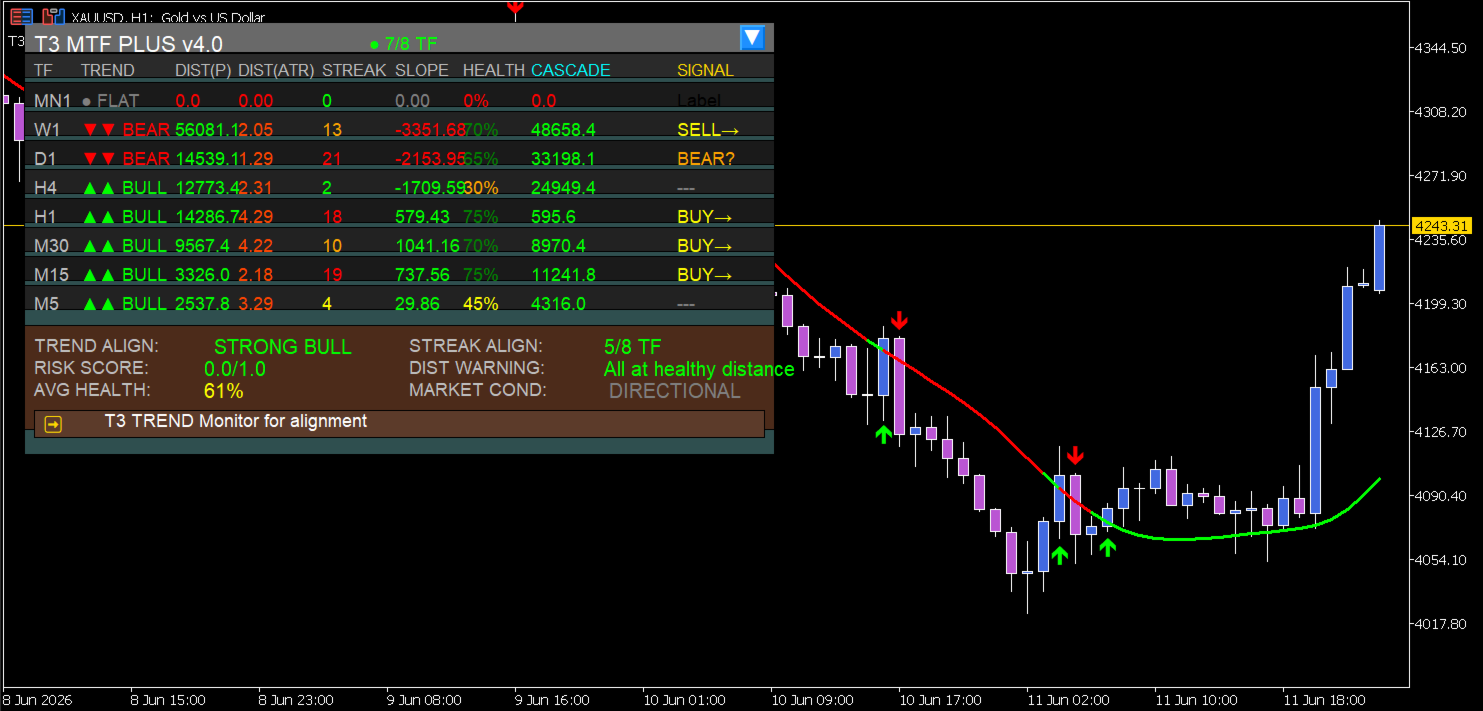
One Glance. Eight Timeframes. Complete T3 Trend Analysis. EA-Ready.
T3 MTF PureMaths Plus transforms your chart into a professional T3 analysis command centre. No more switching between timeframes or guessing trend strength. See every T3 direction PLUS distance metrics, streak analysis, cascade divergence, and actionable insights – all on one ultra-clean, CPU-optimized MT5 display.
What It Answers in Seconds
| Question | How It Answers |
|---|---|
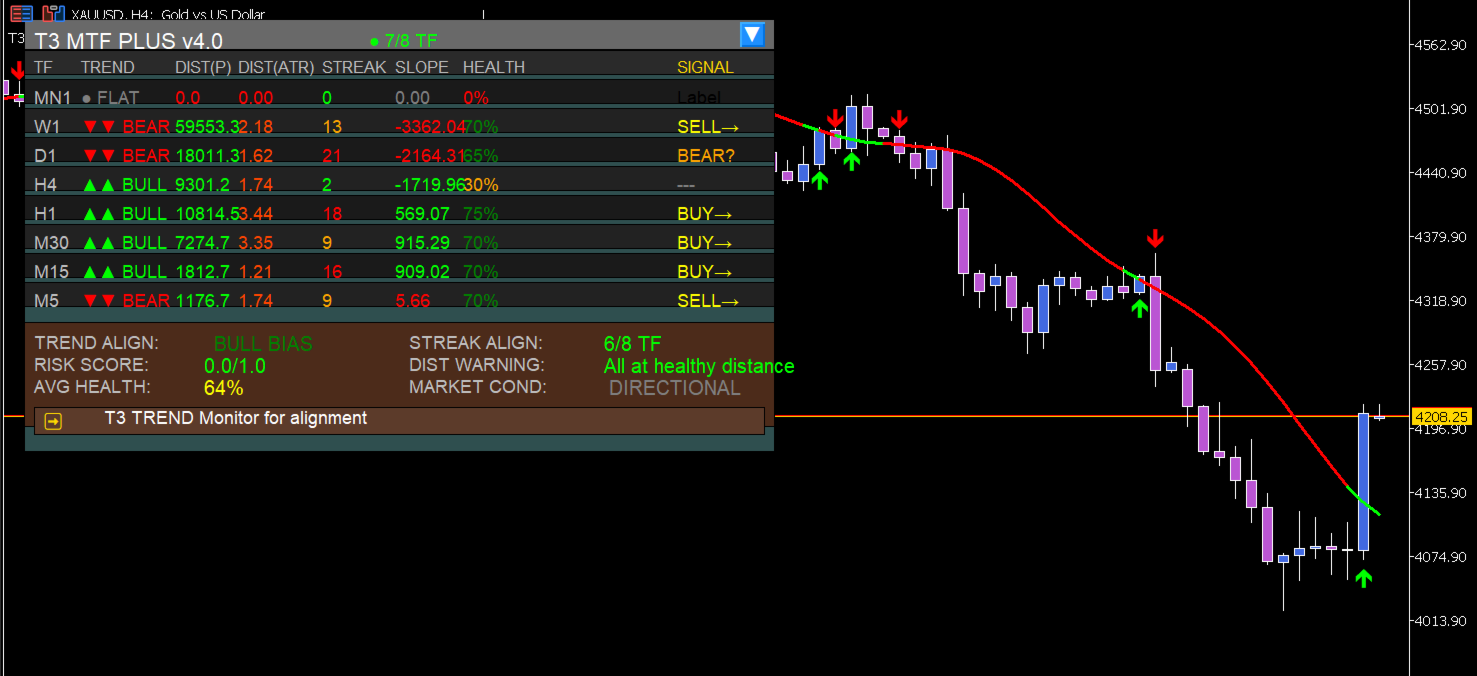
| Is MN1 bullish or bearish? | ▲▲ BULL (Green) / ▼▼ BEAR (Red) |
| Do all timeframes agree? | Dashboard shows all 8 timeframes at once |
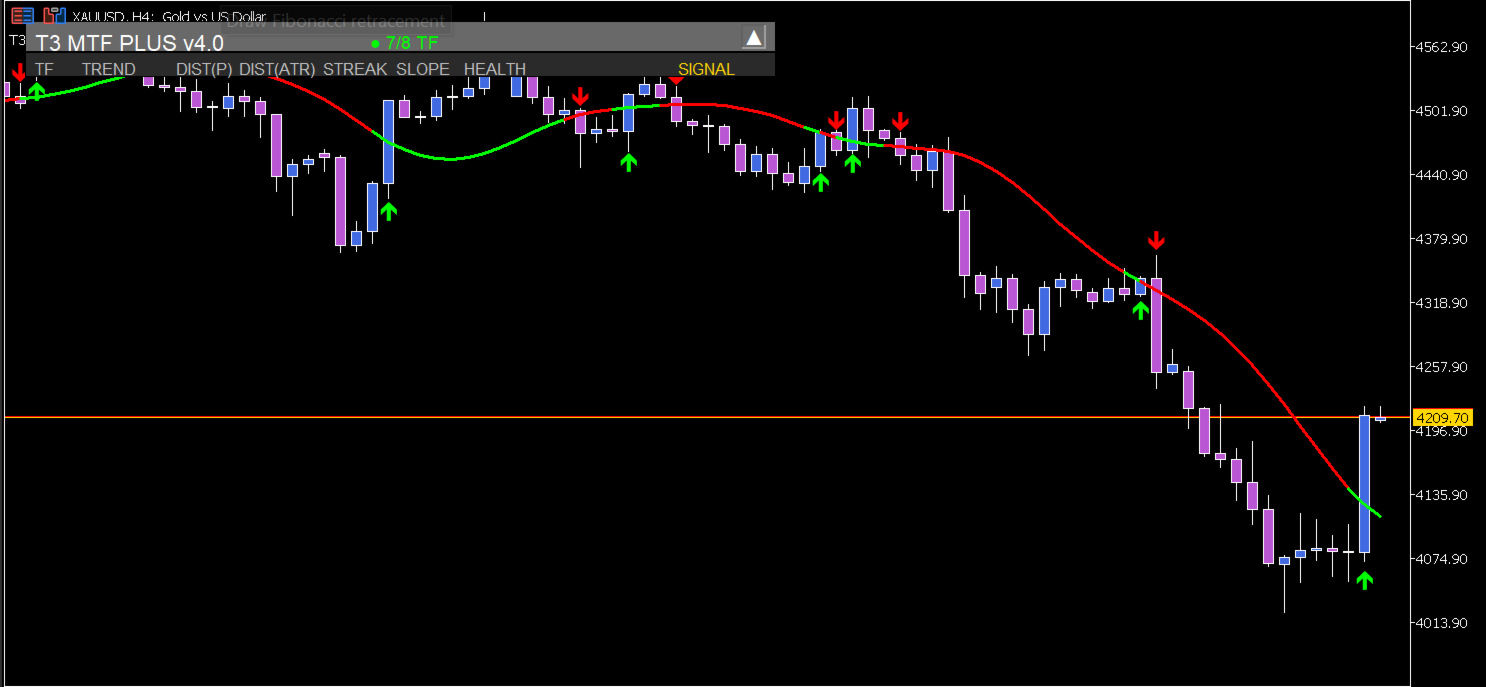
| When should I enter? | Graphical arrows plot when T3 changes direction |
| Is this a pullback or reversal? | Trend TFs (MN1–H4) separate from Entry TFs (H1–M5) |
| How far is price from T3? | DIST(P) column – distance in pips |
| Is the trend healthy or extended? | DIST(ATR) column – normalized by volatility |
| How long has this trend lasted? | STREAK column – consecutive bars on same side |
| Is momentum accelerating or dying? | SLOPE column – T3 steepness in pips/bar |
| What's the overall trend quality? | HEALTH column – 0-100% composite score |
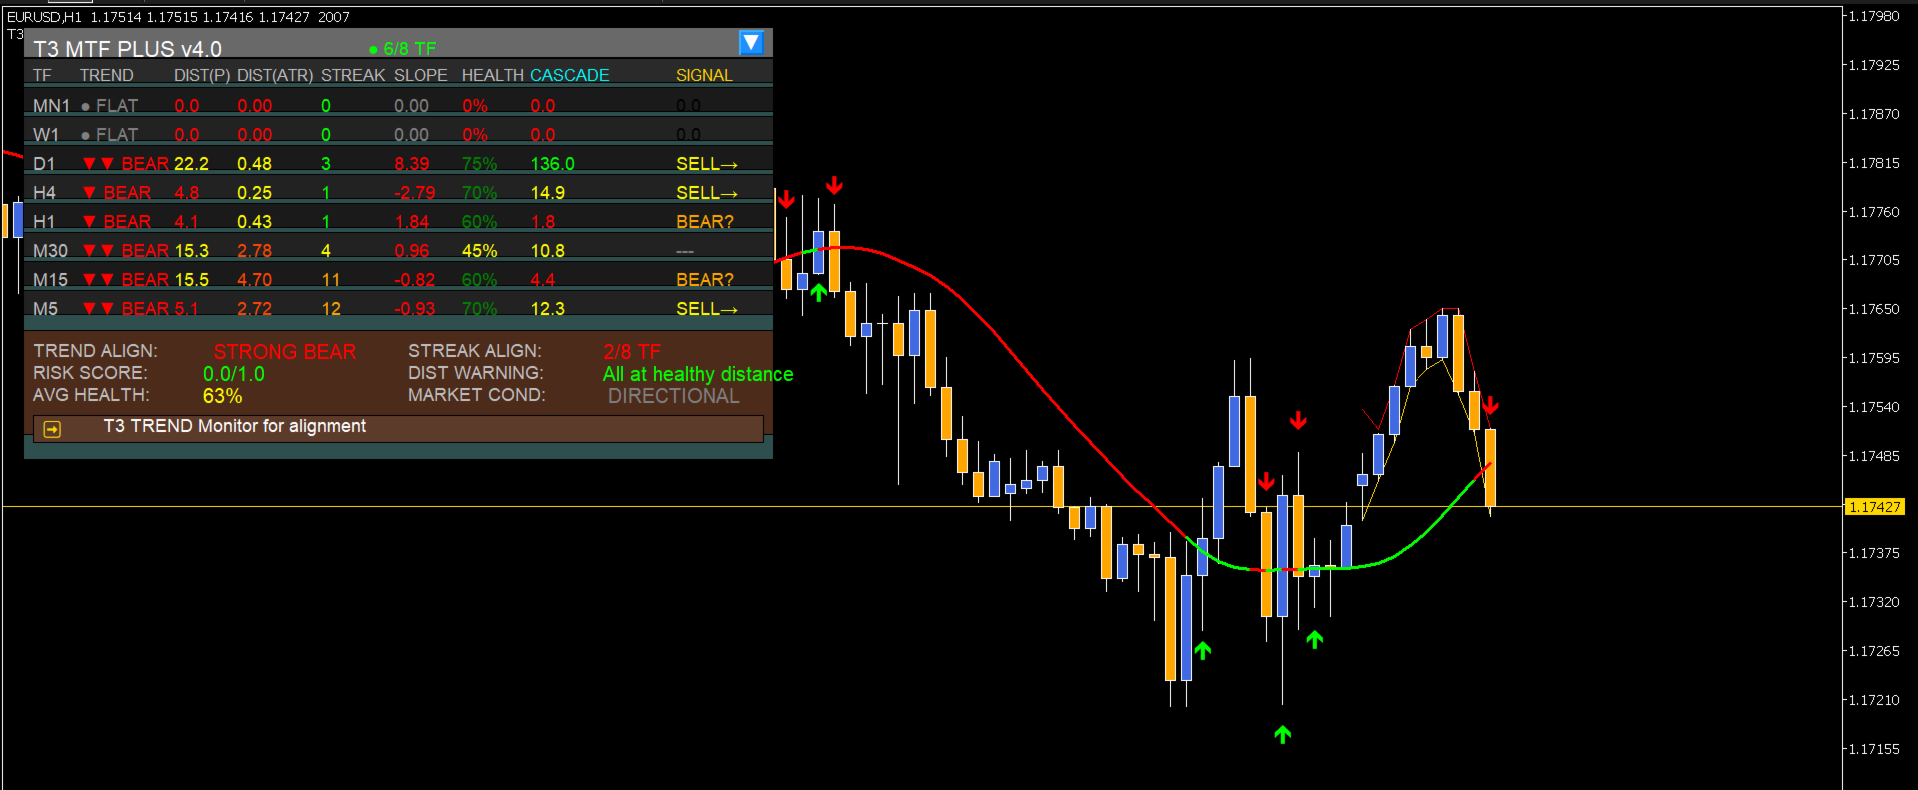
| How strong is underlying momentum? | CASCADE column – divergence between EMA1 and EMA6 |
| Should I enter now or wait? | SIGNAL column – Strong(✓), Moderate(→), or Weak(?) |
| What's the overall bias? | Smart Weighted: STRONG BUY / BUY / BULLISH BIAS / WAIT |
| What's my risk level? | RISK SCORE – 0.0 to 1.0 quantitative assessment |
| Is the market trending or choppy? | MARKET CONDITION – TRENDING / DIRECTIONAL / CHOPPY |
| What should I do right now? | ACTIONABLE INSIGHT – Clear trading recommendation |
| Can my EA use this? | Yes – 4 signal buffers fully exposed |
What Each Column Tells You
| Column | Question It Answers | Healthy Range | Warning Signal |
|---|---|---|---|
| TREND | Is T3 rising or falling? | ▲▲ BULL / ▲ BULL | ▼▼ BEAR / ▼ BEAR |
| DIST(P) | How far from T3 in pips? | 8-30 pips | <8 = too tight, >30 = extended |
| DIST(ATR) | Is distance normalised for volatility? | 0.2-0.6x ATR | <0.1x = choppy, >1.0x = extended |
| STREAK | How long has this trend lasted? | 8-20 bars | 1 bar = fresh, 30+ = mature |
| SLOPE | Is momentum accelerating? | 0.3-1.0 pips/bar | <0.05 = dying, >1.0 = accelerating |
| HEALTH | What's overall trend quality? | 60-100% | <40% = weak, avoid |
| CASCADE | How strong is underlying momentum? | 10-20 pips | <5 = ranging, >20 = extreme |
| SIGNAL | Should I consider entry? | ✓ Strong / → Moderate | ? Weak / --- None |
Understanding CASCADE Divergence (T3's Unique Feature)
CASCADE answers: "How strong is the underlying momentum driving this trend?"
T3 is built from 6 cascading EMAs. CASCADE measures the divergence between the fastest layer (EMA1) and slowest layer (EMA6).
| Value | Color | Interpretation |
|---|---|---|
| <5 pips | 🔴 Red | Weak/ranging – avoid trend trades |
| 5-10 pips | 🟠 Orange | Moderate – trend developing |
| 10-20 pips | 🟡 Yellow | Significant – strong trend confirmed |
| >20 pips | 🟢 Lime | Extreme – strong trend, monitor for compression |
Most powerful signal: When CASCADE is decreasing (compressing) while price continues in the same direction → momentum divergence, reversal likely.
Actionable Insights – What They Mean
| Insight | What It Tells You |
|---|---|
| T3 TREND CONFIRMED – Consider entries | High conviction setup across multiple timeframes |
| TOO TIGHT – Await expansion | Price too close to T3, high reversal risk |
| CASCADE COMPRESSING – Reversal warning | Momentum dying, tighten stops |
| STRONG CASCADE – Let trend run | Healthy momentum, manage existing positions |
| LOW CASCADE ACROSS TFs – Range expected | Market lacks direction, avoid trend strategies |
| CONFLICTED TIMEFRAMES – Wait | No clear consensus, stay on sidelines |
Why Traders Use It
Engineered for MT5 Expert Advisors
Call indicator data directly from your automated strategies using native MT5 handles:
Initialize in EA's OnInit() int t3Handle = iCustom(_Symbol, _Period, "T3 MTF PureMaths Plus", 12, 0.7, true); // Read trend direction (Buffer 1) double trendDirection[]; ArraySetAsSeries(trendDirection, true); CopyBuffer(t3Handle, 1, 0, 1, trendDirection); // Returns: 0 = Bullish, 1 = Bearish
Strategy Tester Verified
Recalculates every tick. What you see in backtests matches live execution perfectly. No lag, no repainting.
Hyper CPU-Efficient Design
-
User-toggleable columns – only calculate what you enable
-
Timer-based dashboard updates – configurable refresh rate
-
Objects created once – never recreated, only updated
-
Smart throttling – MTF data refreshes at 1-second intervals
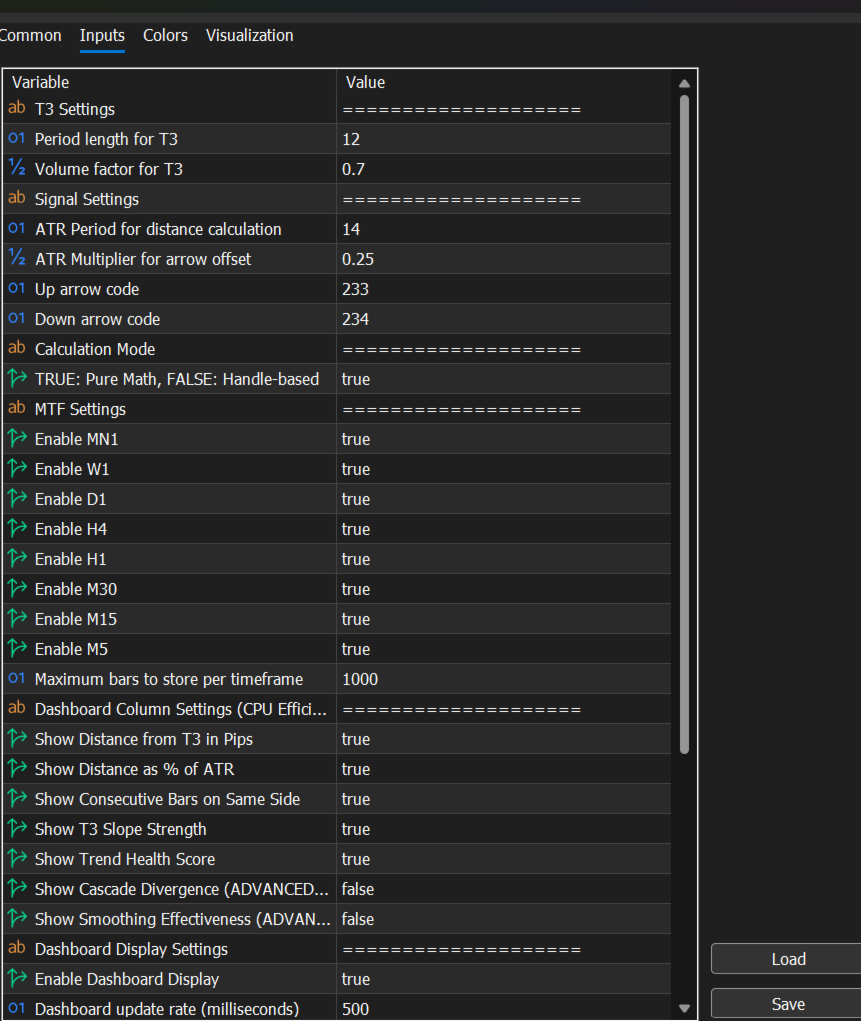
Technical Specifications
| Specification | Detail |
|---|---|
| Platform | MT5 |
| Timeframes | MN1, W1, D1, H4, H1, M30, M15, M5 |
| T3 Settings | Length (default 12), Factor (default 0.7) |
| Indicator Type | Interactive Chart Overlay + Sidebar Dashboard |
| Core Engine | Pure Math (faster) OR Handle-based |
| Max Bars | Configurable (default 1,000) |
| Dashboard Update Rate | Configurable (default 500ms) |
| EA Integration | Buffers 0, 1, 2, 3 exposed sequentially |
| User-Configurable Columns | Show/hide any column for CPU efficiency |
Quick Reference Card
DASHBOARD VALUES:
| Symbol | Meaning |
|---|---|
| ▲▲ BULL | Strong Bull – 2+ bars above T3 |
| ▲ BULL | Bull – just crossed above T3 |
| ● FLAT | Neutral – price at T3 |
| ▼ BEAR | Bear – just crossed below T3 |
| ▼▼ BEAR | Strong Bear – 2+ bars below T3 |
COLUMN LEGEND:
| Column | Healthy Range | Warning |
|---|---|---|
| DIST(P) | 8-30 pips | <8 = too tight, >30 = extended |
| DIST(ATR) | 0.2-0.6x | <0.1 = choppy, >1.0 = extended |
| STREAK | 8-20 bars | 1 = fresh, 30+ = mature |
| SLOPE | 0.3-1.0 | <0.05 = dying, >1.0 = accelerating |
| HEALTH | 60-100% | <40% = weak, avoid |
| CASCADE | 10-20 pips | <5 = ranging, >20 = extreme |
| SIGNAL | ✓ / → / ? | Strong / Moderate / Weak |
NATIVE EA BUFFERS:
| Buffer | Data |
|---|---|
| Buffer 0 | Real-time T3 value |
| Buffer 1 | 0 = BULLISH / 1 = BEARISH |
| Buffer 2 | Buy arrow price (or EMPTY_VALUE) |
| Buffer 3 | Sell arrow price (or EMPTY_VALUE) |
ON-CHART REVERSAL ARROWS:
| Arrow | Trigger |
|---|---|
| Buy ↑ | Price crosses above T3 |
| Sell ↓ | Price crosses below T3 |
CPU OPTIMIZATION TIPS:
-
Disable columns you don't need via input parameters
-
Cascade and other advanced columns off by default
-
Increase DashboardUpdateRate for slower systems (1000ms+)
-
Enable only the timeframes you actively monitor
Questions or Support? ebrah.ssali@nnanda.com