DiNapoli DMAs pro
- Göstergeler
-
Vito Bijac
 Professional trader and indicator developer with a focus on DiNapoli methodology and leading price action tools. I build indicators that get ahead of the market — not ones that explain what already happened.
 - Sürüm: 1.0
- Etkinleştirmeler: 5
DiNapoli DMA — Displaced Moving Average Indicator (3x3 | 5x5 | 7x5)
Short Summary:
Trade with the precision of institutional-level trend analysis. The DiNapoli DMA indicator brings John DiNapoli's battle-tested Displaced Moving Average methodology directly to your MT5 charts — clean, configurable, and built for traders who demand clarity over noise.
What Is the DiNapoli DMA Indicator?
John DiNapoli is a globally recognized trading author and analyst, best known for his work on Fibonacci trading and Displaced Moving Averages. His DMA approach is not a gimmick — it has been taught in professional trading seminars across 35+ countries and is described in his widely respected book "Trading with DiNapoli Levels."
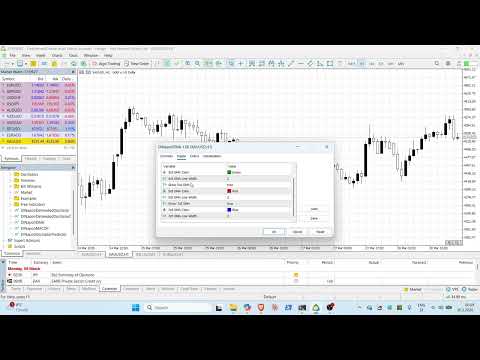
This indicator faithfully implements his three core DMA lines:
| Line | Period | Displacement | Default Color |
| 3x3 DMA | 3 | 3 bars forward | Green |
| 5x5 DMA | 5 | 5 bars forward | Red |
| 7x5 DMA | 7 | 5 bars forward | Blue |
Each line is forward-displaced, meaning the MA is projected ahead on the chart. This gives the trader a predictive visual bias rather than a lagging confirmation signal — a subtle but critical difference.
What Does It Do?
- Identifies trend direction with reduced lag compared to standard MAs
- Shows dynamic support and resistance zones where price interacts with displaced averages
- Highlights momentum shifts when price crosses or compresses between DMA lines
- Helps time entries and exits by reading the spacing and slope of the three lines
When all three DMAs are sloping in the same direction and price is riding above (or below) all of them, DiNapoli considered that a high-confidence trend environment. When they converge or flatten, it signals caution and potential reversal.
Who Is This For?
This indicator is designed for:
Swing traders looking for clean trend-following signals across daily and H4 charts
Day traders using M15–H1 who want institutional-style MA logic without the clutter
DiNapoli methodology students who want a faithful digital implementation of his DMA framework
Price action traders who want moving average context without relying on it as a sole signal
Forex, indices, commodities, and crypto traders — works on any instrument and timeframe
Full Feature List
- ✔ Three DiNapoli DMA lines: 3x3, 5x5, and 7x5
- ✔ Choose between SMA or EMA as the base calculation — your preference, your strategy
- ✔ Toggle each line on/off independently — declutter your chart without removing the indicator
- ✔ Custom color picker for each line — adapts to any chart theme
- ✔ Adjustable line width for visual clarity on any screen size
- ✔ Works on all timeframes and all instruments available in MT5
- ✔ Lightweight — no repainting, no complex calculations dragging your terminal
How to Use It
Trend Confirmation: When all three DMAs are aligned and moving in the same direction, look for trades in that direction only. Price pulling back to touch the 3x3 or 5x5 from above (in an uptrend) often provides a low-risk entry.
Caution Zones: When the DMAs are flat, tangled, or crossing each other, the market is in consolidation. DiNapoli advised standing aside during these conditions.
Exit Signals: A decisive close on the opposite side of all three DMAs is often a signal that the trend has changed character.
Final Word
If you've read DiNapoli's work or attended any of his seminars, you already know the value of this approach. If you're new to it — this is one of the most respected non-Fibonacci tools in professional technical analysis, and now it's one click away on your chart.
Trade the trend. Trust the displacement. Think like DiNapoli.