DiNapoli Detrended Oscillator pro
- Göstergeler
-
Vito Bijac
 Professional trader and indicator developer with a focus on DiNapoli methodology and leading price action tools. I build indicators that get ahead of the market — not ones that explain what already happened.
 - Sürüm: 1.2
- Etkinleştirmeler: 5
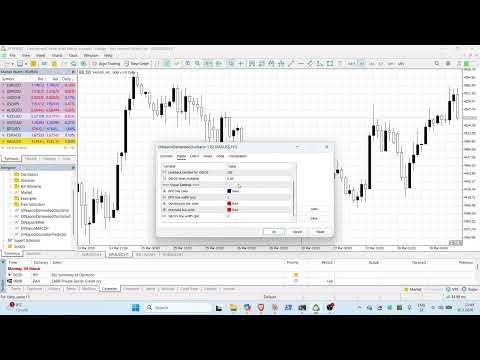
DiNapoli De-Trended Oscillator
Know Where The Cycle Is — Before The Crowd Does
IN SHORT:
The DiNapoli De-Trended Oscillator removes the trend from price and shows you pure momentum cycles. Its dynamic Overbought and Oversold lines recalculate on every candle close — always reflecting the true extremes of the current market, never a fixed arbitrary level that stopped being relevant three sessions ago.
The indicator automatically calculates OB/OS levels by settings the user specifies, usually you have to do this manually!
You have drawn the line at 70. You have drawn the line at 30.
Every oscillator on your platform has fixed overbought and oversold levels baked in. RSI hits 70 and you think overbought. It hits 30 and you think oversold. Except in a trending market RSI sits above 70 for days and every short you took got stopped out. In a quiet ranging session it barely moves and you miss every genuine reversal because it never reached the level.
Fixed levels are a lie the market tells you. They worked on the chart that was used to sell you the indicator. They stopped working the moment you applied them to real current conditions.
Joe DiNapoli understood this. His De-Trended Oscillator does not just measure momentum — it removes the trend entirely, isolating the pure cyclical movement of price so you can see exhaustion and recovery without trend noise distorting the picture. And instead of fixed overbought and oversold lines, it calculates where those extremes actually are right now — on every single candle close — based on the real recent behavior of the market you are trading.
Here is exactly how the dynamic levels work:
On every candle close the indicator scans the last N candles — 180 by default, fully adjustable — and finds the three highest highs and the three lowest lows within that range. It averages those three highs and multiplies by a scaling factor to define the true overbought extreme. It does the same with the three lowest lows for the oversold extreme. The result is two levels that reflect where this specific market, on this specific instrument, at this specific time, genuinely reaches exhaustion. It also excludes the current price from the calculation so the indicator gives correct OB/OS lines and does not just extend them with current price if it is at a extreme currently.
A quiet session produces tight levels. A volatile trending session produces wide levels. A market transitioning between regimes adjusts automatically. You never have to manually recalibrate anything.
What your chart looks like with this indicator: A clean oscillator line in a separate subwindow below your chart — deep blue, smooth, and readable. Above and below it sit two dashed red lines that define the current overbought and oversold zones. Those lines are never static. Watch them across a session and you will see them breathe with the market. When the oscillator touches them, it means something — because they were calculated from actual recent price behavior, not decided by a textbook.
What makes it different: Standard oscillators with fixed levels give you the same signal in every market condition. This system gives you a calibrated signal — one that has already accounted for current volatility, current range, and current market character before it fires. That is the difference between a blunt instrument and a precision tool.
This is not a black box. The OB and OS calculation is fully transparent — three highest highs averaged and scaled, three lowest lows averaged and scaled. You can verify every level manually. The oscillator itself is built on DiNapoli's published displaced MACD methodology. Nothing hidden, nothing proprietary beyond the implementation.
Who this is for: You use oscillators to time your entries and exits. You have been burned by RSI or MACD signals that fired at fixed levels but went nowhere because the market was trending or ranging in a way that made those levels meaningless. You want an oscillator that adapts to current conditions automatically so you stop getting false signals in trending markets and missing real ones in quiet markets.
Key features:
- De-trended oscillator built on DiNapoli's methodology
- Dynamic OB and OS lines that recalculate on every single candle close
- OB = average of 3 highest highs in lookback period × adjustable multiplier
- OS = average of 3 lowest lows in lookback period × adjustable multiplier
- No historical trail on OB/OS — lines always show only current relevant levels
- Lookback period and multiplier fully customizable
- All colors and line widths customizable
- Plots in a clean separate subwindow with zero chart clutter
- Works on every instrument and every timeframe
- Zero repainting
For the complete DiNapoli system — see the MACDP pro & DMAs pro. The Oscillator pairs naturally with them as your cycle timing tool while the MACDP pro, DMAs pro give you the trend direction to trade.
Your oscillator should reflect the market you are trading today — not the market someone backtested it on ten years ago.