Pivot Profile

Pivot Profile

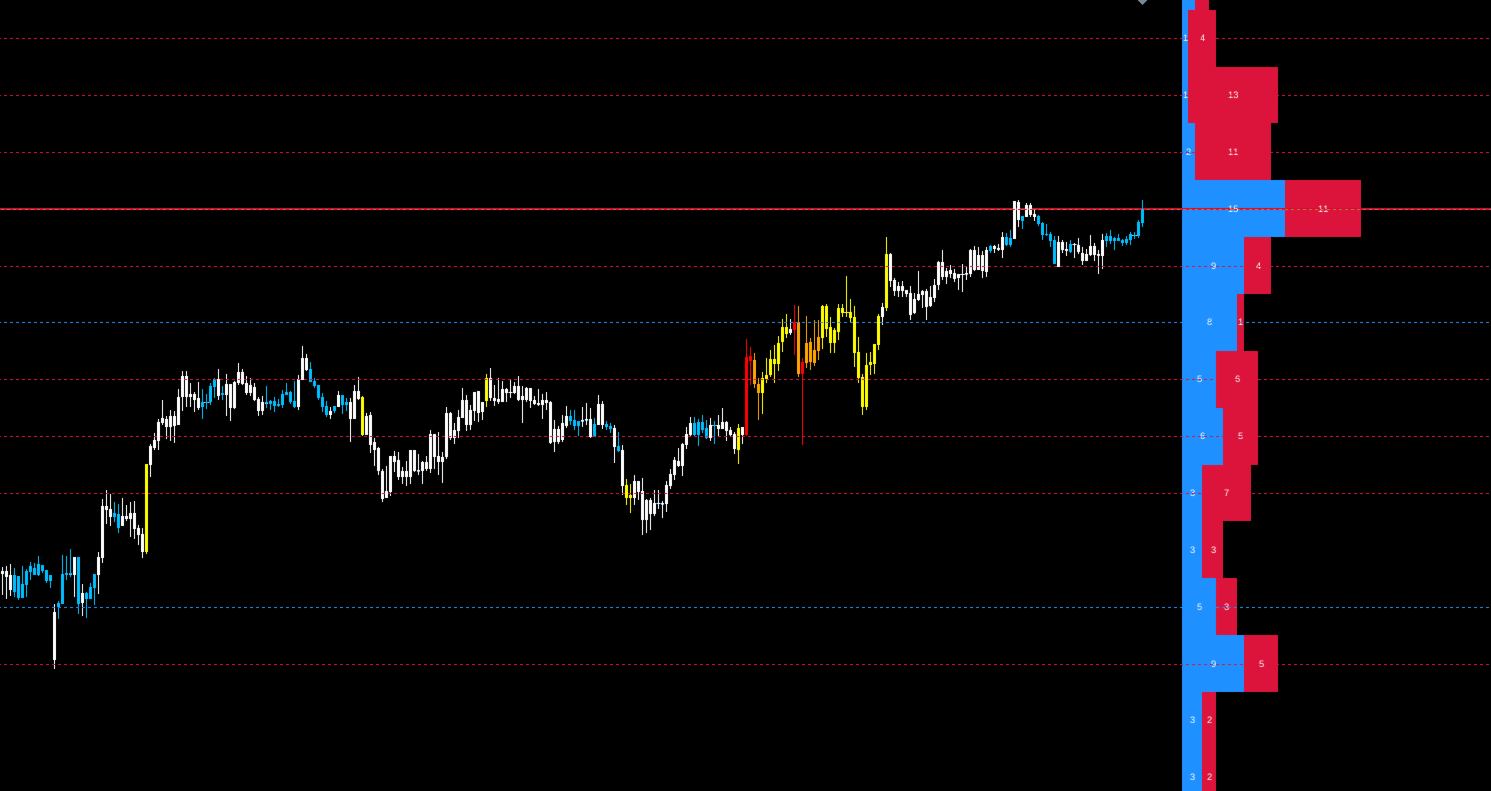
Pivot Profile is an advanced volume and market structure analysis indicator that uses the density of swing highs and lows to build a sideways market profile. Unlike the traditional Volume Profile, this indicator focuses on what really matters: where reversal pivots are clustering.

The indicator identifies zones of Supply and Demand Concentration, allowing you to visually spot price walls where the market is likely to react.

Why use Pivot Profile?

Pivot Profile reveals the price levels that algorithms and large players have repeatedly defended. When multiple pivots align within a narrow range, a Concentration Area (CA) is formed — a high-probability zone for reversal or continuation trades.

Key Features

  • Horizontal Histogram Profile: Clear visualization of support strength (blue) and resistance strength (red).

  • Automatic Concentration Lines (CAs): The indicator automatically draws horizontal lines at levels that reach a configurable density threshold.

  • Customizable Resolution: Adjust the profile granularity to capture micro movements or large macro zones.

  • Fully Customizable: Adjustable colors, spacing, numeric labels, and analysis depth.

Recommended Settings (Presets)

For best performance, the indicator should be adjusted according to the asset’s volatility:

  • XAUUSD (Gold):

    • Maximum Pivots Analyzed: 200

    • Resolution (Rows): 60

    • Result: Captures finer and more precise liquidity zones for scalping and day trading.
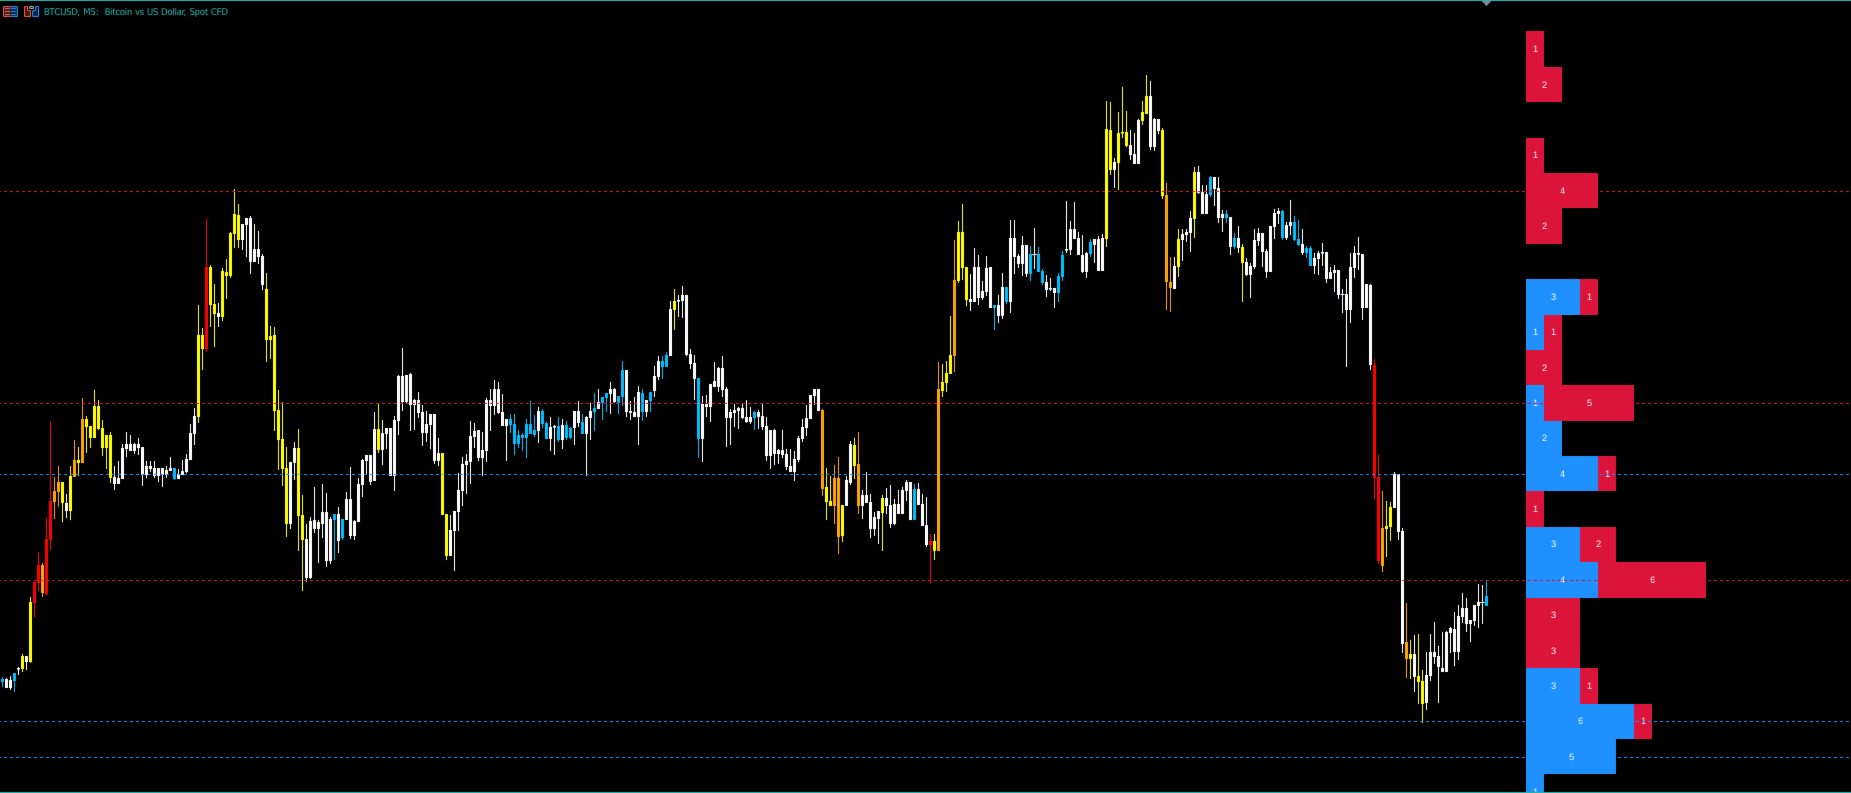
  • BTCUSD (Bitcoin):

    • Maximum Pivots Analyzed: 120

    • Resolution (Rows): 50

    • Result: Ideal for filtering high-volatility crypto noise, focusing on stronger support and resistance zones.

Technical Parameters

  • Sensibility: Number of sideways bars required to confirm a swing high or low.

  • Maximum Pivots: Historical lookback depth of the indicator.

  • Resolution: Number of columns (bins) in the histogram.

  • CA Threshold: Minimum number of pivots at the same level required to draw an automatic S/R line.


Önerilen ürünler
CosmiCLab SMC FIBO CosmiCLab SMC FIBO is a professional trading indicator designed for traders who use Smart Money Concepts (SMC), market structure analysis and Fibonacci retracement levels. The indicator automatically detects market swings and builds Fibonacci levels based on the latest impulse movement. It also identifies market structure changes such as BOS (Break of Structure) and CHOCH (Change of Character), helping traders understand the current market direction. CosmiCLab SMC FIBO also pr
Unlock key market insights with automated support and resistance lines Tired of plotting support and resistance lines? This is a multi-timeframe indicator that detects and plots supports and resistance lines in the chart with the same precision as a human eye would. As price levels are tested over time and its importance increases, the lines become thicker and darker, making price leves easy to glance and evaluate. [ Installation Guide | Update Guide | Troubleshooting | FAQ | All Products  | 
DYJ BoS göstergesi, piyasa yapısındaki değişimlerin temel unsurlarını otomatik olarak belirler ve işaretler, bunlar arasında şunlar yer alır: Yapının Kırılması (BoS): Fiyatın önceki bir yapı noktasını kırarak önemli bir hareket yapması durumunda tespit edilir. Olası yükseliş trendi çizgilerini ve düşüş trendi çizgilerini (UP & DN, yani sürekli yeni zirveler ve yeni dipler) işaretler ve fiyat bu çizgileri aştığında kırmızı (AYI) ve yeşil (BOĞA) okları işaretler BoS genellikle fiyatın önceki f
TRI Visualizer
Yoshimi Mon 三 Ura
TRI Visualizer MT5 – Thermodynamic Market Analysis Overview The TRI (Thermal Range Indicator) Visualizer Enhanced is a rare market analysis indicator that goes beyond conventional technical analysis, applying principles of thermodynamics from physics. It interprets market price fluctuations as “thermodynamic energy,” enabling the highly accurate detection of subtle market changes that are often overlooked. Innovative Mechanisms 1. Dual Calculation Engines Classic TRI Mode Formula: |Close
Ortalama geri dönüş ticareti için profesyonel ve nicel bir yaklaşım uygulayan benzersiz gösterge. Fiyatın tahmin edilebilir ve ölçülebilir bir şekilde ortalamaya döndüğü ve yön değiştirdiği gerçeğinden yararlanır, bu da nicel olmayan ticaret stratejilerinden büyük ölçüde daha iyi performans gösteren net giriş ve çıkış kurallarına izin verir. [ Installation Guide | Update Guide | Troubleshooting | FAQ | All Products ] Ticaret sinyallerini temizle Ticaret yapmak inanılmaz derecede kolay Özelleşt
Einstein Pivot Point
Luis Cesar Nunes Dos Santos
Einstein Pivot Point indicator shows you hourly, weekly or monthly pivot points and support and resistance levels. You can choose 3 different formula for the support and resistance levels (Classic Formula, Woodie Pivot Points and Fibonacci Pivot Points). Einstein Pivot Point   will automatically calculate the p ivot point   and   support  and  resistance levels  on the basis of market data. Trading requires reference points (support and resistance), which are used to determine when to enter the
Fibaction
Abdelkhalek Orabi
Indicator Name: Fibaction – price action candle Detector Description: Fibo Signal Boxes is a powerful Smart Money Concept (SMC)-inspired indicator that auto-detects price action candles. bullish hammers and shooting stars, then draws precise Fibonacci entry zones and multiple take-profit levels directly on the chart. as for the SL personally i use 40 pips rules  Key Features: Detects bullish hammer and shooting star reversal candles. Automatically draws Fibonacci entry and TP boxes. as
Weis Wave Scouter
Jean Carlos Martins Roso
MetaTrader 5 için geliştirilen Weis Wave Scouter ile gelişmiş hacim analizinin gücünü keşfedin! Bu devrim niteliğindeki gösterge, Wyckoff yönteminin ve Hacim Yayılımı Analizinin (VSA) kanıtlanmış ilkelerini birleştiriyor. Operasyonlarında doğruluk ve derinlik arayan yatırımcılar için tasarlanmıştır ve kümülatif hacim dalgası analizi yoluyla piyasanın taktiksel bir okumasını sunar. Weis Wave Scouter, Classic, NightVision ve OceanBreeze gibi özelleştirilebilir renk temaları ile renkli histogramlar
No Demand No Supply MT5
Trade The Volume Waves Single Member P.C.
No Demand No Supply   This indicator identifies   No Demand –No Supply candles to your chart and plots volume bars colored according to the signal. It can be applied to all timeframes or to a specific one only. It can also be used as regular volume indicator  with exceptional future of WEIGHTED VOLUME. Furthermore is has an alert notification, sound and email when a signals occurs. The indicator does not repaint but the alert will come on two candles back due to the definition of No Demand No Su
KT Horizontal Lines MT5
KEENBASE SOFTWARE SOLUTIONS
MetaTrader’da birden fazla   yatay çizgi   çizmek ve bu çizgilerin fiyat seviyelerini takip etmek zahmetli olabilir. Bu gösterge, fiyat uyarıları ayarlamak, destek/direnç seviyelerini çizmek ve diğer manuel işlemler için eşit aralıklarla otomatik olarak birden fazla yatay çizgi çizer. Bu gösterge, hızlı alım-satımlarla kâr elde etmeyi hedefleyen yeni başlayan Forex yatırımcıları için uygundur. Yatay çizgiler, piyasa bir trend izliyorken ya da yatay seyrederken işlem başlatılabilecek potansiyel a
Support & Resistance indicator is a modification of the standard Bill Williams' Fractals indicator. The indicator works on any timeframes. It displays support and resistance levels on the chart and allows setting stop loss and take profit levels (you can check the exact value by putting the mouse cursor over the level). Blue dashed lines are support level. Red dashed lines are resistance levels. If you want, you can change the style and color of these lines. If the price approaches a support lev
Auto Fractal Support And Resistance is a powerful multi-timeframe indicator designed for traders who want to trade lower timeframes with higher timeframe accuracy. When your mouse cursor is on a line you can easily see fractal describtion and index of fractal candle  and timeframe of that fractal candle.  This indicator automatically detects H1 and D1 fractal levels and draws clean horizontal support and resistance lines on any lower timeframe chart (M1, M5, M15, M30). Now you can see where the
Swing Points
Usiola Oluwadamilol Olagundoye
Swing Points Indicator for MetaTrader 5 The **Swing Points Indicator** is a custom-built technical tool designed for MetaTrader 5 (MT5), primarily used for identifying crucial reversal points in price action. By plotting swing highs and swing lows, it highlights potential trend reversals, making it a valuable tool for traders relying on price action analysis. This indicator helps traders anticipate changes in market direction by visually marking significant turning points on the chart. Main F
FREE
RBreaker
Zhong Long Wu
RBreaker Gold Indicators is a short-term intraday trading strategy for gold futures that combines trend following and intraday reversal approaches. It not only captures profits during trending markets but also enables timely profit-taking and counter-trend trading during market reversals. This strategy has been ranked among the top ten most profitable trading strategies by the American magazine   Futures Truth   for 15 consecutive years. It boasts a long lifecycle and remains widely used and st
## WPRV2 İşaretçisi Tam Açıklaması WPRV2, William's Yüzde Aralığı (%R) olarak bilinen geleneksel teknik analiz aracının iyileştirilmiş bir versiyonudur. Hisse senetleri piyasalarında, Forex ve kripto para platformlarında kullanılır ve piyasa eğilimlerini analiz etmeye ve ticari pozisyonlar için en uygun giriş ve çıkış noktalarını belirlemeye yardımcı olur. ### İşaretçinin Amacı WPRV2'nin temel amacı, şu anki fiyatın yakın zamanda gerçekleşen en yüksek ve en düşük seviyelerine göre yerini ölçm
Bu gösterge, tüccarın ihtiyacına göre grafiği daha temiz hale getirmek için etkinleştirilebilen / devre dışı bırakılabilen 6 seviyeye kadar çizer Bu 6 seviye 2 set halindedir: Yüksek ve Düşük Her set için farklı zaman aralığı seçilebilir Fiyatın Günlük, Haftalık veya Aylık En Düşük seviyeye ulaştığında genellikle 5dk gibi daha küçük bir zaman diliminde reddedildiği düşünüldüğünden, Önceki Yüksek Düşük tersine çevirme stratejisine dayanır. Özellikler : - Tek bir grafikte 6 Zaman Çerçevesi Y
Your Trend Friend
Luigi Nunes Labigalini
5 (1)
The trend is your friend! Look at the color of the indicator and trade on that direction. It does not  repaint. After each candle is closed, that's the color of the trend. You can focus on shorter faster trends or major trends, just test what's most suitable for the symbol and timeframe you trade. Simply change the "Length" parameter and the indicator will automatically adapt. You can also change the color, thickness and style of the lines. Download and give it a try! There are big movements w
Caicai L&S Yield Histogram Important Notice: This indicator is an integral tool of the automated EA Caicai Long and Short Pair Trading . This indicator visually displays the percentage deviation (Yield %) of a pair's current spread relative to its own historical mean. It is an excellent tool for quickly visualizing the gross financial potential of a market distortion in Long & Short operations. Main Features: Percentage Visualization: Understand the size of the distortion in palpable percentage
Trend Levels Indicator Elevate your trading strategy with the Trend Levels Indicator , a sophisticated tool designed to detect market trends and highlight critical price levels. This cutting-edge indicator is packed with features to simplify trend analysis and empower your decision-making process. Key Features: Dynamic Trend Levels : Accurately plots high, mid, and low levels based on market dynamics. Custom Alerts & Notifications : Get real-time alerts and notifications when trends change, ensu
STRICTLY FOR BOOM INDEX ONLY!!!!! Here I bring the Maximum Trend Arrows OT1.0 MT5 indicator. This indicator is made up of a combination of different trend indicators for entries and exits, for entries an orange arrow will paint on the chart below the current market and a red flag for closing of trades and it produces buy arrows only. When the orange arrow appears, it will appear along with it's sound to notify you. The 1H timeframe is recommended, don't use it anywhere else than on the 1H timefr
Mini Chart Indicators
Flavio Javier Jarabeck
The Metatrader 5 has a hidden jewel called Chart Object, mostly unknown to the common users and hidden in a sub-menu within the platform. Called Mini Chart, this object is a miniature instance of a big/normal chart that could be added/attached to any normal chart, this way the Mini Chart will be bound to the main Chart in a very minimalist way saving a precious amount of real state on your screen. If you don't know the Mini Chart, give it a try - see the video and screenshots below. This is a gr
Market Shift Levels This indicator detects trend shifts and visualizes key market structure turning points using Hull Moving Average logic. It highlights potential areas of support and resistance where price is likely to react, empowering traders to spot early trend transitions. Market Shift Levels   are horizontal zones that mark the moment of a directional change in market behavior. These shifts are based on crossovers between two smoothed Hull Moving Averages (HMA), allowing the indicator
Donchian Zaman Senkronizasyon Analizörü,   klasik Donchian kanal analizine güçlü   bir çoklu zaman   dilimi boyutu kazandırarak, yatırımcıların beş farklı grafik periyodu boyunca   trend gücünü   ve olası   geri dönüş sinyallerini   aynı anda izlemelerine olanak tanır. Bu gelişmiş gösterge, seçtiğiniz zaman dilimlerindeki en yüksek zirveleri ve en düşük dipleri hesaplayarak, trend yönünün birden fazla zaman ufkunda birleşmesini belirlemeye yardımcı olan   net görsel sinyaller   üretir. Dakikadan
MT5 için Crypto_Forex Göstergesi "Çekiç ve Kayan Yıldız paterni", Yeniden boyama yok, gecikme yok. - "Çekiç ve Kayan Yıldız paterni" göstergesi, Fiyat Hareketi işlemleri için çok güçlü bir göstergedir. - Gösterge, grafikte boğa Çekiç ve ayı Kayan Yıldız formasyonlarını tespit eder: - Boğa Çekiç - Grafikte mavi ok sinyali (resimlere bakın). - Ayı Kayan Yıldız - Grafikte kırmızı ok sinyali (resimlere bakın). - Bilgisayar, Mobil ve E-posta uyarılarıyla. - "Çekiç ve Kayan Yıldız paterni" gösterges
Support & Resistance Zone Indicator This indicator dynamically identifies and draws support and resistance zones based on recent price action and fractal patterns. By analyzing ZigZag pivot points and tracking price reactions (touches, bounces, and breaks), the indicator determines the strength and validity of each zone. Key Features: Multi-Timeframe Support: Can work across different timeframes. Fractal-Based Detection: Utilizes both fast and slow fractal detection to find significant swing po
Qauters Theory GBPJPY
Brighton Mufaro Mudzingwa
QT PRO Quarters Theory GBPJPY · London Open Breakout Plots 250-pip major quarters, 125-pip half-quarters, and 25-pip minor levels on GBPJPY. Monitors the London session open (08:00 GMT) and fires a single buy or sell arrow when price breaks and closes beyond the first key level — one signal per day, no repainting How it works now: Arrows only appear between 08:00–12:00 GMT (London session) — nothing outside that window 1 arrow per day maximum — once the first valid break is found, that day is
Double HMA MTF for MT5
Pavel Zamoshnikov
4 (4)
This is an advanced multi-timeframe version of the popular Hull Moving Average (HMA) Features Two lines of the Hull indicator of different timeframes on the same chart. The HMA line of the higher timeframe defines the trend, and the HMA line of the current timeframe defines the short-term price movements. A graphical panel with HMA indicator data from all timeframes at the same time . If the HMA switched its direction on any timeframe, the panel displays a question or exclamation mark with a tex
"Impulses and Corrections 5" is created to help traders navigate the market situation. The indicator shows multi-time frame upward and downward "Impulses" of price movements. These impulses are the basis for determining the "Base" , which is composed of zones of corrections of price movements, as well as "Potential" zones for possible scenarios of price movement. Up and down impulses are determined based on a modified formula of Bill Williams' "Fractals" indicator. The last impulse is always "U
SVP Zones SM ICT
Damian Blaha
5 (1)
SVP Zones stands for Structure Volume Pattern Zone - the indicator was created to automate my strategy, which was created after 4 years of research into the gold market and how volume affects price structure. When several conditions are met, the indicator forms a zone, and when the price leaves the zone in the right direction, the indicator gives a signal. That's all you need to know. An important note: since the indicator reads the price structure based on closed candles, the signal is sent his
Fibo Channels
Jeffrey Quiatchon
Fibo Daily Channel Indicator The  Indicator is a powerful tool for traders, providing precise daily support and resistance levels based on Fibonacci retracement and extension calculations. This indicator automatically draws key pivot points (PP, R1, R2, S1, S2) as well as additional extension levels (R3, R4, S3, S4), helping traders identify potential reversal and breakout zones with ease. It includes customizable alerts and push notifications, allowing traders to receive updates whenever the pr
Bu ürünün alıcıları ayrıca şunları da satın alıyor
SuperScalp Pro
Van Minh Nguyen
4.57 (21)
SuperScalp Pro – Gelişmiş Çoklu Filtreli Scalping Gösterge Sistemi SuperScalp Pro, klasik Supertrend ile çok sayıda akıllı onay filtresini birleştiren gelişmiş bir scalping gösterge sistemidir. Gösterge M1’den H4’e kadar tüm zaman dilimlerinde verimli çalışır ve özellikle XAUUSD, BTCUSD ve ana Forex pariteleri için uygundur. Bağımsız bir sistem olarak kullanılabilir veya mevcut ticaret stratejilerine esnek şekilde entegre edilebilir. Gösterge, hız ve yavaş EMA’lar, trend belirleyen üç EMA, EMA e
Entry In The Zone and SMC Multi Timeframe is a real-time 2-in-1 market analysis tool that combines market structure analysis and a No Repaint BUY / SELL signal system into a single indicator, built on Smart Money Concepts (SMC) — a widely adopted framework used by professional traders to understand market structure. This indicator helps you see the market more clearly, make decisions based on structure rather than guesswork, and focus on high-probability zones where price is more likely to react
Divergence Bomber
Ihor Otkydach
4.9 (86)
Bu göstergeyi satın alan herkese aşağıdaki ekstra içerikler ücretsiz olarak sunulmaktadır: Her işlemi otomatik olarak yöneten, Stop Loss ve Take Profit seviyelerini ayarlayan ve işlemleri strateji kurallarına göre kapatan özel yardımcı araç: "Bomber Utility" Göstergenin farklı varlıklar üzerinde kullanılmasına yönelik ayar dosyaları (set dosyaları) Bomber Utility için 3 farklı modda kullanım sunan ayar dosyaları: "Minimum Risk", "Dengeli Risk" ve "Bekle-Gör Stratejisi" Bu ticaret stratejisini hı
Azimuth Pro
Ottaviano De Cicco
5 (6)
Azimuth Pro V2: Synthetic Fractal Structure and Confirmed Entries for MT5 Overview Azimuth Pro is a multi-level swing structure indicator by Merkava Labs . Four nested swing layers, swing-anchored VWAP, ABC pattern detection, three-timeframe structural filtering, and closed-bar confirmed entries — one chart, one workflow from micro-swings to macro-cycles. This is not a blind signal product. It is a structure-first workflow for traders who care about location, context, and timing. V2 Launch Offe
Quantum TrendPulse
Bogdan Ion Puscasu
5 (23)
SuperTrend   ,   RSI   ve   Stochastic'in   gücünü tek bir kapsamlı göstergede birleştirerek işlem potansiyelinizi en üst düzeye çıkaran nihai işlem aracı olan   Quantum TrendPulse'u   tanıtıyoruz. Hassasiyet ve verimlilik arayan yatırımcılar için tasarlanan bu gösterge, piyasa trendlerini, momentum değişimlerini ve en uygun giriş ve çıkış noktalarını güvenle belirlemenize yardımcı olur. Temel Özellikler: SuperTrend Entegrasyonu:   Güncel piyasa trendlerini kolayca takip edin ve karlılık dalgası
Gann Made Easy , bay teorisini kullanarak ticaretin en iyi ilkelerine dayanan, profesyonel ve kullanımı kolay bir Forex ticaret sistemidir. WD Gann. Gösterge, Zararı Durdur ve Kâr Al Seviyeleri dahil olmak üzere doğru SATIN AL ve SAT sinyalleri sağlar. PUSH bildirimlerini kullanarak hareket halindeyken bile işlem yapabilirsiniz. Satın alma işleminden sonra, alım satım talimatlarını ve harika ek göstergeleri ücretsiz olarak almak için lütfen benimle iletişime geçin! Muhtemelen Gann ticaret yöntem
Bu indikatörü satın alırsanız, Profesyonel Trade Manager’ımı  + EA ÜCRETSİZ olarak alacaksınız. Öncelikle, bu Ticaret Sistemi'nin Non-Repainting, Non-Redrawing ve Non-Lagging Göstergesi olduğunu vurgulamak önemlidir, bu da hem manuel hem de robot ticareti için ideal hale getirir. Online kurs, kılavuz ve ön ayarları indir. "Smart Trend Trading System MT5", yeni ve deneyimli tüccarlar için özelleştirilmiş kapsamlı bir ticaret çözümüdür. 10'dan fazla premium göstergeyi birleştiriyor ve 7'den fazla
FX Trend MT5 NG
Daniel Stein
5 (4)
FX Trend NG: Yeni Nesil Çoklu Piyasa Trend Zekâsı Genel Bakış FX Trend NG , çoklu zaman dilimlerinde çalışan profesyonel bir trend analiz ve piyasa izleme aracıdır. Piyasanın yapısını saniyeler içinde anlamanızı sağlar. Birden fazla grafik arasında geçiş yapmak yerine, hangi enstrümanların trendde olduğunu, momentumun nerede zayıfladığını ve hangi zaman dilimlerinin uyumlu olduğunu anında görebilirsiniz. Lansman Teklifi – FX Trend NG sadece $30 (6 Ay) veya $80 Ömür Boyu Lisans ile edinin. Zate
OmniSync Projection
Antonio-alin Teculescu
5 (1)
Chronos Fractal Engine is an innovative price projection indicator for MetaTrader 5, designed to transform your technical analysis by intelligently identifying and projecting historical price patterns. Built upon an advanced correlation algorithm and the fractal principles of the market, this powerful tool visualizes potential future price movements, giving you a unique edge in your trading decisions. What is Chronos Fractal Engine? At its core, the Chronos Fractal Engine employs a sophisticat
Tanıtım       Quantum Breakout PRO   , Breakout Bölgeleri ile ticaret yapma şeklinizi değiştiren çığır açan MQL5 Göstergesi! 13 yılı aşkın ticaret tecrübesine sahip deneyimli tüccarlardan oluşan bir ekip tarafından geliştirilmiştir.       Kuantum Breakout PRO       yenilikçi ve dinamik koparma bölgesi stratejisiyle ticaret yolculuğunuzu yeni zirvelere taşımak için tasarlanmıştır. Kuantum Breakout Göstergesi, size 5 kar hedefi bölgesi ile kırılma bölgelerinde sinyal okları ve kırılma kutusuna da
Power Candles MT5
Daniel Stein
4.75 (8)
Power Candles – Tüm Piyasalar İçin Güce Dayalı Giriş Sinyalleri Power Candles , Stein Investments’ın kanıtlanmış güç analizini doğrudan fiyat grafiğinize taşır. Sadece fiyata tepki vermek yerine, her mum gerçek piyasa gücüne göre renklendirilir. Bu sayede momentum birikimleri, güç hızlanmaları ve net trend geçişleri anında görülebilir. Tüm Piyasalar İçin Tek Mantık Power Candles tüm işlem sembollerinde otomatik olarak çalışır. Gösterge, mevcut sembolün Forex mi yoksa Forex dışı bir piyasa mı old
CGE Trading Suite
Carl Gustav Johan Ekstrom
5 (2)
Institutional-Grade Analytics for MT5 C GE Trading Suite delivers the analytical edge typically reserved for professional trading desks. The platform integrates a full suite of analytical tools into one seamless workflow: dynamic grid mapping, liquidity behavior analysis, ECM, trend lines, MIDAS, trade cycles, and directional channel projections. Together, these provide a unified view of market structure and momentum. Directional clarity is further enhanced by the capital flow index, which meas
Hangi stratejinin sizin sembolunuzde gercekten calistigini gorun - gercek paranizi riske atmadan once. Power Bar, herhangi bir sembol ve herhangi bir zaman diliminde asiri fiyat barlarini tespit eder, ardindan 3 farkli islem stratejisini aninda geriye donuk test eder. Boylece kazanma oranlarini, kar faktorlerini ve P&L'yi yan yana karsilastirabilirsiniz. Tek bir interaktif panelde. Tahmin yok. Esriye uydurma yok. Sadece veri. Power Bar'i benzersiz yapan nedir? Cogu indikator size bir sinyal ver
Meridian Pro
Ottaviano De Cicco
5 (1)
Meridian Pro: Professional Multi-Timeframe Trend Matrix for MT5 Overview Meridian Pro is a multi-timeframe trend matrix by Merkava Labs that compresses directional state, strength, momentum condition and matrix agreement into one compact panel. One adaptive engine, applied consistently from M1 to W1. No per-symbol tuning. No indicator stacking. One structured readout across every asset and every timeframe. Launch Offer — Get Meridian Pro for USD 99 (introductory). Regular price: USD 149. 1. Why
Grabber System MT5
Ihor Otkydach
4.83 (23)
Size mükemmel bir teknik gösterge olan Grabber’ı tanıtıyorum. Bu araç, kullanıma hazır bir “her şey dahil” işlem stratejisi olarak çalışır. Tek bir yazılım kodu içinde güçlü piyasa teknik analiz araçları, işlem sinyalleri (oklar), uyarı işlevleri ve push bildirimleri entegre edilmiştir. Bu göstergeyi satın alan herkes aşağıdaki hediyeleri ücretsiz olarak alır: Açık emirleri otomatik yönetmek için Grabber Yardımcı Aracı Kurulum, yapılandırma ve nasıl işlem yapılacağını adım adım anlatan video kıl
Önce dürüst olalım. Hiçbir gösterge tek başına sizi kârlı yapmaz. Eğer biri size aksini söylüyorsa, size bir hayal satıyordur. Mükemmel al/sat okları gösteren her gösterge, kusursuzmuş gibi görünecek şekilde yapılabilir — sadece geçmişin doğru bir bölümünü yakınlaştırıp kazanan işlemleri ekran görüntüsü almanız yeterlidir. Biz bunu yapmıyoruz.  SMC Intraday Formula bir araçtır. Piyasa yapısını sizin için okur, en yüksek olasılıklı fiyat bölgelerini belirler ve şu anda akıllı paranın izinin nası
Trend Screener Pro MT5
STE S.S.COMPANY
4.85 (104)
Trend Göstergesi, Trend Alım Satım ve Filtreleme için Çığır Açan Benzersiz Çözüm, Tüm Önemli Trend Özellikleriyle Tek Bir Araç İçinde Yerleştirildi! Forex, emtialar, kripto para birimleri, endeksler ve hisse senetleri gibi tüm sembollerde/araçlarda kullanılabilen %100 yeniden boyamayan çoklu zaman çerçevesi ve Çoklu para birimi göstergesidir. Trend Screener, grafikte noktalarla ok trend sinyalleri sağlayan etkili bir trend trend göstergesidir. Trend analizörü göstergesinde bulunan özellikler: 1.
Btmm state engine pro
Garry James Goodchild
5 (4)
BTMM State Engine Pro is a MetaTrader 5 indicator for traders who use the Beat The Market Maker approach: Asian session context, kill zone timing, level progression, peak formation detection, and a multi-pair scanner from a single chart. It combines cycle state logic with a built-in scanner dashboard so you do not need the same tool on many charts at once. What it does Draws the Asian session range; session times can follow broker server offset or be set in inputs. Tracks level progression (L
Atomic Analyst MT5
Issam Kassas
3.94 (31)
Öncelikle belirtmek gerekir ki bu Ticaret Göstergesi Yeniden Çizim Yapmaz, Gecikmez ve Gecikme Göstermez, bu da hem manuel hem de robot ticareti için ideal hale getirir. Kullanıcı kılavuzu: ayarlar, girişler ve strateji. Atom Analisti, Piyasada Daha İyi Bir Avantaj Bulmak İçin Fiyatın Gücünü ve Momentumunu Kullanan PA Fiyat Hareketi Göstergesidir. Gürültüleri ve Yanlış Sinyalleri Kaldırmaya ve Ticaret Potansiyelini Artırmaya Yardımcı Olan Gelişmiş Filtrelerle Donatılmıştır. Birden fazla katmanl
Smart Stop Indicator – Stop-loss düzeylerini doğrudan grafikte akıllı ve hassas şekilde belirleyin Genel Bakış Smart Stop Indicator, stop-loss seviyesini tahmin ederek veya sezgilere güvenerek değil, net ve sistematik bir şekilde belirlemek isteyen traderlar için özel olarak geliştirilmiştir. Bu araç, klasik price-action mantığını (yükselen tepeler, düşen dipler) modern breakout algılama ile birleştirerek bir sonraki mantıklı stop seviyesini belirler. Trendlerde, yatay piyasalarda veya hızlı k
Crystal Heikin Ashi Signals
Muhammad Jawad Shabir
5 (2)
Crystal Heikin Ashi Signals - Professional Trend & Signal Detection Indicator Advanced Heikin Ashi Visualization with Intelligent Signal System for Manual & Automated Trading Final Price: $149 ---------> Price goes up $10 after every 10 sales . Limited slots available — act fast . Overview Crystal Heikin Ashi Signals is a professional-grade MetaTrader 5 indicator that combines pure Heikin Ashi candle visualization with an advanced momentum-shift detection system. Designed for both manual traders
FX Power MT5 NG
Daniel Stein
5 (31)
FX Power: Daha Akıllı Ticaret Kararları için Para Birimlerinin Gücünü Analiz Edin Genel Bakış FX Power , her piyasa koşulunda başlıca para birimlerinin ve altının gerçek gücünü anlamak için vazgeçilmez bir araçtır. Güçlü para birimlerini alıp zayıf olanları satarak, FX Power ticaret kararlarınızı basitleştirir ve yüksek olasılıklı fırsatları ortaya çıkarır. İster trendlere sadık kalın ister Delta'nın aşırı değerlerini kullanarak tersine dönüşleri öngörün, bu araç ticaret tarzınıza mükemmel bir
Auto Optimized Parabolic RSI: Gelişmiş 3D Momentum Motoru Çoğu perakende indikatörü, piyasa volatilitesi değiştiği an çöken statik girdilere dayandığı için başarısız olur. Auto Optimized Parabolic RSI, kendi matematiksel avantajını sürekli olarak yeniden hesaplayarak "indikatör körelmesi" (indicator decay) sorununu çözer ve kurumsal düzeyde kantitatif adaptasyonu doğrudan MT5 terminalinize getirir. Temel Avantaj: Özel Bellek İçi (In-Memory) 3D Optimizasyon Standart otomatik optimize ediciler, te
RelicusRoad Pro: Kantitatif Piyasa İşletim Sistemi ÖMÜR BOYU ERİŞİMDE %70 İNDİRİM (SINIRLI SÜRE) - 2.000+ TRADER'A KATILIN Neden çoğu trader "mükemmel" indikatörlere rağmen başarısız olur? Çünkü tekil kavramları boşlukta trade ederler. Bağlamı olmayan bir sinyal kumardır. Sürekli kazanmak için KONFLÜANS (UYUM) gerekir. RelicusRoad Pro basit bir ok indikatörü değildir. Tam bir Kantitatif Piyasa Ekosistemi dir. Tescilli volatilite modellemesini kullanarak fiyatın ilerlediği "Adil Değer Yolu"nu har
Market Structure Order Block Dashboard MT5, piyasa yapısını ve fiyatın ana tepki bölgelerini doğrudan grafik üzerinde okumak isteyen yatırımcılar için tasarlanmış bir MT5 göstergesidir. BOS, ChoCH, Order Blocks, Fair Value Gaps (FVG), Liquidity, Kill Zones, Volume Profile ve hızlı analiz için kompakt bir dashboard yapısını bir araya getirir. Bu gösterge, piyasa yapısını, ICT kavramlarını ve Smart Money kavramlarını karar verme çerçevesi olarak kullanan yatırımcılar için geliştirilmiştir. Trend d
ARICoins
Temirlan Kdyrkhan
ARICoin is a powerful trading companion designed to generate high-probability entry signals with dynamic TP/SL/DP levels based on volatility. Built-in performance tracking shows win/loss stats, PP1/PP2 hits, and success rates all updated live. Key Features: Buy/Sell signals with adaptive volatility bands Real-time TP/SL/DP levels based on ATR Built-in MA Filter with optional ATR/StdDev volatility Performance stats panel (Success, Profit/Loss, PP1/PP2) Alerts via popup, sound, push, or email Cust
ARIPoint
Temirlan Kdyrkhan
ARIPoint is a powerful trading companion designed to generate high-probability entry signals with dynamic TP/SL/DP levels based on volatility. Built-in performance tracking shows win/loss stats, PP1/PP2 hits, and success rates all updated live. Key Features: Buy/Sell signals with adaptive volatility bands Real-time TP/SL/DP levels based on ATR Built-in MA Filter with optional ATR/StdDev volatility Performance stats panel (Success, Profit/Loss, PP1/PP2) Alerts via popup, sound, push, or email Cu
Meravith Scanner
Ivan Stefanov
5 (1)
MERAVITH SCANNER, MetaTrader 5 için profesyonel bir finansal piyasa göstergesidir ve birden fazla analiz aracını tek bir entegre sistemde birleştirir. Tüm hesaplamaları, özel hacim ağırlıklı ortalama fiyat (VWAP) metodolojisini kullanarak otomatik olarak gerçekleştirir ve subjektif yorumları tamamen ortadan kaldırır. Bu gösterge, tüm varlık sınıflarında (Forex, Hisseler, Endeksler, Emtialar, Kripto Paralar) ve M1’den Aylık’a kadar tüm zaman dilimlerinde çalışır. Temel prensip, fiyatın hacmi taki
Market Structure Patterns
Samuel Manoel De Souza
4.47 (19)
Uygun sürümler:   MT4   ve   MT5 . Market Structure Patterns kanalına katılın – çalışma materyallerini indirin ve ek bilgiler edinin. İlgili gönderiler: Market Structure Patterns - Introdução Beyond Fancy Order Blocks: Using True Volumetric Analysis with Market Structure Patterns & Timeless Charts Market Structure Patterns – Complete SMC Indicator Guide (Concepts + Settings) Market Structure Patterns , smart money concepts (akıllı para kavramları) temelinde geliştirilen ve SMC/ICT öğelerini gr
Blahtech Supply Demand MT5
Blahtech Limited
4.54 (13)
Was: $299  Now: $99  Supply Demand uses previous price action to identify potential imbalances between buyers and sellers. The key is to identify the better odds zones, not just the untouched ones. Blahtech Supply Demand indicator delivers functionality previously unavailable on any trading platform. This 4-in-1 indicator not only highlights the higher probability zones using a multi-criteria strength engine, but also combines it with multi-timeframe trend analysis, previously confirmed swings a
Yazarın diğer ürünleri
The Volume oscillator is a hybrid technical tool designed to map market regimes by combining price statistical deviation with volume flow intensity. It helps traders distinguish between real trend breakouts and low-volume traps. By using an internal Volume RSI as a multiplier, the indicator scales the histogram according to market participation. High-volatility moves backed by volume are amplified, while low-volume noise is suppressed. Key Features: HLC3 Smoothing: Based on the average price for
FREE
Pivot Points Apex
Alexandre Silva Diniz
Pivot Points Indicator that calculates essential support and resistance levels for day traders and swing traders. Ideal for identifying reversal points, setting targets, and managing risk on any timeframe. For Day Traders Identifies key levels for entries and exits Defines stop-loss and target levels Recognizes potential intraday reversals For Swing Traders Identifies weekly/monthly support and resistance zones Plans medium-term positions Complements trend analysis For Scalpers Fast reference
FREE
Hull Moving Average (HMA) The Hull Moving Average was designed to almost entirely eliminate lag without compromising smoothness. While a Simple Moving Average (SMA) is slow to react and an Exponential Moving Average (EMA) can still be "sluggish," the HMA utilizes a combination of Weighted Moving Averages (WMA) to anticipate price action. The "Magic" of Reversal (Coloring) The indicator monitors the slope of the line at every tick: Bullish (Green): When the current HMA value is higher than the pr
FREE
Delta Volume Score
Alexandre Silva Diniz
Delta Volume Score Göstergesi Nasıl Yorumlanır: 1. Metrik Paneli (Aggressive Score Sistemi) Sağ üst köşedeki panel, göstergenin "beyni"dir. Alıcılar ve satıcılar arasındaki mücadeleyi özetler. Buyer Score (Alıcı Skoru): Piyasa fiyatından yapılan alış emirlerinin (agresif alış) birikmiş hacmini temsil eder. Seller Score (Satıcı Skoru): Piyasa fiyatından yapılan satış emirlerinin (agresif satış) birikmiş hacmini temsil eder. Aggressive Score: Net bakiyedir (Delta). Eğer pozitif ve yeşil ise alıcıl
Çapalı VWAP Çapalı VWAP, geleneksel VWAP'ın bir varyasyonudur. Gösterge hesaplaması, işlem seansının başlangıcından veya sabit bir zaman aralığından ziyade, belirli bir zaman noktasından (çapa) başlar. Bu, büyük bir haber, bir trendin başlangıcı veya bir destek veya direnç seviyesinin kırılması gibi belirli olaylardan itibaren fiyat davranışını hacme göre değerlendirmek isteyen yatırımcılar için yararlı olabilir. Gösterge Forex, hisse senetleri ve endekslerde çalışır. Aynı grafikte birden fazla
Anchored VWAP Bands
Alexandre Silva Diniz
The Anchored VWAP Bands is an advanced precision tool designed to calculate the Volume Weighted Average Price (VWAP) from any specific point on the chart, utilizing a dynamic point-and-click anchoring logic . The Advantage: Precision Anchoring (Click-Point Detection) Unlike standard VWAPs, this indicator detects exactly where you click relative to the candle to define the price calculation base: Click at the Top (HIGH): Anchoring focused on the Maximum Price. Ideal for measuring the average cost
Impulse Trend
Alexandre Silva Diniz
Impulse Trend is an indicator designed to tackle one of the biggest challenges in trading: distinguishing a real trend from simple market noise. It fuses the algorithmic elegance of the Hull Moving Average with the statistical power of Impulse Candles , creating an all-in-one tool for professional traders . The Edge: The Power of Volume Unlike indicators that focus solely on price, Impulse Trend incorporates a Volume RSI directly into the calculation of each candle. Volume is the decisive factor
Filtrele:
Değerlendirme yok
Değerlendirmeye yanıt