Visual Weekdays Indicator
- Yardımcı programlar
-
AL MOOSAWI ABDULLAH JAFFER BAQER
 To trade successfully we need to go through the proven path that others had gone and reached!
Here are 17 quotes from such successful investors:
1- Limit your size in any position so that fear does not become the prevailing instinct guiding your judgment.
Joe Vidich - Sürüm: 1.0
- Etkinleştirmeler: 5
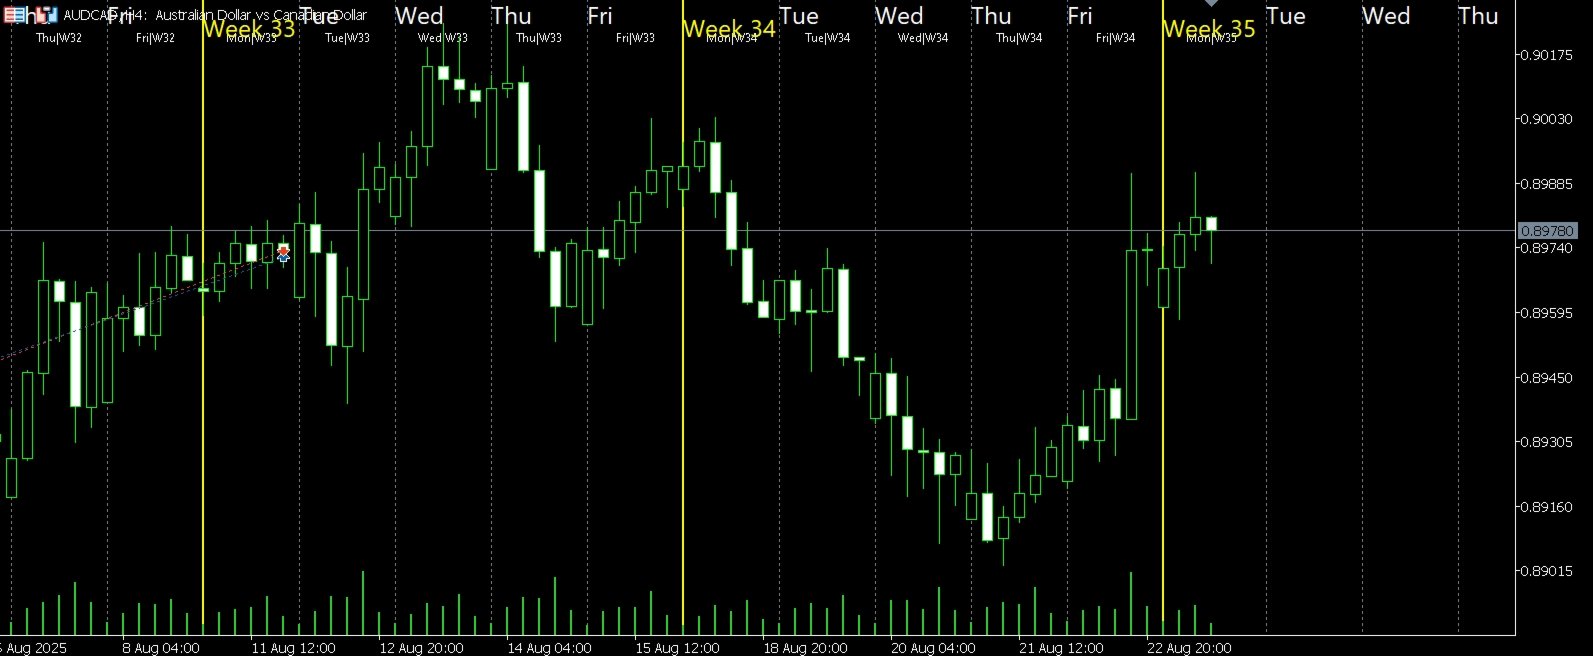
Visual Weekdays Indicator: Master the Market's Weekly Rhythm
Unlock a new dimension of market analysis with the Visual Weekdays Indicator, the ultimate tool for traders who understand that time is as critical as price. The market ebbs and flows with a distinct weekly rhythm, with each day presenting unique characteristics, volatility, and trading opportunities. This powerful indicator is engineered to make this rhythm instantly visible and fully customizable on your chart, providing you with an unparalleled analytical edge.
For just $30, you can transform your chart from a simple price display into a sophisticated temporal map, allowing you to spot weekly patterns, anticipate market behavior, and structure your trading week with precision.
The Logic Explained: An Intelligent Approach to Time
The Visual Weekdays Indicator is more than just a simple session marker. Its core logic is built around a sophisticated engine that intelligently processes the time data of every bar on your chart to provide a rich, interactive, and highly performant visual experience.
-
Precise Time Segmentation: The indicator's foundation is its ability to read the timestamp of each price bar. It uses this information to perform precise date and time calculations, determining not only the day of the week (Monday, Tuesday, etc.) but also the week of the year and the specific day of the year. This granular data forms the basis for all its visual features.
-
Dynamic Object Management: Unlike basic indicators that simply draw lines in a buffer, the Visual Weekdays Indicator creates and manages graphical objects directly on your chart. This includes vertical lines, text labels, and background rectangles. This object-oriented approach allows for superior customization in terms of color, style, and positioning. It also ensures that the visuals are clean, sharp, and perfectly aligned with the time axis, and are intelligently redrawn only when the chart view changes, ensuring your terminal remains fast and responsive.
-
Advanced Algorithmic Drawing: The indicator uses an efficient algorithm to draw session separators. It scans the visible bars on your chart and identifies the exact moment a new day or new week begins. It then places a vertical line at that point. This process includes a smart feature to project these lines into the future, helping you visually plan for the days and weeks ahead even before the market gets there.
-
Multi-Faceted Data Visualization: The indicator is designed to present temporal data in multiple formats. Whether it’s coloring the background of each day, drawing a histogram to represent the daily price range, or displaying detailed information in the Data Window, the logic is designed for flexibility. You can configure it to show combined data, such as the week number and day of the year, giving you a deeper context for your analysis.
Core Features
Complete Visual Segmentation Instantly identify daily and weekly boundaries with crystal-clear visual aids.
-
Day and Week Separators: Automatically draw vertical lines at the start of each day and each week.
-
Customizable Line Styles: Choose from solid, dash, dot, and other styles for both day and week lines to create a visual hierarchy that suits your eye.
-
Highlight Special Days: Configure unique colors and line widths for weekends to easily distinguish them from trading days.
Advanced Chart Labeling Add crucial context directly to your chart without clutter.
-
Day and Week Labels: Display the name of the day, the week number, or even the day of the year.
-
Total Font Control: Customize the font name, size, color, and placement (top, middle, or bottom of the chart).
-
Smart Label Positioning: Labels are intelligently placed and can be rotated for a perfect fit, ensuring they never obstruct your view of the price action.
Multiple Display Modes for a Tailored Experience You are in complete control of what you see. Configure the indicator to match your exact trading style and analysis needs.
-
Lines Only Mode: A minimalist view focusing purely on daily and weekly separators.
-
Labels Only Mode: Display temporal context without adding lines to your chart.
-
Histogram Mode: A unique analytical view that colors the daily high-low range according to the day of the week, allowing you to visually compare volatility at a glance.
-
Background Mode: Subtly shade the background of your chart with a unique, fully customizable color for each day of the week.
-
Combined Modes: Mix and match any of these visual elements to create your perfect analytical environment.
Unmatched Customization Every visual element is under your control.
-
Full Color Palette: Assign a unique color to each day of the week (Monday through Sunday) for backgrounds, histograms, and labels.
-
Adjustable Transparency: Control the transparency of the background shading to ensure it enhances, rather than distracts from, the price chart.
-
Future Projection: Extend separator lines into the future to help you visually prepare for the upcoming trading week.
This indicator is an essential tool for day traders, swing traders, and scalpers who want to leverage the power of time-based patterns. Stop guessing and start seeing the market’s weekly structure.
Add the Visual Weekdays Indicator to your toolkit today and gain a decisive edge in your trading.