MACD Swing Low Multi Time Frame Indicator

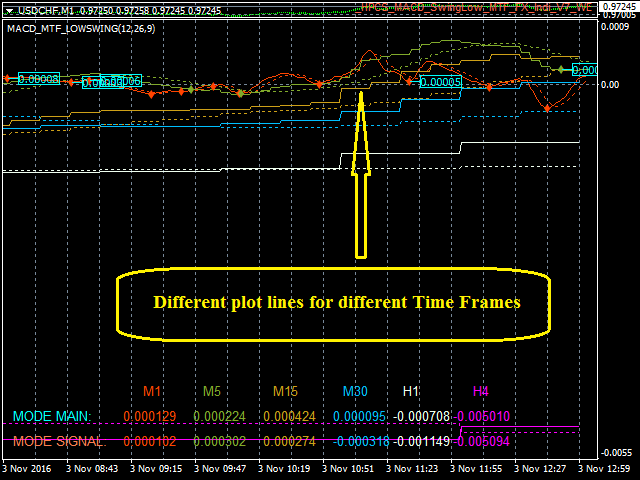
MACD Swing Low Multi Time Frame Indicator is one of the most advanced indicators based on both Swing Low and MACD trading strategies. It supports multiple timeframes, i.e. by attaching the indicator on a single chart, one can see the MACD Swing Low values for all the other timeframes on a single chart. One would just have to select the timeframes, for which he wants to see the calculated values.


Features

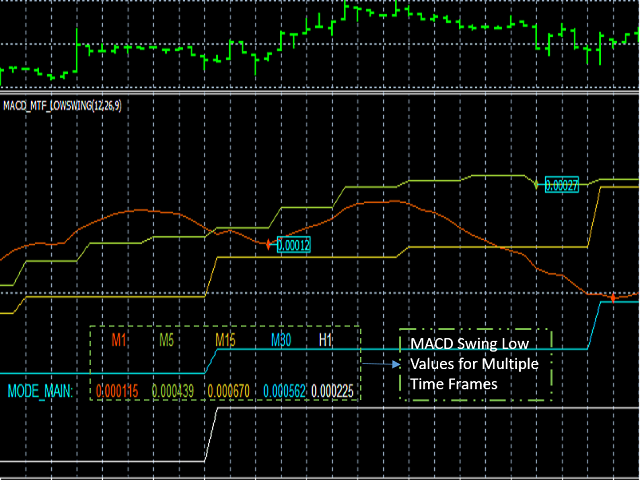
  • On the chart, one can set the option to view the MACD Swing Low calculated values and the MACD Swing Low graph along with the Swing Low values marked on the graph for all the timeframes.
  • Set the condition to check the perfect bar condition for Swing Low calculation.
  • Set the number of bars before the current bar to check for the perfect bar criterion.
  • Set the number of bars after the current bar to check for the perfect bar criterion.
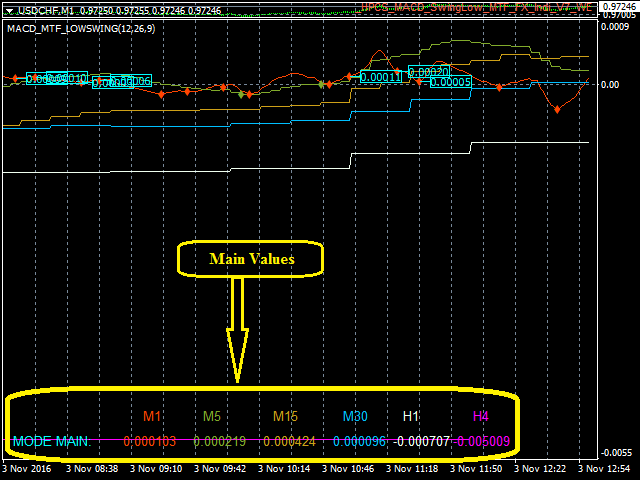
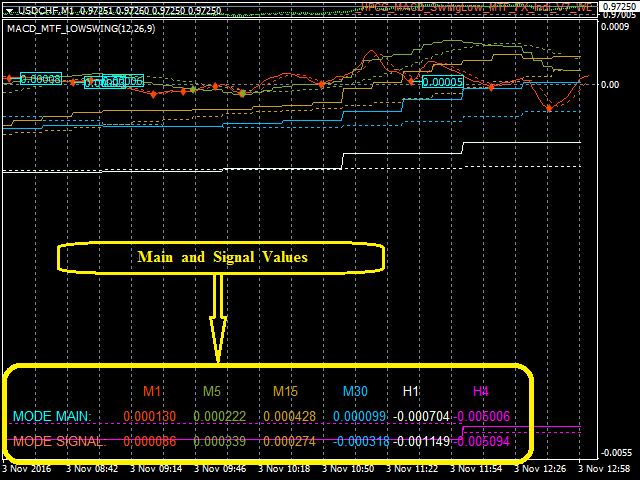
  • View the MACD Swing values of different timeframes on a single chart.
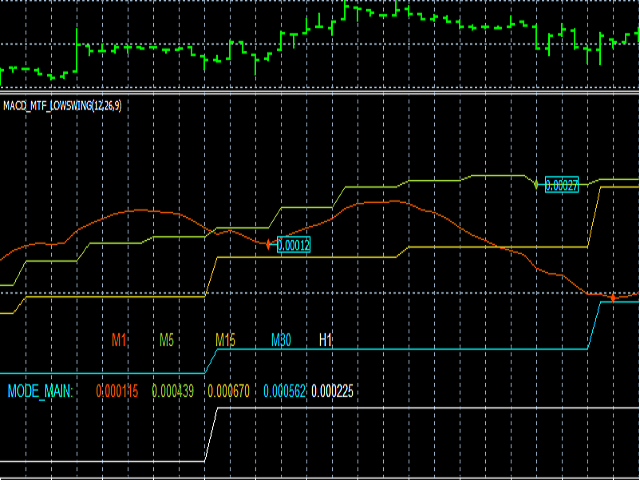
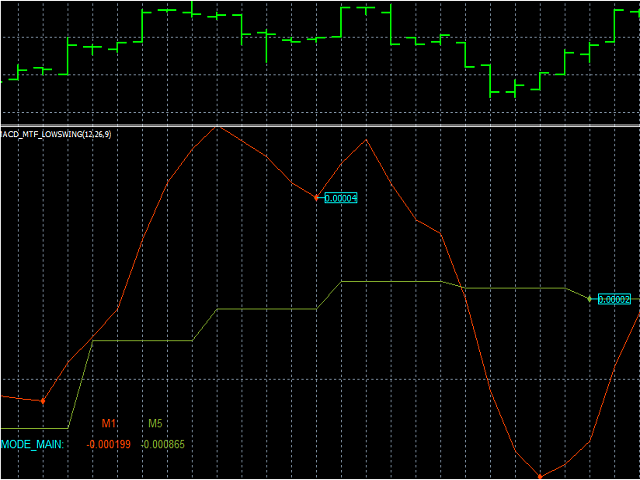
  • View the MACD graph of different timeframes on a single chart along with Swing Low MACD calculated values marked on the graph for different timeframes.
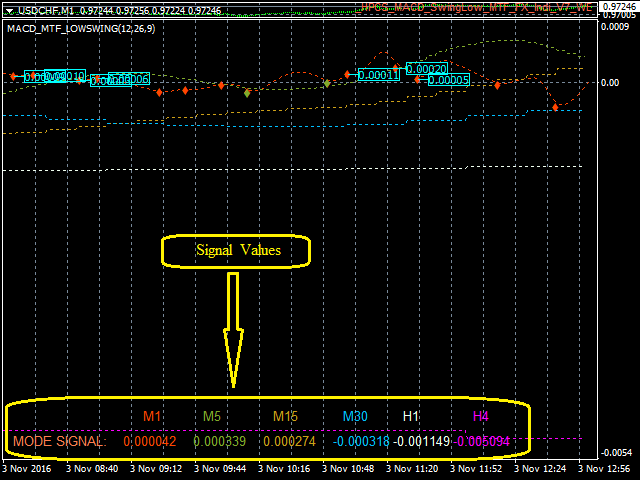
  • Option to view the swing low points on the chart or along with the point values.
  • Change the default colors of the text blocks, chart lines and set your own colors.
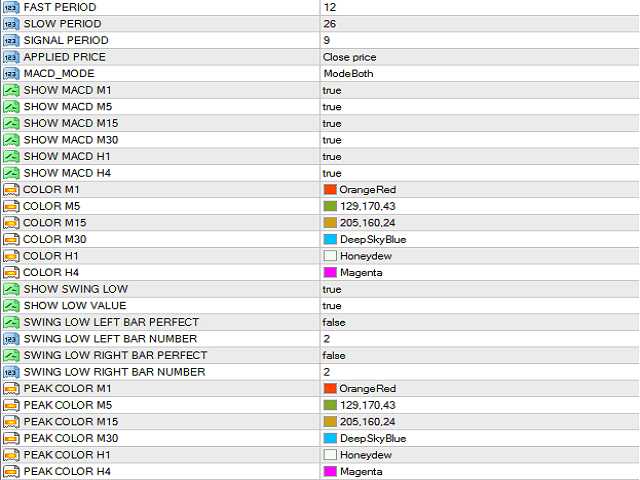
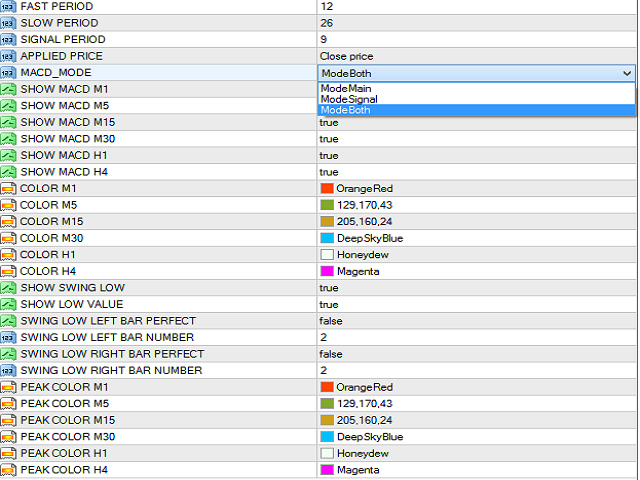

Inputs

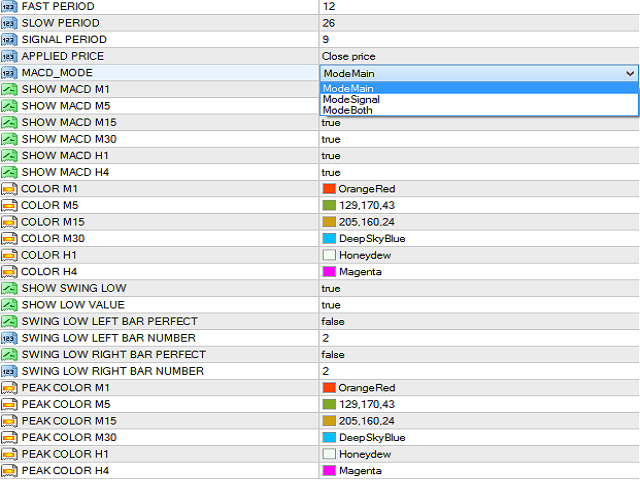
  • FAST_PERIOD: Set fast moving average value
  • SLOW_PERIOD: Set slow moving average value
  • SIGNAL_PERIOD: Set value of signal period of moving average
  • APPLIED_PRICE: Select from Close Price, Open Price, High Price, Low Price, Median Price, Typical Price, Weighted Price
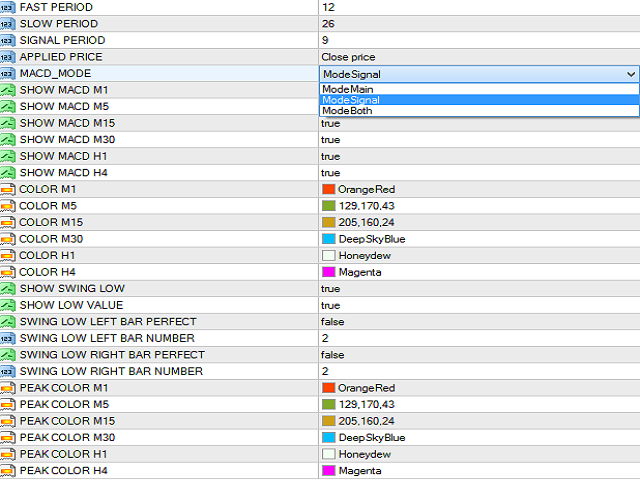
  • MACD_MODE: Select from Mode Main, Mode Signal or Mode Both
  • SHOW_MACD_M1: Enable/Disable MACD calculations on M1 chart
  • SHOW_MACD_M5: Enable/Disable MACD calculations on M5 chart
  • SHOW_MACD_M15: Enable/Disable MACD calculations on M15 chart
  • SHOW_MACD_M30: Enable/Disable MACD calculations on M30 chart
  • SHOW_MACD_H1: Enable/Disable MACD calculations on H1 chart
  • SHOW_MACD_H4: Enable/Disable MACD calculations on H4 chart
  • COLOR_M1: Set the text color for M1 calculated value. Create it as you like it best
  • COLOR_M5: Set the text color for M5 calculated value. Create it as you like it best
  • COLOR_M15: Set the text color for M15 calculated value. Create it as you like it best
  • COLOR_M30: Set the text color for M30 calculated value. Create it as you like it best
  • COLOR_H1: Set the text color for H1 calculated value. Create it as you like it best
  • COLOR_H4: Set the text color for H4 calculated value. Create it as you like it best
  • SHOW_SWING_LOW: Enable/Disable MACD Swing Low point that will be marked on the chart
  • SHOW_LOW_VALUE: MACD Swing Low value on the chart. Choose whether to enable or disable this value as per trader's convenience.
  • SWING_LOW_LEFT_BAR_PERFECT: Enable this value to check for perfect bar condition on the left of the current bar
  • SWING_LOW_LEFT_BAR_NUMBER: How many bars before the current bar the perfect bar condition should check. Set this parameter if you have enabled the previous parameter.
  • SWING_LOW_RIGHT_BAR_PERFECT: Enable this value to check for perfect bar condition on the right of the current bar
  • SWING_LOW_RIGHT_BAR_NUMBER: How many bars after the current bar the perfect bar condition should check. Set this parameter if you have enabled the previous parameter
  • PEAK COLOR_M1: Set the color of Swing Low point for M1. Create it as you like it best
  • PEAK_COLOR_M5: Set the color of Swing Low point for M5. Create it as you like it best
  • PEAK COLOR_M15: Set the color of Swing Low point for M15. Create it as you like it best
  • PEAK_COLOR_M30: Set the color of Swing Low point for M30. Create it as you like it best
  • PEAK COLOR_H1: Set the color of Swing Low point for H1. Create it as you like it best
  • PEAK_COLOR_H4: Set the color of Swing Low point for H4. Create it as you like it best


How to Use

Enable the timeframes, for which you want the MACD Swing Low plot.

Example: Suppose you want the plot for H1 timeframe, then set the SHOW_MACD_H1 input parameter as true.

MACD Swing Low Multi Time Frame Indicator is one of the most useful and time saving indicators. Traders can view the MACD Swing Low values for the different timeframes on a single chart.

Önerilen ürünler
Owl smart levels
Sergey Ermolov
4.24 (37)
MT5 versiyonu  |  FAQ Owl Smart Levels Indicator ,   Bill Williams'ın gelişmiş fraktalları , piyasanın doğru dalga yapısını oluşturan Valable ZigZag ve kesin giriş seviyelerini gösteren   Fibonacci seviyeleri   gibi popüler piyasa analiz araçlarını içeren tek gösterge içinde eksiksiz bir ticaret sistemidir. pazara ve kar elde edilecek yerlere. Stratejinin ayrıntılı açıklaması Gösterge ile çalışma talimatı Baykuş Yardımcısı ticaretinde Danışman Yardımcısı Kullanıcıların özel sohbeti -> Satın ald
Trendiness Index
Libertas LLC
5 (3)
"The trend is your friend" is one of the best known sayings in investing, because capturing large trendy price movements can be extremely profitable. However, trading with the trend is often easier said than done, because many indicators are based on price reversals not trends. These aren't very effective at identifying trendy periods, or predicting whether trends will continue. We developed the Trendiness Index to help address this problem by indicating the strength and direction of price trend
Alpha Trend sign has been a very popular trading tool in our company for a long time. It can verify our trading system and clearly indicate trading signals, and the signals will not drift. Main functions: Based on the market display of active areas, indicators can be used to intuitively determine whether the current market trend belongs to a trend market or a volatile market. And enter the market according to the indicator arrows, with green arrows indicating buy and red arrows indicating se
Power Renko is an indicator which plots Renko bricks underneath the chart using a histogram. You can select the brick size and the timeframe of the Renko bricks as well as whether or not to use the close price or the high/low price of the candles. Renko bricks are based on price alone, not time, therefor the Renko bricks will not be aligned with the chart's time. They are extremely useful for trend trading and many different strategies can be formed from them. Buffers are provided allowing you t
[ZhiBiCCI] indicators are suitable for all cycle use, and are also suitable for all market varieties. [ZhiBiCCI] Green solid line is a reversal of bullish divergence. The green dotted line is a classic bullish divergence. [ZhiBiCCI] The solid line to the red is a reverse bearish divergence. The red dotted line is a classical bearish divergence. [ZhiBiCCI] can be set in the parameters (Alert, Send mail, Send notification), set to (true) to send instant signals to the alarm window, email, insta
Advanced Trend Regime
Shellard Securities (Pty) Ltd
The indicator has been designed to function on any time-frame and any pair.   This regime filter will help the trader better evaluate whether the current market is trending, and in which direction. It quickly reacts to changes in market dynamics using a series of advanced calculations. The user is able to select whether the calculation remains standard, or if a further filter constraint is added to the calculation.   A Yellow moving average of the signal has been included for the trader to smoot
PipFinite Trend PRO
Karlo Wilson Vendiola
4.88 (2248)
Breakthrough Solution For Trend Trading And Filtering With All Important Features Built Inside One Tool! Trend PRO's smart algorithm detects the trend, filters out market noise and gives entry signals with exit levels. The new features with enhanced rules for statistical calculation improved the overall performance of this indicator. Important Information Revealed Maximize the potential of Trend Pro, please visit www.mql5.com/en/blogs/post/713938 The Powerful Expert Advisor Version Automatin
Ticaret hassasiyetinizi Candlestick Pattern Alert MT4 göstergesiyle yükseltin, anahtar mum formasyonlarını hızla tespit etmek ve gerçek zamanlı uyarılar sunmak için tasarlanmış güçlü bir araç, yüksek olasılıklı kurulumlara traderların tepki vermesini sağlar. 1990'larda Steve Nison tarafından popüler hale getirilen Japon mum çubuğu grafikleri prensiplerine dayanan bu gösterge, Hammer, Doji veya Engulfing gibi formasyonlarla piyasa duyarlılığını çözme yeteneği nedeniyle forex, kripto ve hisse sene
Insider Scalper Binary This tool is designed to trade binary options. for short temporary spends. to make a deal is worth the moment of receiving the signal and only 1 candle if it is m1 then only for a minute and so in accordance with the timeframe. for better results, you need to select well-volatile charts.... recommended currency pairs eur | usd, usd | jpy .... the indicator is already configured, you just have to add it to the chart and trade .... The indicator signals the next candle.
Automated Trendlines
Georgios Kalomoiropoulos
5 (16)
Trend çizgileri, forex ticaretinde en önemli teknik analiz aracıdır. Ne yazık ki, çoğu tüccar onları doğru şekilde çizmez. Otomatik Trend Çizgileri göstergesi, piyasaların trend hareketini görselleştirmenize yardımcı olan ciddi tüccarlar için profesyonel bir araçtır. İki tür Trend Çizgisi, Boğa Trend Çizgisi ve Ayı Trend Çizgisi vardır. Yükseliş trendinde, Forex trend çizgisi, fiyat hareketinin en düşük salınım noktalarından geçer. En az iki "en düşük düşük"ü birleştirmek, bir trend çizgisi o
Binary Options Support Resistance Indicator This indicator is designed for binary options trading and effectively shows retracements from support and resistance levels. Signals appear on the current candle. A red arrow pointing downwards indicates a potential selling opportunity, while a blue arrow pointing upwards suggests buying opportunities. All that needs adjustment is the color of the signal arrows. It is recommended to use it on the M1-M5 timeframes as signals are frequent on these timef
Chart Patterns Detect 15 patterns (Ascending Triangle, Descending Triangle, Rising Wedge, Falling Wedge, Bullish Flag, Bearish Flag, Bullish Rectangle, Bearish Rectangle Symmetrical triangle, Head and Shoulders, Inverted Head and Shoulders, Triple top, Triple Bottom, Double Top, Double Bottom) Use historical data to calculate the probability of each pattern to succeed (possibility to filter notification according to the chance of success) gives graphic indication about the invalidation level and
Trend Osilatörü - gelişmiş bir özel Crypto_Forex göstergesi, etkili bir ticaret aracıdır! - Gelişmiş yeni hesaplama yöntemi kullanılır - "Hesaplama için fiyat" parametresi için 20 seçenek. - Şimdiye kadar geliştirilen en akıcı osilatör. - Yükselen trendler için yeşil renk, düşen trendler için kırmızı renk. - Aşırı satım değerleri: 5'in altında, Aşırı alım değerleri: 95'in üzerinde. - Bu göstergeyle standart stratejileri bile yükseltmek için birçok fırsat vardır. - PC ve Mobil uyarılarla. Yüks
This is an arrow indicator without a future function,developed based on the most advanced profit trading algorithms.It has the most innovative and advanced dual trend analysis module, as well as the latest and highly effective market trend prediction algorithm.Trends are your friends, and following larger trends can earn the maximum profit in foreign exchange. This indicator helps traders identify current trends and track them. Someone once made a profit of 10 times in a week by relying on it.No
Trade with Gann on your side!! MASTER CIRCLE 360 CIRCLE CHART, originally created by Gann admitted that this is “The Mother of all charts”. It is one of the last studies that this great trader left for us. The numeric tab le is apparently quite simple like all the tables and is based on square numbers, the SQUARE OF 12 and is by evolution, one of the most important square numbers. Here we can find CYCLE, PRICE AND TIME thanks to angles and grades, to show past and future support and resistance.
The indicator displays the data of the Stochastic oscillator from a higher timeframe on the chart. The main and signal lines are displayed in a separate window. The stepped response is not smoothed. The indicator is useful for practicing "manual" forex trading strategies, which use the data from several screens with different timeframes of a single symbol. The indicator uses the settings that are identical to the standard ones, and a drop-down list for selecting the timeframe. Indicator Paramet
Magical Arrow
Ranguni Abdulsamir Abdulmajid
Magical Arrow Indicator – Clear & Reliable Signals The Magical Arrow Indicator is a non-repainting, trend-following tool that gives you crystal-clear Buy and Sell signals . It  high-probability reversals and entries . No more guesswork – just follow the arrows on your chart! The Magical Arrow Indicator is a powerful, easy-to-use trading tool that helps you catch the most profitable Buy and Sell opportunities in the Forex market. It is designed for beginners and professional traders , giving y
Super Reversal Pattern
Parfait Mujinga Ndalika
Super Reversal Pattern Indicator Unlock the power of advanced pattern recognition with our Super Reversal Pattern Indicator. Designed for traders seeking precision and reliability, this indicator identifies one of the most effective reversal patterns in technical analysis, offering a significant edge in your trading strategy. Key Features: Non-Repainting Accuracy: Enjoy the confidence of non-repainting technology. Once a Super Reversal Pattern is detected, it remains static, providing consiste
PABT Pattern Indicator - it's classical system one of the signal patterns. Indicator logic - the Hi & Lo of the bar is fully within the range of the preceding bar, look to trade them as pullback in trend. In the way if indicator found PABT pattern it's drawing two lines and arrow what showing trend way.  - First line - it's entry point and drawing at: 1. On the high of signal bar or on middle of the signal bar (depending from indicator mode) for buy; 2. On the low of signal bar or on middle of t
Crypto_Forex Göstergesi MT4 için "Sabah Yıldızı deseni". - "Sabah Yıldızı deseni" göstergesi Fiyat Hareketi ticareti için çok güçlü bir göstergedir: Yeniden boyama yok, gecikme yok. - Gösterge grafikte boğa Sabah Yıldızı desenlerini algılar: Grafikte mavi ok sinyali (resimlere bakın). - PC, Mobil ve E-posta uyarılarıyla. - Ayrıca kardeşi - ayı "Akşam Yıldızı deseni" göstergesi mevcuttur (aşağıdaki bağlantıyı takip edin). - "Sabah Yıldızı deseni" göstergesi Destek/Direnç Seviyeleriyle birleştir
The Stepping Trend Indicator     The Steppi ng Trend indicator uses the  average true range  (ATR indicator) in its calculation. This gives you control to set your own average true range period, I set the Default as 10.   Indicator Details. Green Arrow Up: This means you are at the starting point of a new bullish trend, it’s time to buy.   Red  Arrow  Down : This means you are at the starting point of a new  bearish  trend, it’ s time to sell .   What if you miss the Arrow Signal?   No prob
"Auto FIBO Pro" Crypto_Forex göstergesi - ticarette harika bir yardımcı araçtır! - Gösterge, Fibo seviyelerini ve yerel trend çizgilerini (kırmızı renk) otomatik olarak hesaplar ve grafikte yerleştirir. - Fibonacci seviyeleri, fiyatın tersine dönebileceği önemli alanları gösterir. - En önemli seviyeler %23,6, %38,2, %50 ve %61,8'dir. - Ters scalping veya bölge ızgara ticareti için kullanabilirsiniz. - Auto FIBO Pro göstergesini kullanarak mevcut sisteminizi geliştirmek için birçok fırsat vardı
Noize Absorption Index MT4
Ekaterina Saltykova
5 (1)
Noize Absorption Index - is the manual trading system that measures the difference of pressure between bears forces and bulls forces. Green line - is a noize free index that showing curent situation. Zero value of index shows totally choppy/flat market.Values above zero level shows how powerfull bullish wave is and values below zero measures bearish forces.Up arrow appears on bearish market when it's ready to reverse, dn arrow appears on weak bullish market, as a result of reverse expectation. S
The Th3Eng PipFinite indicator is based on a very excellent analysis of the right trend direction with perfect custom algorithms. It show the true direction and the best point to start trading. With StopLoss point and Three Take Profit points. Also it show the right pivot of the price and small points to order to replace the dynamic support and resistance channel, Which surrounds the price. And Finally it draws a very helpful Box on the left side on the chart includes (take profits and Stop loss
Atomic Analyst
Issam Kassas
5 (3)
Öncelikle belirtmek gerekir ki bu Ticaret Göstergesi Yeniden Çizim Yapmaz, Gecikmez ve Gecikme Göstermez, bu da hem manuel hem de robot ticareti için ideal hale getirir. Kullanıcı kılavuzu: ayarlar, girişler ve strateji. Atom Analisti, Piyasada Daha İyi Bir Avantaj Bulmak İçin Fiyatın Gücünü ve Momentumunu Kullanan PA Fiyat Hareketi Göstergesidir. Gürültüleri ve Yanlış Sinyalleri Kaldırmaya ve Ticaret Potansiyelini Artırmaya Yardımcı Olan Gelişmiş Filtrelerle Donatılmıştır. Birden fazla katman
Bu, bir mumun kapanış fiyatını tahmin eden bir göstergedir. Gösterge öncelikle D1 çizelgelerinde kullanılmak üzere tasarlanmıştır. Bu gösterge hem geleneksel forex ticareti hem de ikili opsiyon ticareti için uygundur. Gösterge, bağımsız bir ticaret sistemi olarak kullanılabilir veya mevcut ticaret sisteminize ek olarak hareket edebilir. Bu gösterge, mevcut mumu analiz ederek mumun gövdesi içindeki belirli güç faktörlerini ve önceki mumun parametrelerini hesaplar. Böylece gösterge, piyasa hareket
Renko, Heiken Ashi, Ticks Bar, Range Bar.    Easy switching, easy setup, all in one window.        Place the Custom Chart indicator and view Renko, Heiken Ashi, Tick bar, Range bar charts in real time at real chart.    Position the offline chart window so that the indicator control panel is visible.    Switch the chart mode by click of a button.    Connect to the output chart any indicator, expert advisor without any restrictions.    No, it doesn't work in the tester.    Yes, you can use an
Fibonacci retracement and extension line drawing tool Fibonacci retracement and extended line drawing tool for MT4 platform is suitable for traders who use  golden section trading Advantages: There is no extra line, no too long line, and it is easy to observe and find trading opportunities Trial version: https://www.mql5.com/zh/market/product/35884 Main functions: 1. Multiple groups of Fibonacci turns can be drawn directly, and the relationship between important turning points can be seen
The CCI Divergence is a reasonably useful indicator in itself, but it is even more effective when used with divergence pattern trading. The CCI Divergence indicator signal is one of the most potent signals among the indicators that exist in the market. Here is new version for Divergence Indicator using CCI method, with more improvements. Divergences indicate a potential investment point because the directional moment does not confirm the price. A bullish divergence occurs when the underlying va
Distinctive
Tatiana Savkevych
Distinctive is a forex trending arrow indicator for identifying potential entry points. I like it, first of all, because it has a simple mechanism of work, adaptation to all time periods and trading tactics. Created on the basis of a regression channel with filters. Plotting the Lawrence indicator signals on a price function chart using a mathematical approach. How it works - when the price breaks out in the overbought / oversold zone (channel levels), a buy or sell signal is generated. Everyt
Bu ürünün alıcıları ayrıca şunları da satın alıyor
Miraculous Göstergesi – Gann Dokuz Kareye Dayalı %100 Tekrarlamayan Forex ve İkili Araç Bu video, Forex ve İkili Opsiyon traderları için özel olarak geliştirilmiş son derece doğru ve güçlü bir ticaret aracı olan Miraculous Göstergesi 'ni tanıtıyor. Bu göstergeyi benzersiz kılan, efsanevi Gann Dokuz Karesi ve Gann Titreşim Yasası 'na dayanmasıdır; bu da onu modern ticarette mevcut en hassas tahmin araçlarından biri yapmaktadır. Miraculous Göstergesi tamamen tekrarlamaz ; yani mum kapandıktan son
Şu anda %20 İNDİRİMLİ! Herhangi bir Acemi veya Uzman Tüccar için En İyi Çözüm! Bu gösterge paneli yazılımı 28 döviz çifti üzerinde çalışıyor. Ana göstergelerimizden 2'sine (Gelişmiş Para Birimi Gücü 28 ve Gelişmiş Para Birimi Dürtüsü) dayanmaktadır. Tüm Forex piyasasına harika bir genel bakış sağlar. Gelişmiş Para Birimi Gücü değerlerini, para birimi hareket hızını ve tüm (9) zaman dilimlerinde 28 Forex çifti için sinyalleri gösterir. Trendleri ve / veya scalping fırsatlarını belirlemek için
Scalper Inside PRO
Alexey Minkov
4.74 (69)
An exclusive indicator that utilizes an innovative algorithm to swiftly and accurately determine the market trend. The indicator automatically calculates opening, closing, and profit levels, providing detailed trading statistics. With these features, you can choose the most appropriate trading instrument for the current market conditions. Additionally, you can easily integrate your own arrow indicators into Scalper Inside Pro to quickly evaluate their statistics and profitability. Scalper Inside
F-16 Uçak Göstergesini tanıtıyoruz, ticaret deneyiminizi devrimleştirmek için tasarlanmış son teknoloji bir MT4 aracı. F-16 savaş uçağının eşsiz hızı ve hassasiyetinden ilham alan bu gösterge, finansal piyasalarda eşi benzeri olmayan performans sunmak için ileri algoritmalar ve son teknoloji teknolojileri bir araya getirir. F-16 Uçak Göstergesi ile gerçek zamanlı analiz sunarak yüksek doğruluklu ticaret sinyalleri üretirken rekabetin üzerine çıkacaksınız. Dinamik özellikleri, farklı varlık sınıf
Dynamic Forex28 Navigator
Bernhard Schweigert
4.43 (7)
Dynamic Forex28 Navigator - Yeni Nesil Forex Ticaret Aracı. ŞU ANDA %49 İNDİRİM. Dynamic Forex28 Navigator, uzun zamandır popüler olan göstergelerimizin evrimidir ve üçünün gücünü tek bir göstergede birleştirir: Gelişmiş Döviz Gücü28 Göstergesi (695 inceleme) + Gelişmiş Döviz İMPULS ve UYARI (520 inceleme) + CS28 Kombo Sinyalleri (Bonus). Gösterge hakkında ayrıntılar https://www.mql5.com/en/blogs/post/758844 Yeni Nesil Güç Göstergesi Ne Sunuyor?  Orijinallerde sevdiğiniz her şey, şimdi yeni
Önceden gösterge   Piyasa dönüş seviyelerini ve bölgelerini belirler , fiyatın seviyeye geri dönmesini beklemenize ve yeni bir trendin başlangıcında, sonunda değil, işleme girmenize olanak tanır. Gösteriyor   tersine çevirme seviyeleri       Piyasanın yön değişikliğini teyit ettiği ve daha fazla hareket oluşturduğu yer. Bu gösterge yeniden çizim gerektirmeden çalışır, her türlü enstrüman için optimize edilmiştir ve en yüksek potansiyelini bir enstrümanla birlikte kullanıldığında ortaya koyar.
Hidden Cycles
Lev Vladimirovic Marushkin
5 (1)
Christmas Sale! – The Only 100% Universal Tool Grab Hidden Cycles for only $129 (regular price $179). Stop trading against nature! This is your chance to secure the only indicator rooted in the absolute laws that govern the entire universe. Most tools guess—this one reveals the truth. Offer ends soon — Buy another toy or buy the truth. Your choice... Based on Universal Laws — NOT Some Guy’s Algorithm: Let the market adjust to the Hidden Cycles Geometry — not the other way around. Most indicat
Shogun Trade
Yuki Miyake
5 (1)
SHOGUN Trade [Concept: Command the Market Structure] To win a war, one must see the entire battlefield, not just the skirmishes. SHOGUN Trade elevates your perspective from a reactive foot soldier to a strategic "Commander." By synchronizing analysis across 7 timeframes and identifying the maturity of trends, it allows you to govern your trades with the authority and patience of a "Shogun," entering the market only when the structural advantage is undeniable. 5 Strategic Benefits of Installi
Volatility Trend System - girişler için sinyaller veren bir ticaret sistemi. Oynaklık sistemi, trend yönünde doğrusal ve noktasal sinyaller ve ayrıca yeniden çizme ve gecikme olmaksızın trendden çıkmak için sinyaller verir. Trend göstergesi, orta vadeli trendin yönünü izler, yönünü ve değişimini gösterir. Sinyal göstergesi volatilitedeki değişikliklere dayalıdır ve piyasa girişlerini gösterir. Gösterge, çeşitli uyarı türleri ile donatılmıştır. Çeşitli alım satım araçlarına ve zaman dilimlerine
Entry Points Pro
Yury Orlov
4.62 (172)
Yeniden boyamadan bir ticarete girmek için doğru sinyaller sağlayan MT5 için en iyi gösterge! Herhangi bir finansal varlığa uygulanabilir: forex, kripto para birimleri, metaller, hisse senetleri, endeksler. MT5 versiyonu burada Oldukça doğru alım satım sinyalleri sağlayacak ve bir alım satımı açıp kapatmanın en iyi zamanını size söyleyecektir. Göstergeyi ödeyen yalnızca bir sinyali işleme örneğiyle videoyu (6:22) izleyin! Çoğu tüccar, Giriş Noktaları Pro göstergesinin yardımıyla ilk işlem h
Adaptive Volatility Range [AVR] is a powerful tool for identifying key trend reversal points. AVR accurately reflects the Average True Range (ATR) of volatility, taking into account the Volume-Weighted Average Price (VWAP). The indicator adapts to any market volatility by calculating the average volatility over a specific period, ensuring a stable rate of profitable trades. You receive not just an indicator but a professional automated trading system , AVR-EA . Advantages: Automated Trading Sys
ŞU ANDA %26 INDIRIMLI !!! Bu gösterge, her iki ana göstergemizin ( Advanced Currency Strength 28  &   Advanced Currency IMPULSE with ALERT )  süper bir kombinasyonudur. TICK-UNITS için Para Birimi Gücü değerlerini ve 28 Forex çifti için uyarı sinyallerini gösterir. 11 farklı Tick-Unit kullanılabilir. Bunlar 1, 2, 3, 4, 5, 6, 10, 12, 15, 20 ve 30 Saniyedir. Alt penceredeki Tick-Unit çubuğu, saniyenin zamanlayıcısı içinde en az 1 tik olduğunda gösterilecek ve sola kaydırılacaktır.  Yalnızca BİR
Ortalama geri dönüş ticareti için profesyonel ve nicel bir yaklaşım uygulayan benzersiz gösterge. Fiyatın tahmin edilebilir ve ölçülebilir bir şekilde ortalamaya döndüğü ve yön değiştirdiği gerçeğinden yararlanır, bu da nicel olmayan ticaret stratejilerinden büyük ölçüde daha iyi performans gösteren net giriş ve çıkış kurallarına izin verir. [ Installation Guide | Update Guide | Troubleshooting | FAQ | All Products ] Ticaret sinyallerini temizle Ticaret yapmak inanılmaz derecede kolay Özelleşt
Currency Strength Exotics
Bernhard Schweigert
4.88 (33)
ŞU ANDA %20 INDIRIMLI! Herhangi bir Acemi veya Uzman Tüccar için En İyi Çözüm! Bu Gösterge, Egzotik Çiftler Emtialar, Endeksler veya Vadeli İşlemler gibi herhangi bir sembol için para birimi gücünü göstermek için uzmanlaşmıştır. Türünün ilk örneğidir, Altın, Gümüş, Petrol, DAX, US30, MXN, TRY, CNH vb. gerçek para birimi gücünü göstermek için 9. satıra herhangi bir sembol eklenebilir. Bu benzersiz, yüksek kaliteli ve uygun fiyatlı bir ticaret aracıdır çünkü bir dizi tescilli özelliği ve yeni b
GOLD Impulse with Alert
Bernhard Schweigert
4.64 (11)
Bu gösterge, 2 ürünümüz Advanced Currency IMPULSE with ALERT  +   Currency Strength Exotics  'in süper bir kombinasyonudur. Tüm zaman dilimleri için çalışır ve 8 ana para birimi artı bir Sembol için grafiksel olarak güç veya zayıflık dürtüsünü gösterir! Bu Gösterge, Altın, Egzotik Çiftler, Emtialar, Endeksler veya Vadeli İşlemler gibi herhangi bir sembol için para birimi gücü ivmesini göstermek için uzmanlaşmıştır. Türünün ilk örneğidir, Altın, Gümüş, Petrol, DAX, US30, MXN, TRY, CNH vb. içi
Cycle Sniper
Elmira Memish
4.39 (36)
Please contact us after your purchase and we will send you the complimentary indicators to complete the system Cycle Sniper is not a holy grail but when you use it in a system which is explained in the videos, you will feel the difference. If you are not willing to focus on the charts designed with Cycle Sniper and other free tools we provide, we recommend not buying this indicator. We recommend watching the videos about the indiactor and system before purchasing. Videos, settings  and descri
Supply and Demand Dashboard PRO
Bernhard Schweigert
4.8 (20)
Şu anda %20 İNDİRİMLİ! Bu gösterge paneli, birden fazla sembol ve 9 zaman dilimine kadar çalışan çok güçlü bir yazılım parçasıdır. Ana göstergemize dayanmaktadır (En iyi yorumlar: Advanced Supply Demand ).     Gösterge paneli harika bir genel bakış sağlar. Gösterir:    Bölge mukavemet derecesi dahil filtrelenmiş Arz ve Talep değerleri, Bölgelere/ve bölgeler içindeki pip mesafeleri, İç içe geçmiş bölgeleri vurgular, Tüm (9) zaman dilimlerinde seçilen semboller için 4 çeşit uyarı verir. Kişisel
BinaryIndicator is a highly accurate indicator for trading binary options. It shows excellent results in scalping. This indicator is based in multifactor analysis of trend indicators, as well as confirmation oscillators, which in the end gives an increased accuracy of signals. Advantages of the indicator Increased accuracy of signals. Excellent results when trading binary options with a short expiration time from M30 to M1 . It works on any timeframes. Works with any trade symbols. Parameters
Bu gösterge, pratik ticaret için mükemmel olan otomatik dalga analizine yönelik bir göstergedir! Dava... Not:   Dalga sınıflandırması için Batılı isimleri kullanmaya alışkın değilim. Tang Lun'un (Tang Zhong Shuo Zen) adlandırma kuralının etkisiyle, temel dalgayı   kalem   , ikincil dalga bandını ise   segment   olarak adlandırdım. aynı zamanda segmentin trend yönü vardır. Adlandırma   esas olarak trend segmentidir   (bu adlandırma yöntemi gelecekteki notlarda kullanılacaktır, öncelikle söyleyey
Trend Lines PRO
Roman Podpora
5 (1)
TREND ÇİZGİLERİ PRO     Piyasanın gerçek yön değişimini anlamaya yardımcı olur. Gösterge, gerçek trend dönüşlerini ve büyük oyuncuların piyasaya yeniden girdiği noktaları gösterir. Anlıyorsun     BOS hatları  Daha yüksek zaman dilimlerindeki trend değişiklikleri ve önemli seviyeler, karmaşık ayarlar veya gereksiz gürültü olmadan gösterilir. Sinyaller yeniden çizilmez ve çubuk kapandıktan sonra grafikte kalır. Göstergenin gösterdiği şey: Gerçek değişimler  trend (BOS çizgileri) Bir sinyal göründ
Başlık: BBMA Yapı Rehberi - BBMA Yapı Rehberi Açıklama: BBMA Yapı Rehberi, BBMA yapısının evrimini daha kolay ve verimli anlamak için tasarlanmış özel bir MQL4 göstergesidir. BBMA veya "Bollinger Bands Moving Average", "Bir Adım Önde" sloganıyla bilinir ve piyasa yapısını derinlemesine anlamanın önemini vurgular. BBMA Yapı Rehberi ile fiyat dalgalanmalarını tetikleyen temel piyasa yapı desenlerini hızlı bir şekilde tanımlayabilirsiniz. Bu, daha bilinçli ve etkili ticaret kararları almanıza ya
Meravith
Ivan Stefanov
5 (1)
Gösterge, her noktadan hacmi analiz eder ve bu hacim için piyasa tükenme seviyelerini hesaplar. Üç çizgiden oluşur: Boğa hacmi tükenme çizgisi Ayı hacmi tükenme çizgisi Piyasa trendini gösteren bir çizgi. Bu çizgi, piyasanın boğa mı yoksa ayı mı olduğunu yansıtacak şekilde rengini değiştirir. Piyasayı istediğiniz herhangi bir başlangıç noktasından analiz edebilirsiniz. Bir hacim tükenme çizgisine ulaşıldığında, bir sonraki analize başlamak için yeni bir nokta belirleyin. Herhangi bir şeyi analiz
Tanıtım       Kuantum Trend Keskin Nişancı Göstergesi   , trend tersine dönmeleri belirleme ve ticaret yapma şeklinizi değiştiren çığır açan MQL5 Göstergesi! 13 yılı aşkın ticaret tecrübesine sahip deneyimli tüccarlardan oluşan bir ekip tarafından geliştirilmiştir.       Kuantum Trend Keskin Nişancı Göstergesi       trend dönüşlerini son derece yüksek doğrulukla belirlemenin yenilikçi yolu ile ticaret yolculuğunuzu yeni zirvelere taşımak için tasarlanmıştır. ***Kuantum Trend Keskin Nişancı Göst
Quantum Breakout Indicator PRO
Bogdan Ion Puscasu
4.96 (26)
Tanıtım       Quantum Breakout PRO   , Breakout Bölgeleri ile ticaret yapma şeklinizi değiştiren çığır açan MQL5 Göstergesi! 13 yılı aşkın ticaret deneyimine sahip deneyimli tüccarlardan oluşan bir ekip tarafından geliştirilen   Quantum Breakout PRO   , yenilikçi ve dinamik koparma bölgesi stratejisiyle ticaret yolculuğunuzu yeni zirvelere taşımak için tasarlanmıştır. Kuantum Breakout Göstergesi, size 5 kar hedefi bölgesi ile kırılma bölgelerinde sinyal okları ve kırılma kutusuna dayalı olara
Golden Gendut
Anthonius Soruh
5 (1)
Gendel Gendut is Binary Option Indicator From @realTatino Trade with expaired time Pairs : All Forex Pair Time Frame : M5 only Trade Time All Time Alert : Alert Message, Alert Email, Alerts Push Buffer : 4 Buffer (0,2 (Buy) || 1,3 (Sell) Broker Suitable : All Broker Binary With Forex Pair Auto Trade : Yes Repaint : NO Delay : NO Other Binary Indicator : https://www.mql5.com/en/market/product/70915 https://www.mql5.com/en/market/product/71054 https://www.mql5.com/en/market/product/57755 etc IND
Presenting one-of-a-kind Gann Indicator for XAUUSD IQ Gold Gann Levels is a non-repainting, precision tool designed exclusively for XAUUSD/Gold intraday trading. It uses W.D. Gann’s square root method to plot real-time support and resistance levels, helping traders spot high-probability entries with confidence and clarity. William Delbert Gann (W.D. Gann) was an exceptional market analyst whose trading technique was based on a complex blend of mathematics, geometry, astrology, and ancient calcul
ACB Breakout Arrows
KEENBASE SOFTWARE SOLUTIONS
4.15 (34)
ACB Breakout Arrows göstergesi, özel bir kırılma modelini tespit ederek piyasada kritik bir giriş sinyali sağlar. Gösterge, belirli bir yönde güçlenen momentumu sürekli tarar ve büyük bir hareket başlamadan hemen önce doğru giriş sinyalini verir.  Çoklu sembol ve çoklu zaman dilimi tarayıcıyı buradan edinin - ACB Breakout Arrows MT4 için Tarayıcı Temel Özellikler Gösterge, Stop Loss ve Take Profit seviyelerini otomatik olarak sağlar. Tüm zaman dilimlerinde kırılma sinyallerini takip eden MTF Ta
POWR Rise Coming
Trade Indicators LLC
This indicator is SO SIMPLE… when the green Rise Coming arrow appears, a price drop may be on the way! Plain and easy profits! As you receive more than one 'Rise Coming' text signal in a downtrend, it means momentum is building larger for a bull run. HOW TO USE 1. When the green "Rise Coming" text appears, a price jump may be on the way! This indicator Never Repaints! To get the best setting it's a matter of tweaking the indicator until it gives you the best results. Our recommendation, and what
Unlock hidden profits: accurate divergence trading for all markets Tricky to find and scarce in frequency, divergences are one of the most reliable trading scenarios. This indicator finds and scans for regular and hidden divergences automatically using your favourite oscillator. [ Installation Guide | Update Guide | Troubleshooting | FAQ | All Products ] Easy to trade Finds regular and hidden divergences Supports many well known oscillators Implements trading signals based on breakouts Display
Price Action Entry Alerts
Stephen Sanjeeve Sahayam
5 (3)
Bu gösterge, alış veya satış baskısı için her çubuğu tarar ve en yüksek hacme sahip 4 tip mum modelini tanımlar. Bu mumlar daha sonra Alış veya Satış sinyallerini göstermek için birkaç doğrusal filtre kullanılarak filtrelenir. Sinyaller, daha yüksek zaman çerçevesi yönüyle bağlantılı olarak ve yüksek hacimli saatlerde alım satım yapıldığında en iyi sonucu verir. Tüm filtreler özelleştirilebilir ve bağımsız çalışır. Bir düğmeyi tıklayarak tek bir yönün sinyallerini görüntüleyebilir. Bu gösterge
Yazarın diğer ürünleri
The Expert Advisor (EA) generates an advanced trading tool to place a pending or market order on any currency pair symbol , as selected from a drop-down menu in the panel. A market order is placed by clicking appropriate Sell or Buy button. On the other hand, a pending order is placed by selecting a pending order type and thereafter clicking Place button. Moreover, the panel provides various options to define exact parameters for every order before placing it. For instance, the triggering price
Slow Pips OCO Trade Panel is an advanced trading panel for placing pending orders. Traders can use this panel to place two pending orders at once. One pending order would be of buy entry type and the other one would be of sell entry type. Both orders will have Stop Loss and Take Profit parameters. Since two pending orders are placed at the same time, the pending order for which the price hits first gets converted into a market order and the other pending order gets deleted (one order cancels the
This indicator works on the binary options It uses stochastic strategy to indicate the upcoming trend of the market This indicator helps traders to place a trade with the prediction involved on the stochastic strategy. This indicator makes use of the symbols to indicate the prediction regarding the order. Symbols The upward symbol predicts the trend going up, so that traders can place trades accordingly. The downward symbol predicts the trend going down, so that the trader can place trades acc
Market Hour Indicator is one the most useful indicators for the traders who trade in different markets. The indicator highlights the area in the chart during which a particular market is open. It operates on four different markets i.e. New York Stock Exchange, Australian Stock Exchange, Tokyo Stock Exchange and London Stock Exchange. The indicator is intended for use on M1, M5, M15, M30 and H1 time frames only. Input Parameters NYSEMarket: Enable/Disable for NYSE market NYSEMarketOpeningTime: S
Spread Based pair trading tool It is a very useful tool for commodities traders . Specially those traders who trade crude oil and brent oil. This is also a good strategy for any two pairs which have very high correlation. This panel consists of Two drop downs to select two symbols. One should chose two mutually correlated symbols. Fields to enter a spread value and trade lot size. How a trade in this panel is placed? When you click on the place order button, it starts tracking the market and s
This is a panel which can be used by the users to place a pending order in which they can customize their order while working on the chart. This panel allows its user to input their trade values. It is an easy to use panel from which user can place their pending orders quickly. Inputs of this Panel Includes Price - The user inputs the price to place pending trade. Type - The user inputs the type of pending trade (BL,SL,BS,SS). Lot Size - The user inputs the lot size for the trade. Risk% - The u
This panel is a one stop solution to all your trading problems Trading made easy. This panel allows trader to place orders (instant or pending) and close the respective orders (ALL, PROFIT, LOSS) just from one panel Traders can use it to make any type of trade on the chart itself Description Close Order All - close all open orders. Profit - close profitable ones. Loss - close loss-making ones. Select Order Amount type (Lots, Money, Risk%) Select Stop Loss Price SL Pips - distance in pips to se
Filtrele:
İnceleme yok
İncelemeye yanıt